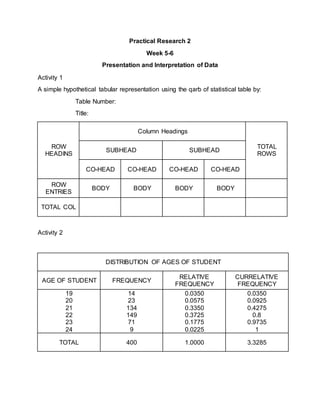
Practical Research 2
Week 5-6
Presentation and Interpretation of Data
Activity 1
A simple hypothetical tabular representation using the qarb of statistical table by:
Table Number:
Title:
ROW
HEADINS
Column Headings
TOTAL
ROWS
SUBHEAD SUBHEAD
CO-HEAD CO-HEAD CO-HEAD CO-HEAD
ROW
ENTRIES
BODY BODY BODY BODY
TOTAL COL
Activity 2
DISTRIBUTION OF AGES OF STUDENT
AGE OF STUDENT FREQUENCY
RELATIVE
FREQUENCY
CURRELATIVE
FREQUENCY
19
20
21
22
23
24
14
23
134
149
71
9
0.0350
0.0575
0.3350
0.3725
0.1775
0.0225
0.0350
0.0925
0.4275
0.8
0.9735
1
TOTAL 400 1.0000 3.3285
Activity 3
Practical research 2 week 3 4

Practical research 2 week 3 4

  • 1.
    Practical Research 2 Week5-6 Presentation and Interpretation of Data Activity 1 A simple hypothetical tabular representation using the qarb of statistical table by: Table Number: Title: ROW HEADINS Column Headings TOTAL ROWS SUBHEAD SUBHEAD CO-HEAD CO-HEAD CO-HEAD CO-HEAD ROW ENTRIES BODY BODY BODY BODY TOTAL COL Activity 2 DISTRIBUTION OF AGES OF STUDENT AGE OF STUDENT FREQUENCY RELATIVE FREQUENCY CURRELATIVE FREQUENCY 19 20 21 22 23 24 14 23 134 149 71 9 0.0350 0.0575 0.3350 0.3725 0.1775 0.0225 0.0350 0.0925 0.4275 0.8 0.9735 1 TOTAL 400 1.0000 3.3285
  • 2.