This document provides step-by-step instructions for creating a digital story in PowerPoint. It outlines 4 phases: 1) writing the story and creating a storyboard, 2) gathering images and audio files, 3) adding narration and slide transitions, and 4) adding a soundtrack. The instructions provide detailed guidance for tasks like formatting slides, inserting pictures and audio, recording narration, setting transition timing and stopping soundtrack playback. Followers these steps allows one to develop a digital story with synchronized visuals, narration and music.
PowerPointLabs (http://www.comp.nus.edu.sg/~pptlabs/) is an add-in for PowerPoint to help less-experience user to make professional-look presentation slides. This presentation is a brief tutorial about the PowerPointLabs.
Beginners' guide to Powerpoint is a how to guide for using Microsoft Powerpoint as a presentation or document, including how to add text, images, video, using transitions and how to add animations, as well as some tips for design.
Construct maps are important tools in educational assessment and can serve multiple purposes related to development and validation, as well as score interpretation and use. This chapter outlines a process for developing a construct map from the qualitative ordering of teachers’ responses to open-ended assessment items. The construct of interest pertains to a teacher’s ability to attend to what students say and do, which is a key component of many recommendations for instructional practice within mathematics education. The instrument we are developing is designed to measure teachers’ attentiveness to student thinking in quantitative reasoning problem situations. A key aspect of our instrument development process is the development of a construct map that hierarchically orders qualitatively different levels of teacher attentiveness. In this chapter we describe our process for developing the construct map with the intent of providing an example to others who may be interested in engaging in the development of construct maps.
Scholars across many disciplines have grappled with questions of what it means for a person to
be and interact online. Who are we when we go online? How do others know we are there and
how do they perceive us? Within the context of online learning, scholarly questions tend to
reflect more specific concerns focused on how well people can learn in a setting limited to
mediated interactions lacking various communication cues. For example, how can a teacher and
students come to know each other if they cannot see each other? How can they effectively
understand and communicate with each other if they are separated by space and, in many
instances, time? These concerns are related to issues of social presence and identity, both of
which are complex, multi-faceted, closely interrelated constructs.
In search of a better understanding of social presence: An investigation into...Patrick Lowenthal
Research on social presence and online learning continues to grow. But to date,
researchers continue to define and conceptualize social presence very
differently. For instance, at a basic level, some conceptualize social presence as
one of three presences within a Community of Inquiry, while others do not.
Given this problem, we analyzed how researchers in highly cited social
presence research defined social presence in an effort to better understand how
they are defining social presence and how this might be changing over time. In
this article, we report the results of our inquiry and conclude with implications
for future research and practice.
Open Access Journals in Educational Technology: Results of a Survey of Exper...Patrick Lowenthal
As the academic publishing industry evolves, there has been an unprecedented growth of “open access journals” (OAJs). In educational technology alone, with an estimated 250 or more total journals, nearly one-third are designated as “open.” Though OAJs are lauded for their contribution to social justice issues (reduction of subscription requirement barriers), many people are suspicious of the content found in them and question the legitimacy of publishing in them. In this study, we sought to discover the opinions of educational technology scholars about OAJs in their own field. We were able to learn which OAJs were deemed to be most valuable, as well as the characteristics of OAJs thought to be particularly important. A companion site accompanies this article, http://edtechjournals.org
In Search of Quality: Using Quality Matters to Analyze the Quality of Massive...Patrick Lowenthal
The concept of the massive, open, online course (MOOC) is not new, but high-profile initiatives have moved them into the forefront of higher education news over the past few years. Members of institutions of higher education have mixed feelings about MOOCs, ranging from those who want to offer college credit for the successful completion of MOOCs to those who fear MOOCs are the end of the university as we know it. We set forth to investigate the quality of MOOCs by using the Quality Matters quality control framework. In this paper, we present the results of our inquiry, with a specific focus on the implications the results have on day-today practice of designing online courses.
Getting graphic About Infographics: Design Lessons Learned From Popular Infog...Patrick Lowenthal
People learn and remember more efficiently and effectively through the use of text and visuals than through text alone. Infographics are one way of presenting complex and dense informational content in a way that supports cognitive processing, learning, and future recognition and recollection. But the power of infographics is that they are a way of delivering the maximum amount of content in the least amount of space while still being precise and clear; because they are visual presentations as opposed to oral or text presentations, they can quickly tell a story, show relationships, and reveal structure. The following paper reports on an exploration of top 20 “liked” infographics on a popular infographic sharing website in an effort to better understand what makes an effective infographic in order to better prepare graduate students as consumers and designers of infographics. The paper concludes with recommendations and strategies on how educators might leverage the power of infographics in their classrooms.
Intentional Web Presence for Research and Technology ProfessionalsPatrick Lowenthal
Intentionally creating a well-crafted online presence, sometimes called a web presence, is important not only for recent graduates but for any professional in a community of practice that values technology use and innovation (e.g., information technology, computer science, digital and graphic design); also, professionals who work with external stakeholders (e.g., consultants working with clients, teachers working with parents, artists working with customers and funding sources) benefit from attention to their web presence. In this presentation, I will share why professionals need to attend to their web presence and share some strategies for crafting the components of a vibrant and dynamic professional web presence and digital footprint.
AERA 2015 Instructional Design Lessons Learned From Reviewing Popular Infogra...Patrick Lowenthal
Infographics are one way of presenting complex and dense informational content in a way the supports cognitive processing, learning, and future recognition and recollection. Infographics, as the name implies, are a way of presenting information graphically. But the power of infographics is that they are a way of delivering the maximum amount of content in the least amount of space while still being precise and clear. In this session we will share the results of our inquiry into what makes an effective infographic. Derived from our inquiry, we will share recommendations on how educators might leverage the power of infographics in their classrooms, and assignments we now use with our students.
Online video is believed to help build social presence and community in online courses. But do students actually watch these videos? And what do they think of them? Do they always build social presence for every student? This mixed methods exploratory study investigates students’ perceptions of online video and the degree to which different uses of online video (e.g., video announcements, instructional screencasts, and video feedback) help establish and maintain social presence. The results of the study and the implications for faculty and instructional designers will be discussed in this session.
Intentional Web Presence for Educational Technology ProfessionalsPatrick Lowenthal
Educational technology professionals must be digitally literate. Part of this involves effectively managing one’s web presence. In this presentation, I will argue that educational technology professionals need to practice what they preach by attending to their web presence. I will share strategies for crafting the components of a vibrant and dynamic professional web presence such as creating a personal website, engaging in social networking, contributing and sharing resources/artifacts, and attending to search engine optimization (SEO).
PASSHE 2015: If You Record It, Will They Watch It? And Will It Matter? Explor...Patrick Lowenthal
If You Record It, Will They Watch It? And Will It Matter? Exploring Student Perceptions of Online Video
Online videos can help build presence and community in online courses. But do students actually watch these videos? The presenter will share his experience using asynchronous video (e.g., video announcements, video feedback) as well as share research on students perceptions of asynchronous video, while engaging the audience in their own use of rich media.
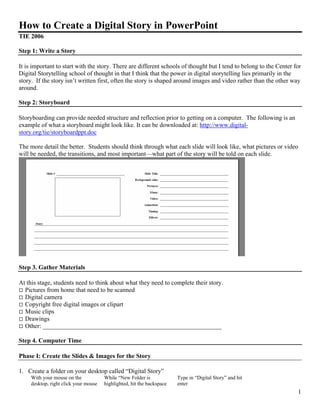
1. How to Create a Digital Story in PowerPoint
TIE 2006
Step 1: Write a Story
It is important to start with the story. There are different schools of thought but I tend to belong to the Center for
Digital Storytelling school of thought in that I think that the power in digital storytelling lies primarily in the
story. If the story isn’t written first, often the story is shaped around images and video rather than the other way
around.
Step 2: Storyboard
Storyboarding can provide needed structure and reflection prior to getting on a computer. The following is an
example of what a storyboard might look like. It can be downloaded at: http://www.digital-
story.org/tie/storyboardppt.doc
The more detail the better. Students should think through what each slide will look like, what pictures or video
will be needed, the transitions, and most important—what part of the story will be told on each slide.
Step 3. Gather Materials
At this stage, students need to think about what they need to complete their story.
Pictures from home that need to be scanned
Digital camera
Copyright free digital images or clipart
Music clips
Drawings
Other: _________________________________________________________
Step 4. Computer Time
Phase I: Create the Slides & Images for the Story
1. Create a folder on your desktop called “Digital Story”
With your mouse on the While “New Folder is Type in “Digital Story” and hit
desktop, right click your mouse highlighted, hit the backspace enter
1
2. click “New” “Folder” key to type in a new name
2. Create two folders in the “Digital Story” folder. One called “images” & one called “audio”
It should look like this
3. Open a blank Presentation in PowerPoint.
By default PowerPoint should open a blank presentation. If it doesn’t, create a blank presentation by going
to “File” “New” “Blank Presentation”
4. Save the presentation in the “Digital Story” Folder.
Follow whatever naming convention works for you. Typically including your name and / or the title is a
good idea. I named mine, “lowenthal_first_computer”
5. Copy all the images you scanned in or got from the web into the “images folder”
6. Working from the storyboard, type the title on the first slide and your name
2
3. 7. Based on the storyboard, adjust the background color (& font if needed).
Click on “Format” “Background” Click the drop down arrow, click on a color or select
“more colors”. Click “Apply to All” if the entire
story will have the same background.
8. Insert a new slide.
This can be done by clicking on “Insert” “New Slide” or the “New Slide” button
9. Change the layout of the new slide to a blank presentation layout
10. Insert your first picture according to your storyboard
Click “Insert” “Picture” “From File…” Click on the picture and click “Insert”
3
4. 11. Adjust picture as needed
To enlarge, click on picture Put your mouse over the white Or put your mouse over the image right click the
circle until it turns into an mouse format picture. Then adjust the picture or size
double sided arrow. Click down tab.
and drag to adjust size
12. Repeat steps 8 & 11 for each slide and picture needed according to your story board.
I created eight more slides based on my storyboard
Phase II: Narration
13. Record your narration (note: if you plan to transfer your story into another tool like M.S. Producer, you
might want to think about recording your narration outside of PowerPoint to enable more control). Before
you can record the narration, you will need to plug in a microphone in a computer.
▪ Go to the first slide of the PowerPoint, then click on “Slide Show” and then “Record Narration”
4
5. ▪ Click on “Set Microphone Level…” to adjust your microphone level and click on “Change Quality…” to
adjust the sound quality.
▪ To create separate audio files when narrating, click on “Browse” and then select the audio folder and click
“Select”
▪ Click “OK” to start recording
5
6. ▪ Click the mouse (or space bar) to move to the next slide while recording your story into the microphone.
Your storyboard should guide how the story and the slides align. This might take a few times to get the
hand of it.
▪ To delete a narration, click on each slide, click on the audio icon, and press the delete key.
Then open the audio folder and delete each of the audio tracks
Phase III: Transitions
14. Add Slide Transition(s) to the story. For simplicity sake, one type of transition will be added to all the
slides and then adjusted on each slide
15. Click on “Slide Show” then “Slide Transition”
Then select a transition, adjust the speed, click “Automatically after” and pick a time (note: this will need to be
adjusted later to coincide with your narration) and click “Apply to All Slides”
6
7. 16. Preview your slide show. Make notes of what slides the timing needs to be adjusted.
Now go slide by slide and adjust the timing of each slide to align with your narration by clicking on the slide
and adjusting the timing. Click “Play” to preview
7
8. Phase IV: Add a Soundtrack
17. Add a soundtrack
Click on the first slide and click on “Insert” “Movies and Sounds” “Sound File…”
18. Find your soundtrack in your audio folder and click “OK”
8
9. 19. When prompted when to start the sound, click “Automatically”
20. To adjust the sound so it will play correctly, go to “Slide Show” and then “Custom Animation…”
21. Click on the drop down arrow on your soundtrack clip and click on “Effect Options…”
22. Click on “Stop Playing” … “After” and adjust the number to the total number of slides in your story. Click
“OK”
9
10. 23. Preview your story. To adjust the level of the narration or the soundtrack, click on the sound icon and right
click your mouse and select “Edit Sound Object”.
Adjust the volume by clicking on “Sound Volume”
Click on “Hide sound icon during slide show” to hide the icon
24. Preview and save your story
10