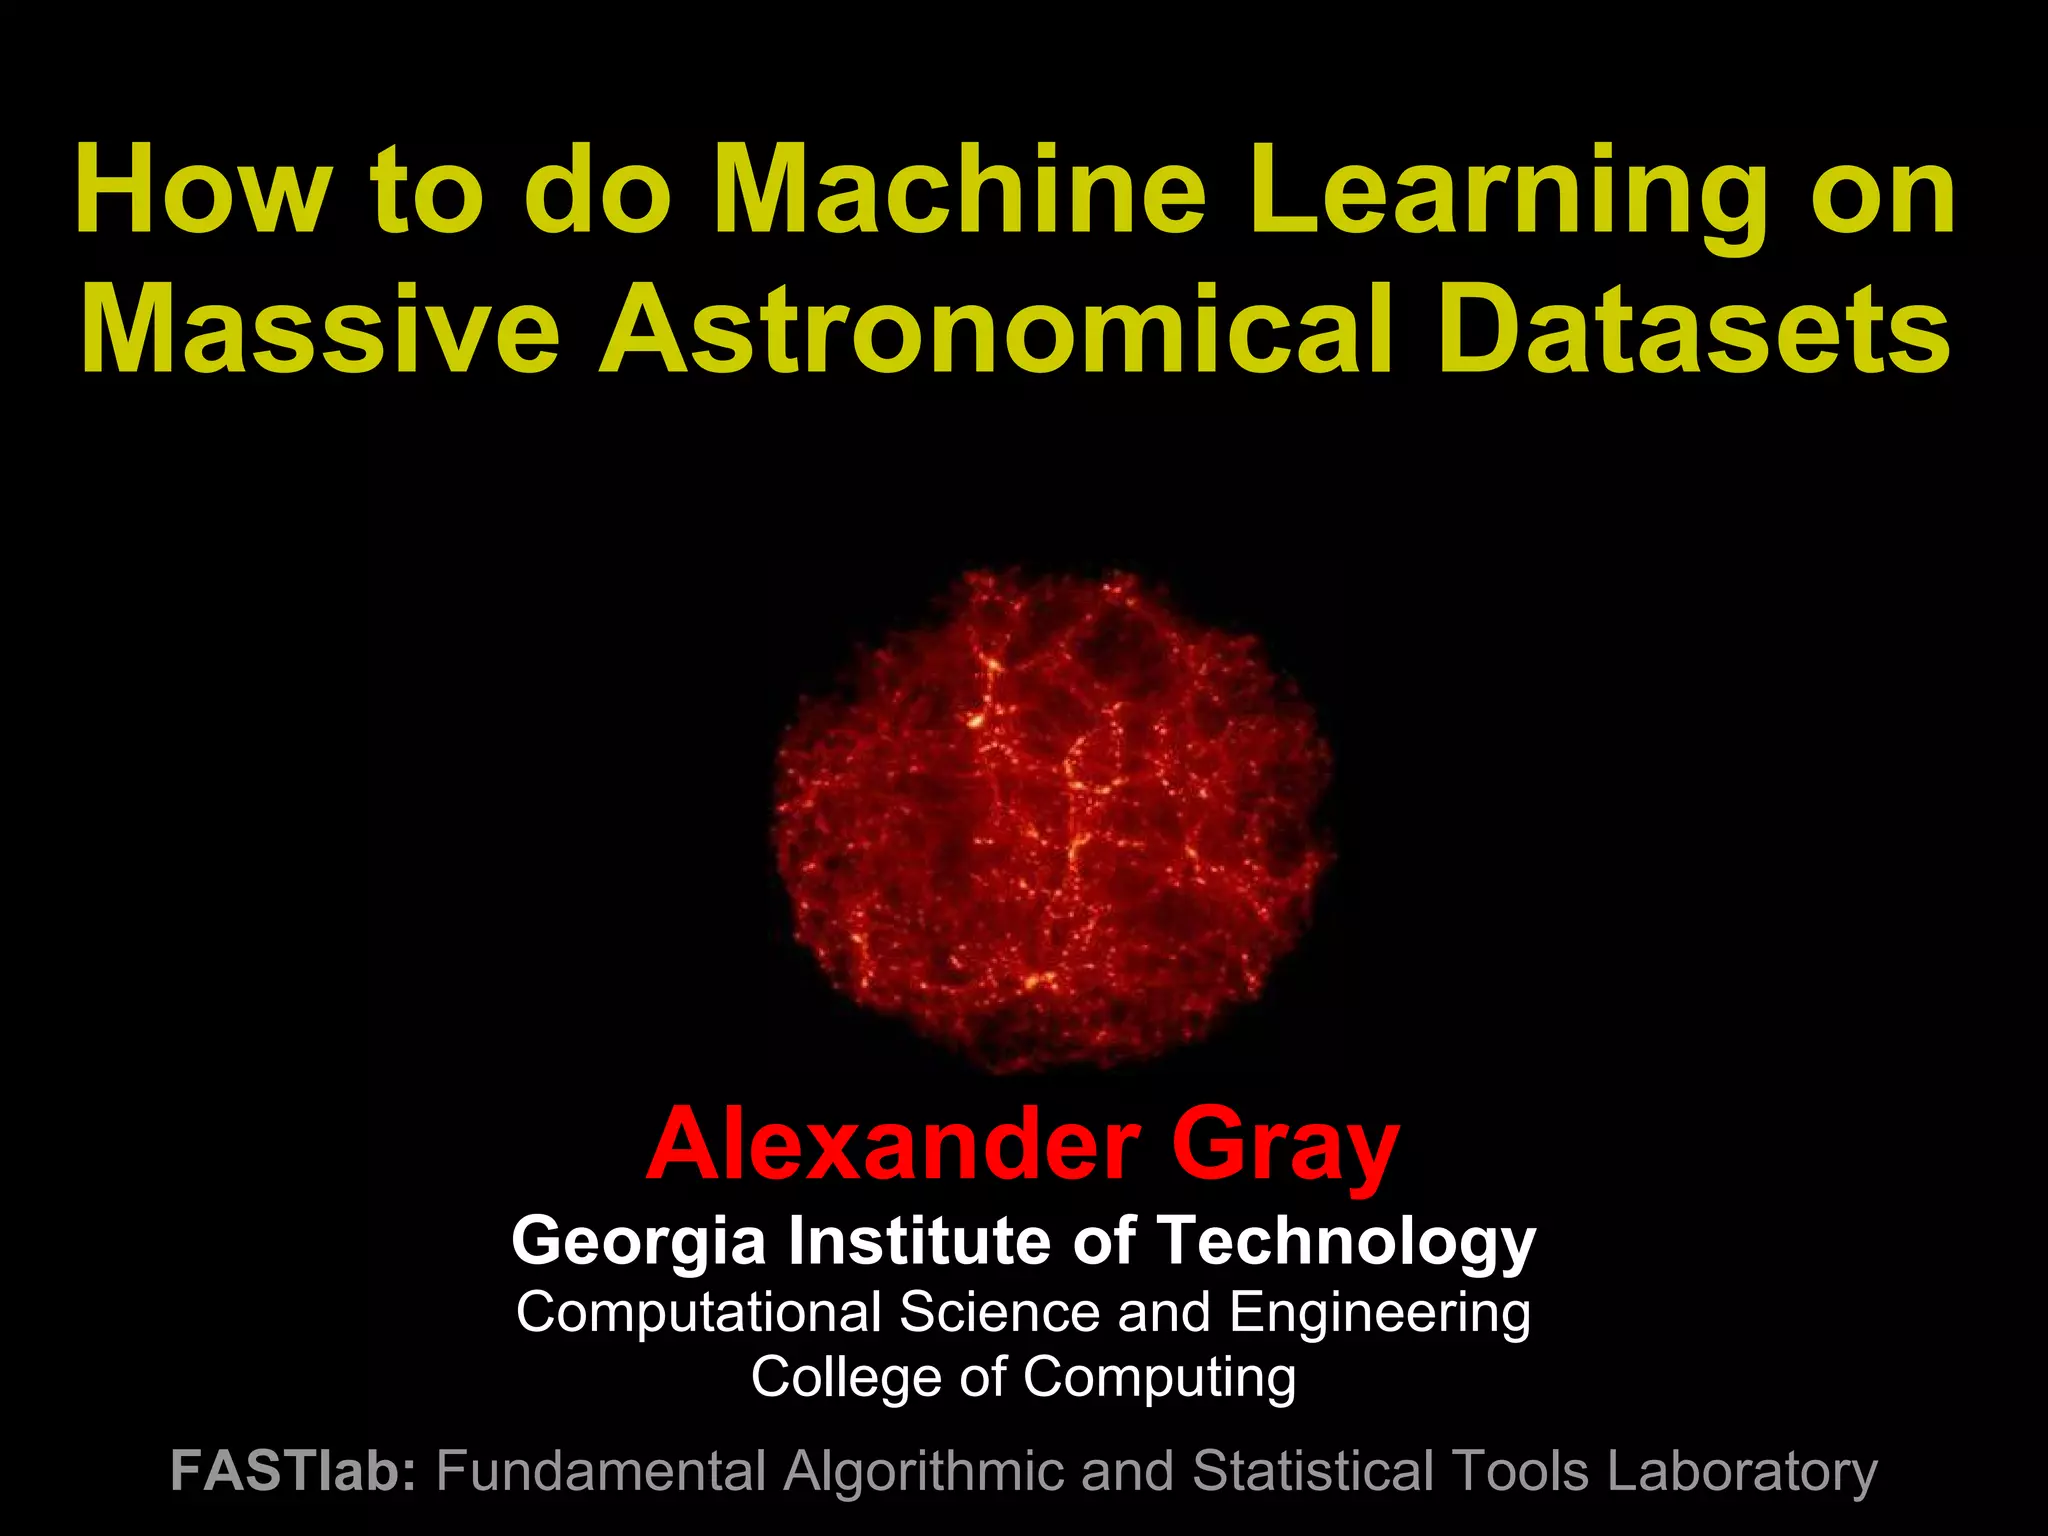
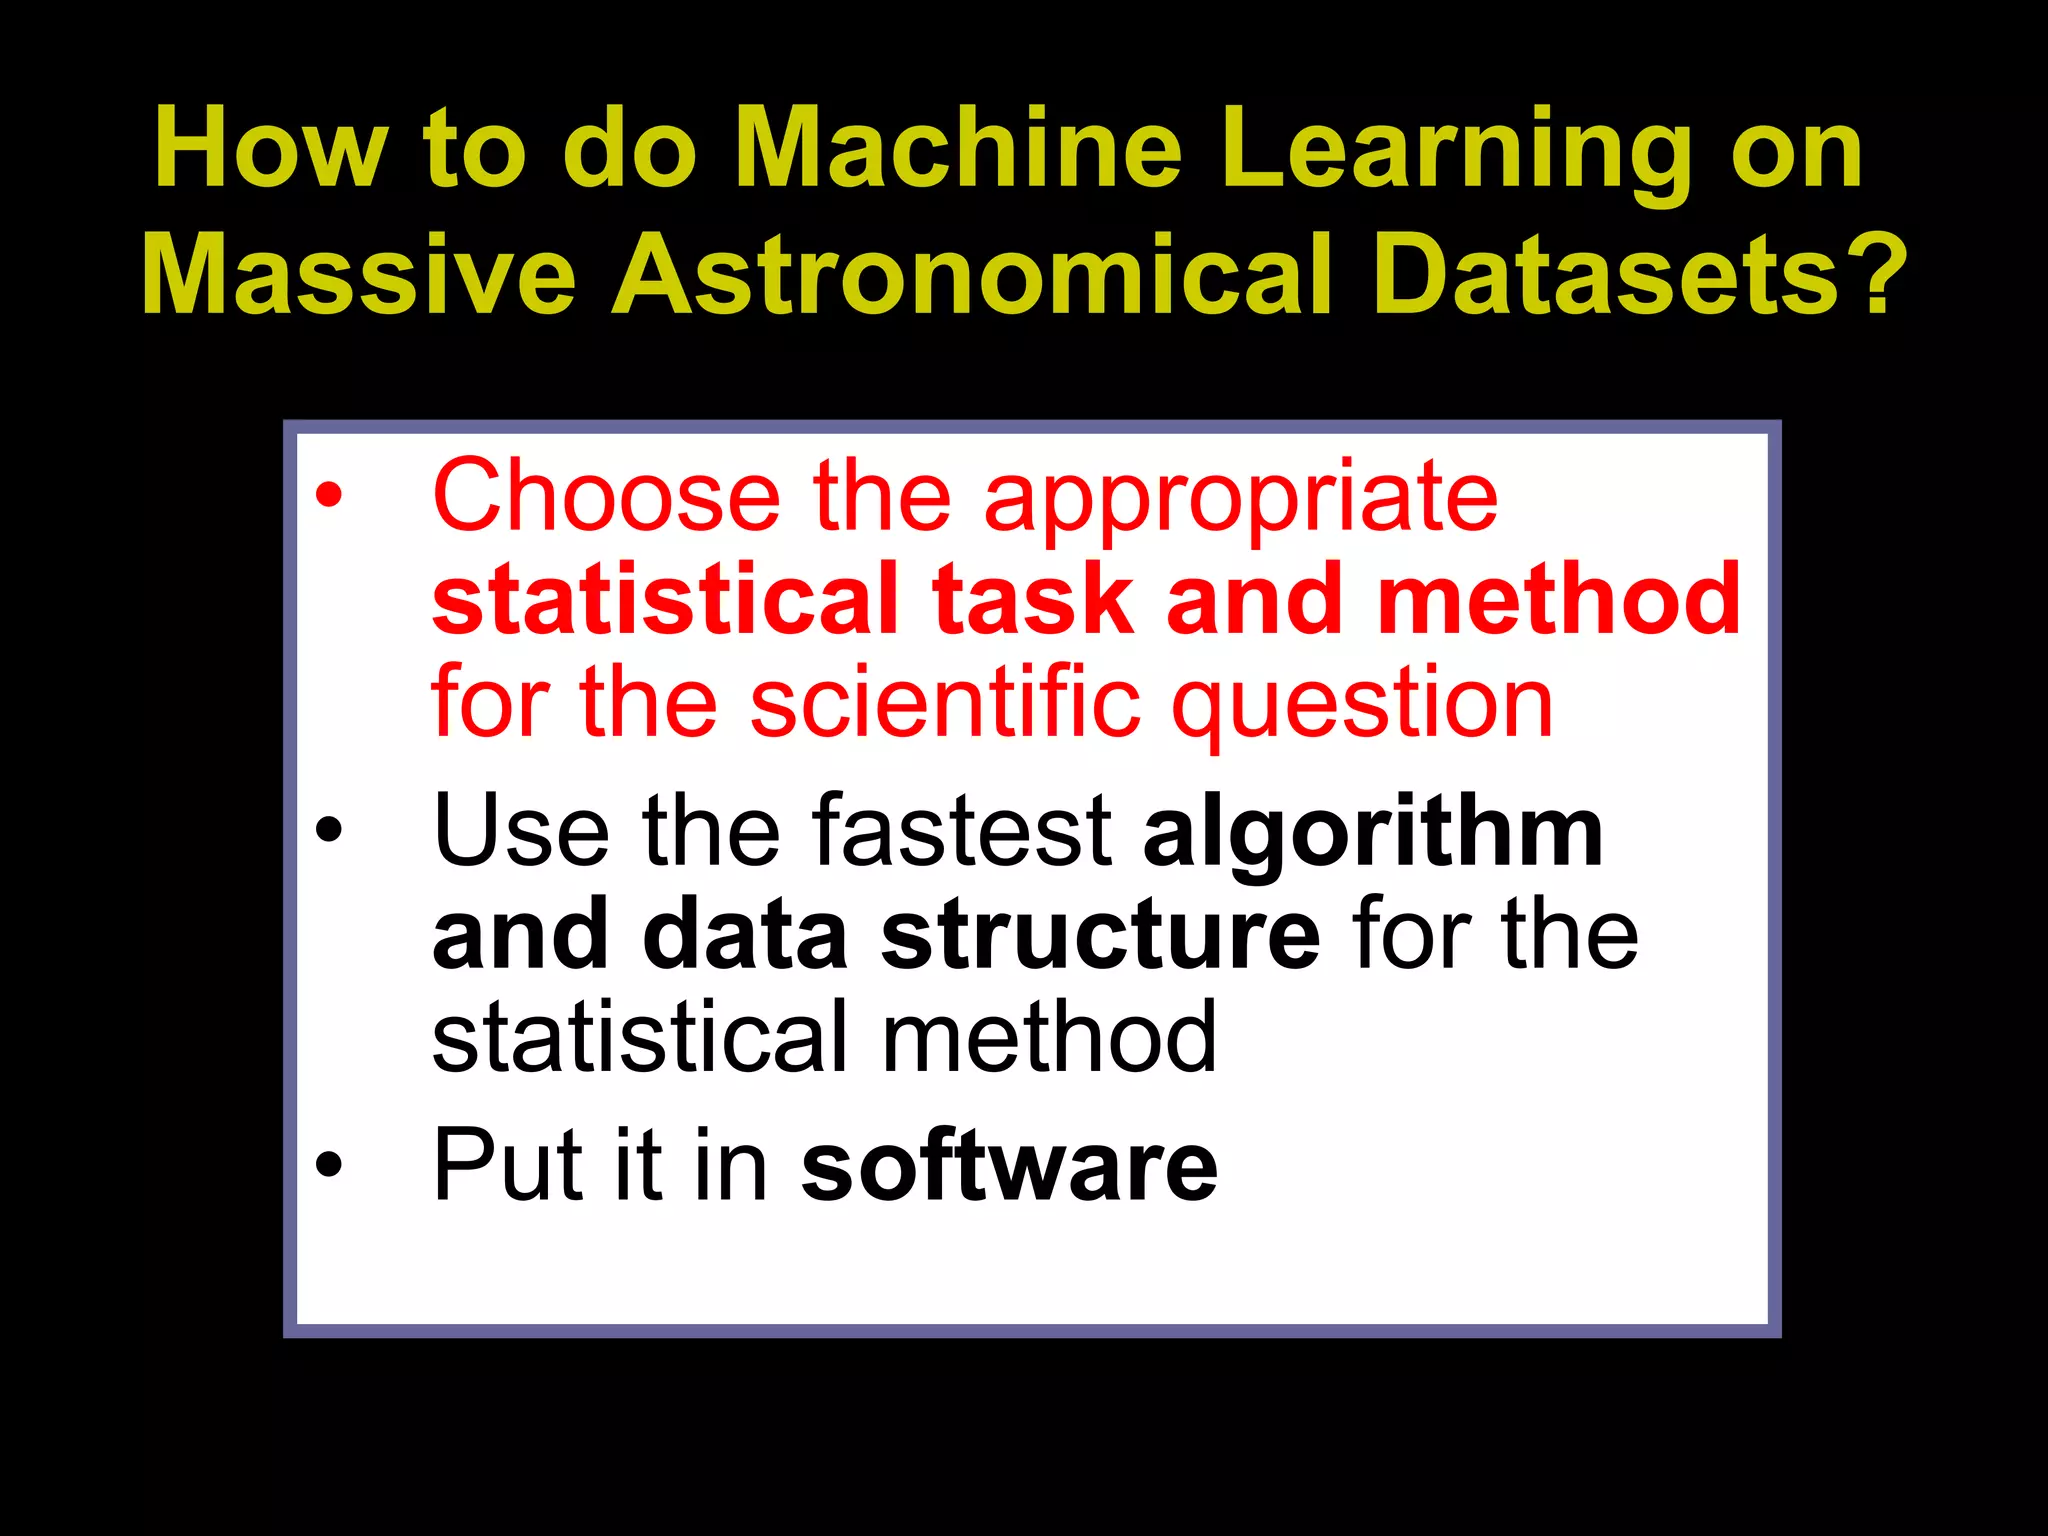
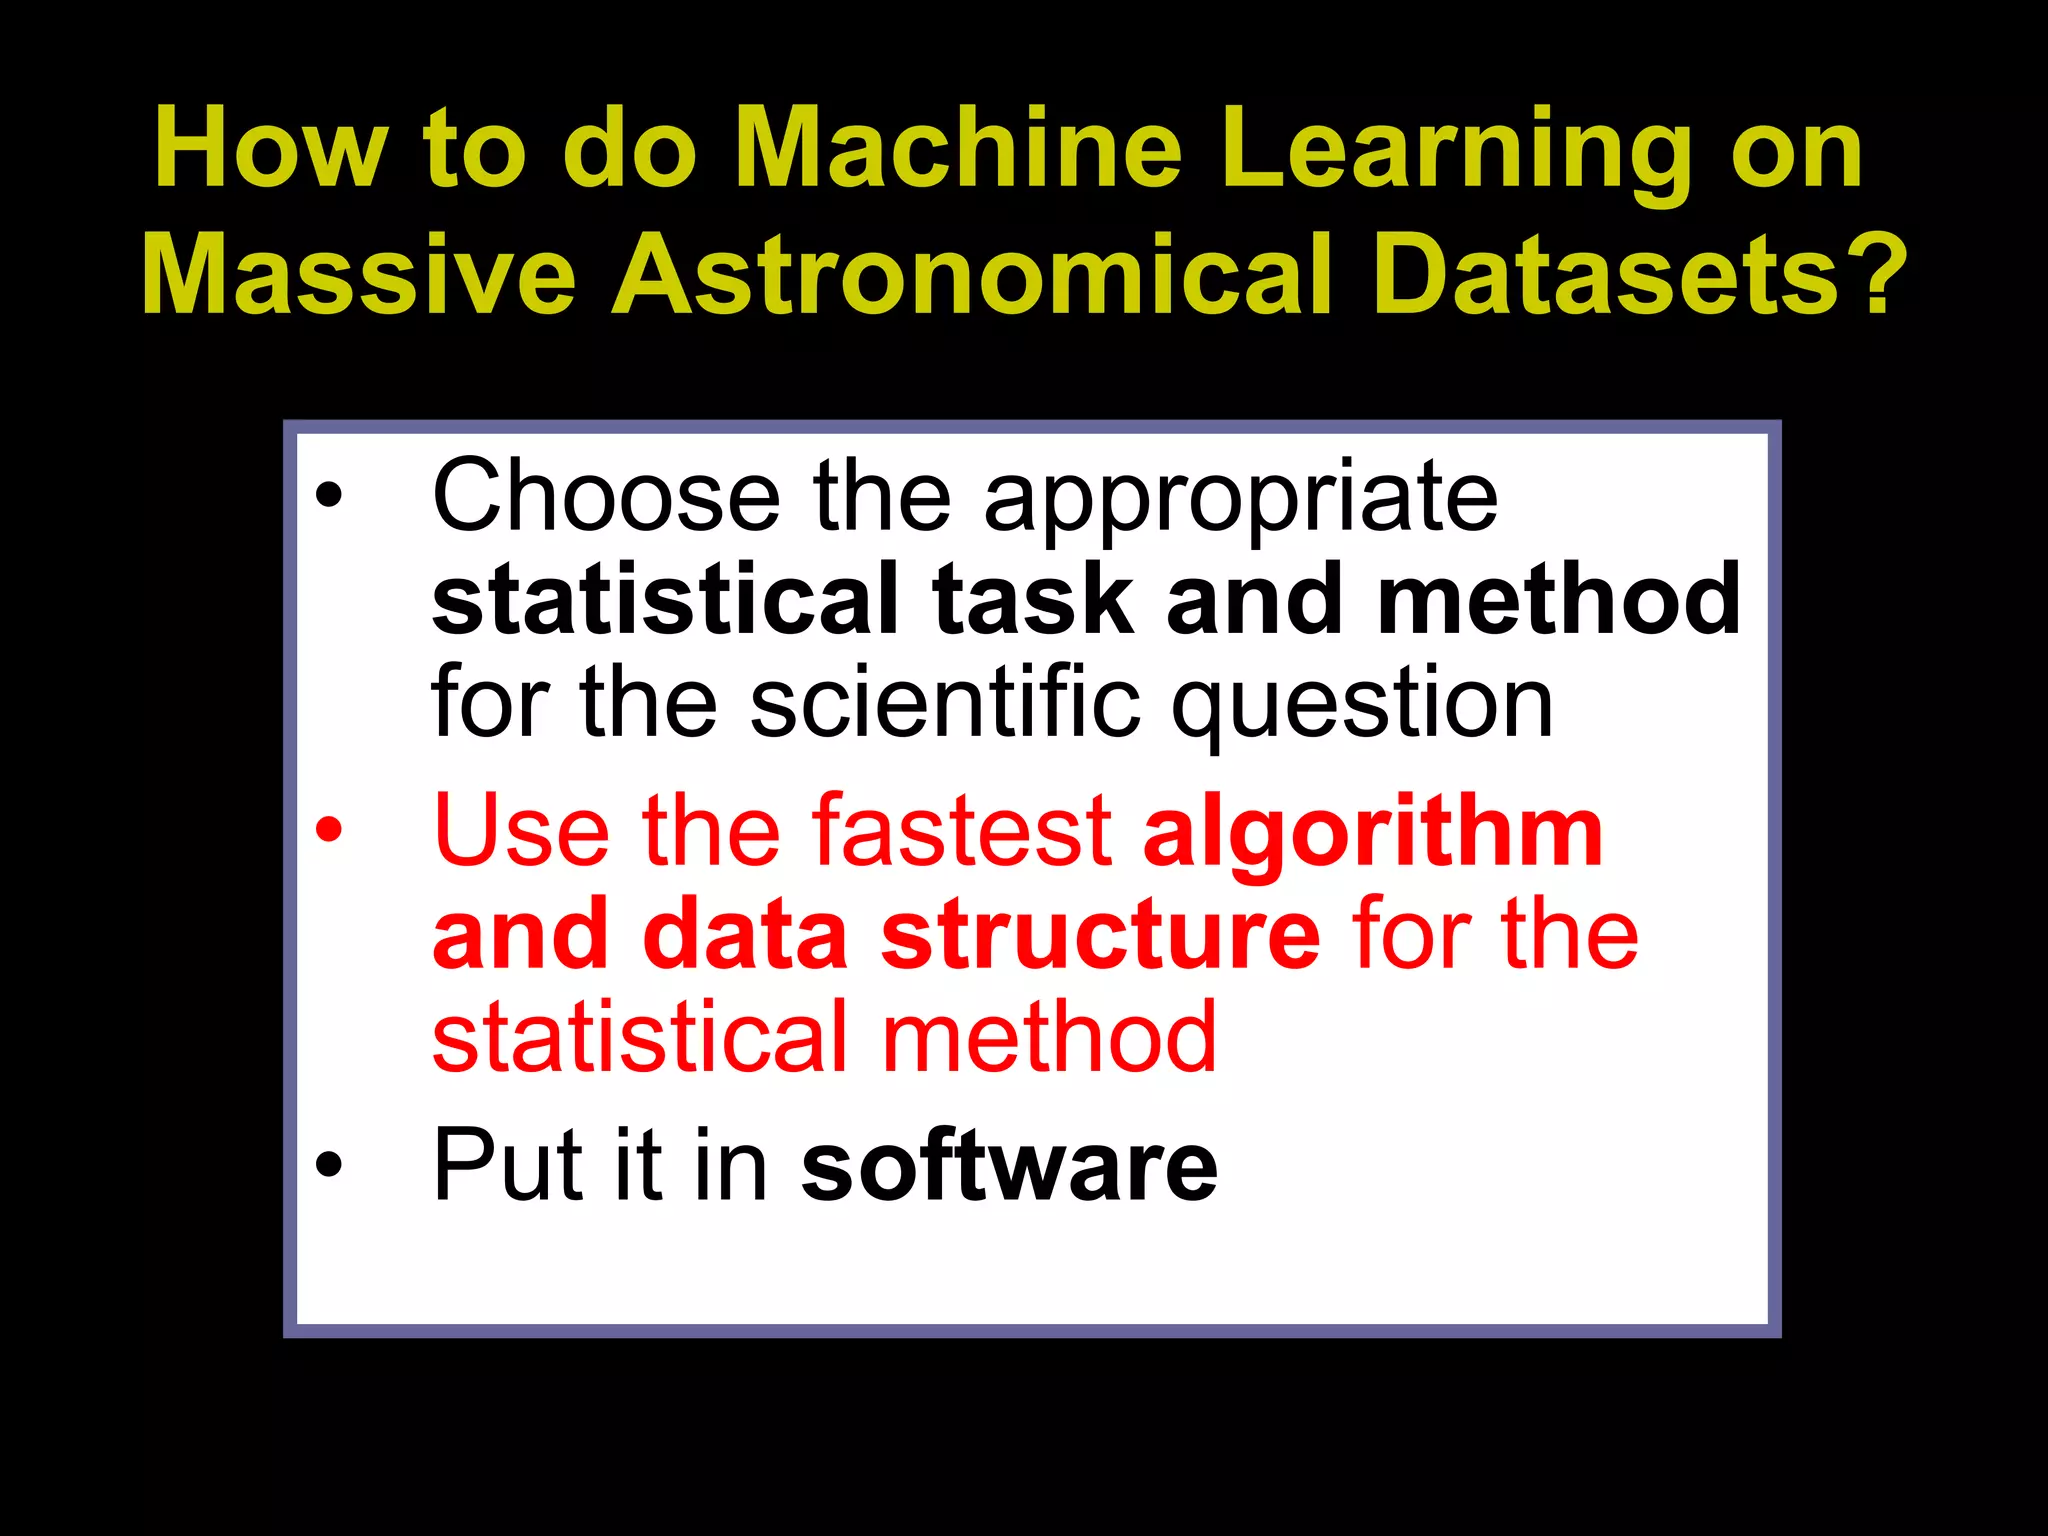
The document describes research on scalable machine learning algorithms for massive astronomical datasets. It discusses 10 common data analysis problems in astronomy like querying, density estimation, regression, classification, etc. For each problem, it lists relevant statistical methods and their computational costs. It emphasizes choosing the right method for the scientific question and developing fast algorithms for bottleneck operations like generalized N-body problems and graphical model inference to enable machine learning on datasets with billions of data points and features.

![Exponential growth in dataset sizes 1990 COBE 1,000 2000 Boomerang 10,000 2002 CBI 50,000 2003 WMAP 1 Million 2008 Planck 10 Million Data: CMB Maps Data: Local Redshift Surveys 1986 CfA 3,500 1996 LCRS 23,000 2003 2dF 250,000 2005 SDSS 800,000 Data: Angular Surveys 1970 Lick 1M 1990 APM 2M 2005 SDSS 200M 2010 LSST 2B Instruments [ Science , Szalay & J. Gray, 2001]](https://image.slidesharecdn.com/ppt288/75/ppt-3-2048.jpg)


![10 data analysis problems, and scalable tools we’d like for them Querying (e.g. characterizing a region of space) : spherical range-search O(N) orthogonal range-search O(N) k-nearest-neighbors O(N) all-k-nearest-neighbors O(N 2 ) Density estimation (e.g. comparing galaxy types) : mixture of Gaussians kernel density estimation O(N 2 ) L 2 density tree [Ram and Gray in prep] manifold kernel density estimation O(N 3 ) [Ozakin and Gray 2008, to be submitted] hyper-kernel density estimation O(N 4 ) [Sastry and Gray 2008, submitted]](https://image.slidesharecdn.com/ppt288/75/ppt-13-2048.jpg)
![10 data analysis problems, and scalable tools we’d like for them 3. Regression (e.g. photometric redshifts) : linear regression O(D 2 ) kernel regression O(N 2 ) Gaussian process regression/kriging O(N 3 ) 4. Classification (e.g. quasar detection, star-galaxy separation) : k-nearest-neighbor classifier O(N 2 ) nonparametric Bayes classifier O(N 2 ) support vector machine (SVM) O(N 3 ) non-negative SVM O(N 3 ) [Guan and Gray, in prep] false-positive-limiting SVM O(N 3 ) [Sastry and Gray, in prep] separation map O(N 3 ) [Vasiloglou, Gray, and Anderson 2008, submitted]](https://image.slidesharecdn.com/ppt288/75/ppt-14-2048.jpg)
![10 data analysis problems, and scalable tools we’d like for them Dimension reduction (e.g. galaxy or spectra characterization) : principal component analysis O(D 2 ) non-negative matrix factorization kernel PCA O(N 3 ) maximum variance unfolding O(N 3 ) co-occurrence embedding O(N 3 ) [Ozakin and Gray, in prep] rank-based manifolds O(N 3 ) [Ouyang and Gray 2008, ICML] isometric non-negative matrix factorization O(N 3 ) [Vasiloglou, Gray, and Anderson 2008, submitted] Outlier detection (e.g. new object types, data cleaning) : by density estimation, by dimension reduction by robust L p estimation [Ram, Riegel and Gray, in prep]](https://image.slidesharecdn.com/ppt288/75/ppt-15-2048.jpg)
![10 data analysis problems, and scalable tools we’d like for them 7. Clustering (e.g. automatic Hubble sequence) by dimension reduction, by density estimation k-means mean-shift segmentation O(N 2 ) hierarchical clustering (“friends-of-friends”) O(N 3 ) 8. Time series analysis (e.g. asteroid tracking, variable objects) : Kalman filter O(D 2 ) hidden Markov model O(D 2 ) trajectory tracking O(N n ) Markov matrix factorization [Tran, Wong, and Gray 2008, submitted] functional independent component analysis [Mehta and Gray 2008, submitted]](https://image.slidesharecdn.com/ppt288/75/ppt-16-2048.jpg)
![10 data analysis problems, and scalable tools we’d like for them 9. Feature selection and causality (e.g. which features predict star/galaxy) LASSO regression L 1 SVM Gaussian graphical model inference and structure search discrete graphical model inference and structure search 0-1 feature-selecting SVM [Guan and Gray, in prep] L 1 Gaussian graphical model inference and structure search [Tran, Lee, Holmes, and Gray, in prep] 10. 2-sample testing and matching (e.g. cosmological validation, multiple surveys) : minimum spanning tree O(N 3 ) n-point correlation O(N n ) bipartite matching/Gaussian graphical model inference O(N 3 ) [Waters and Gray, in prep]](https://image.slidesharecdn.com/ppt288/75/ppt-17-2048.jpg)


![kd -trees: most widely-used space-partitioning tree [Bentley 1975], [Friedman, Bentley & Finkel 1977],[Moore & Lee 1995] How can we compute this efficiently?](https://image.slidesharecdn.com/ppt288/75/ppt-23-2048.jpg)


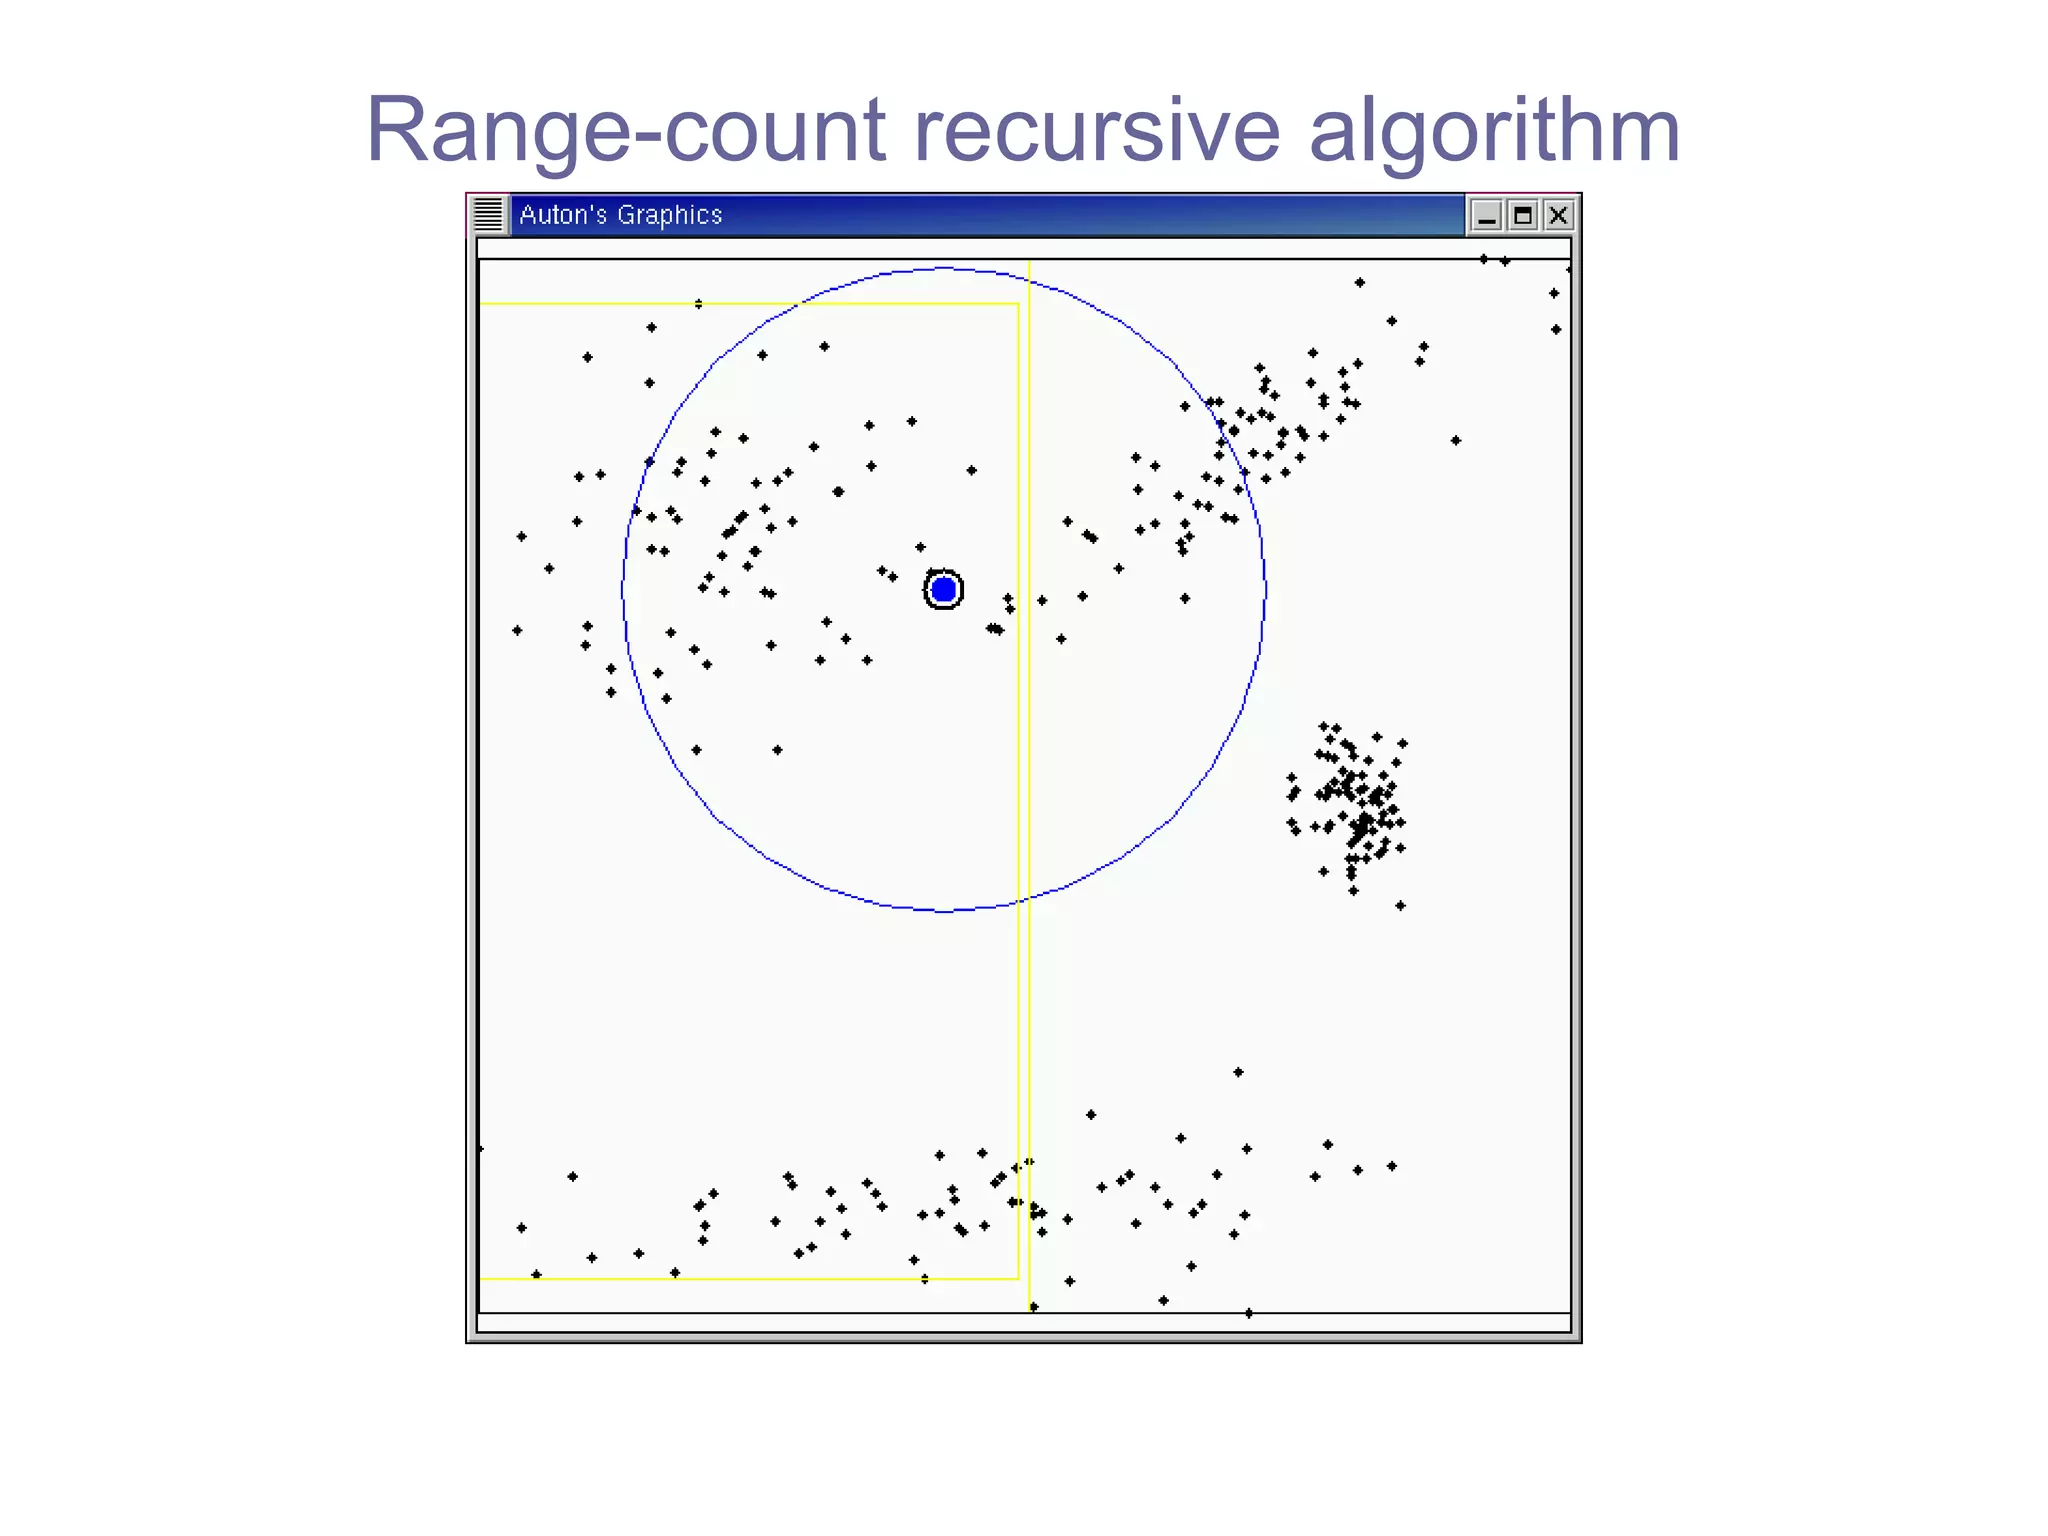


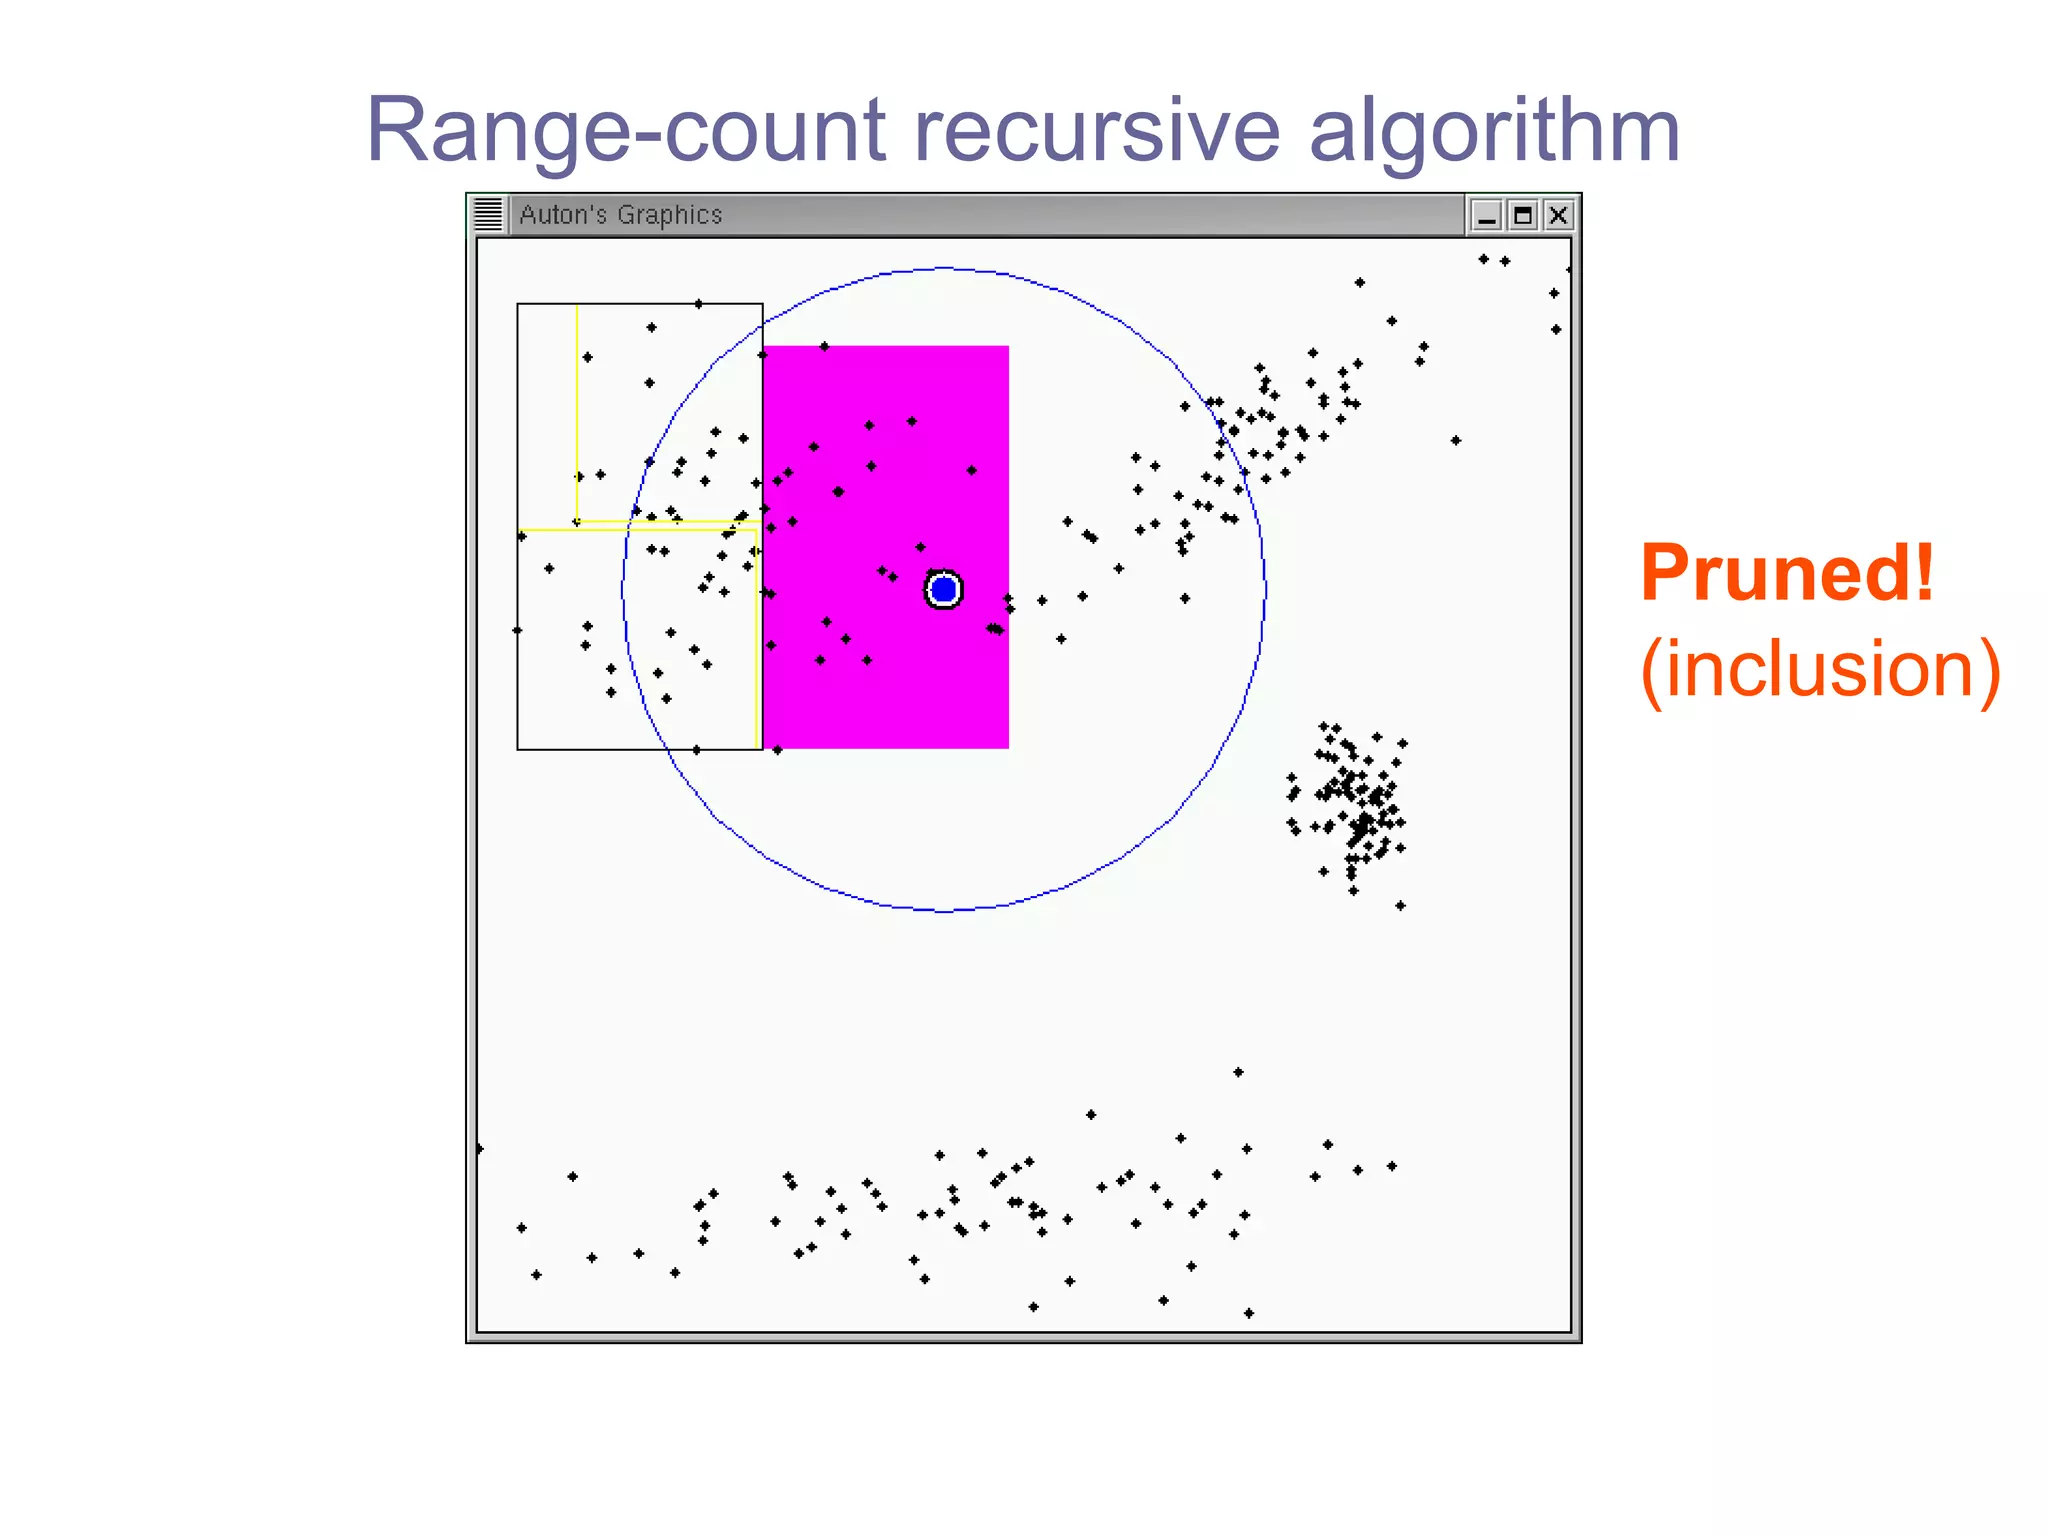


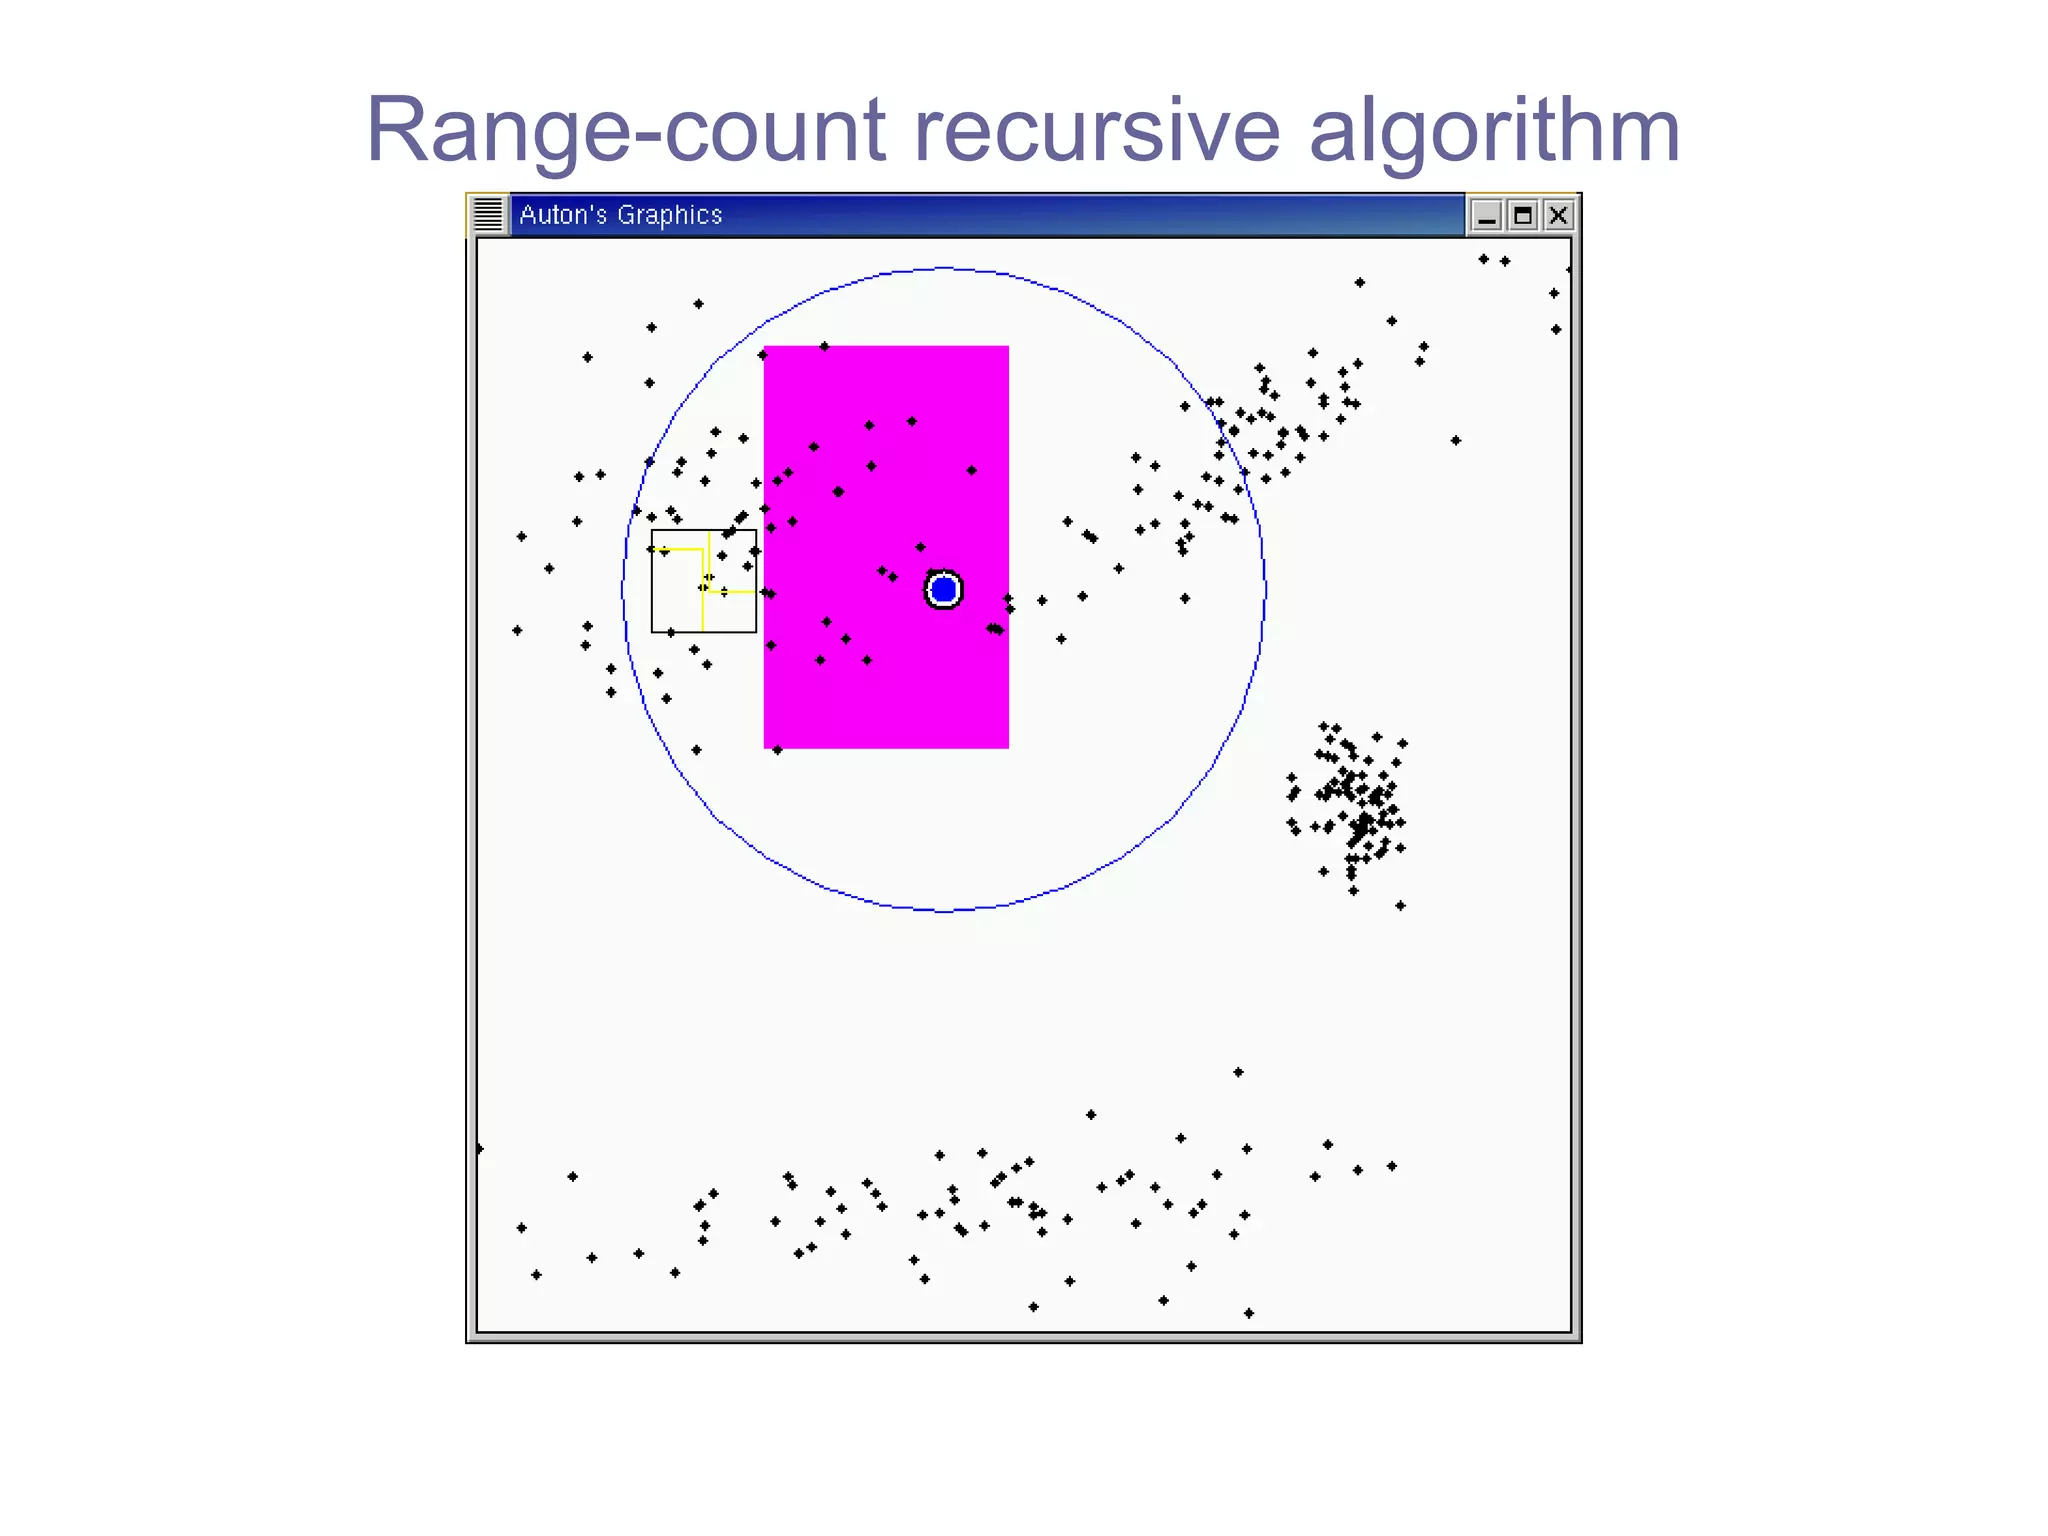


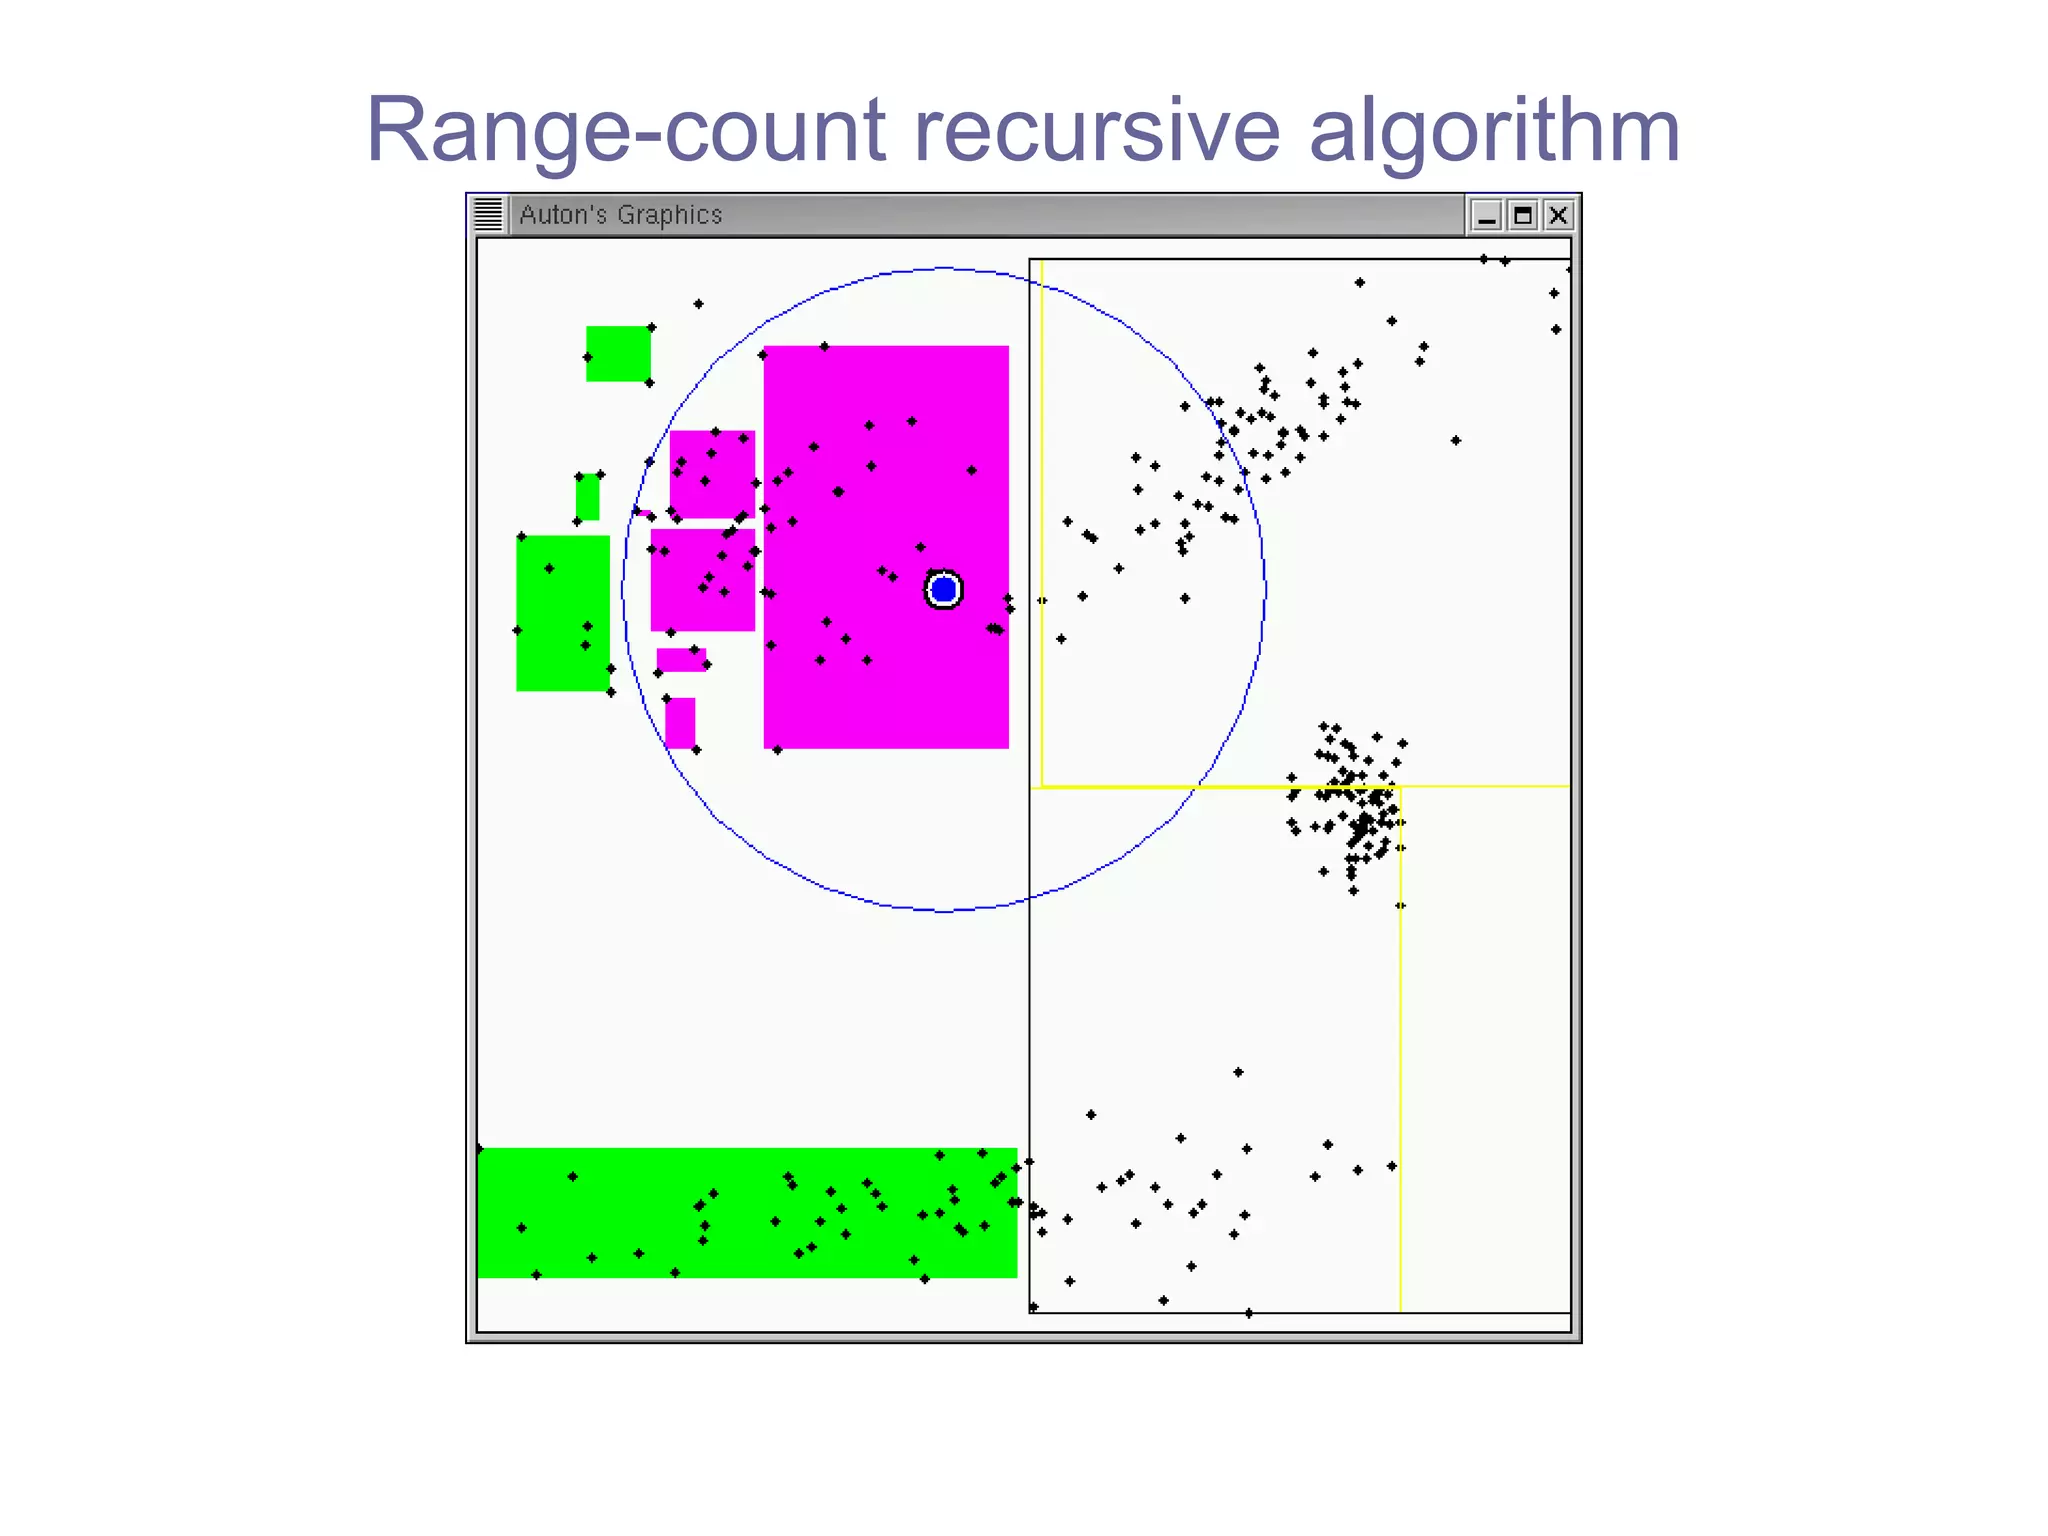
![Range-count recursive algorithm fastest practical algorithm [Bentley 1975] our algorithms can use any tree](https://image.slidesharecdn.com/ppt288/75/ppt-45-2048.jpg)
![Aggregations Interesting approach: Cover-trees [Beygelzimer et al 2004] Provable runtime Consistently good performance, even in higher dimensions Interesting approach: Learning trees [Cayton et al 2007] Learning data-optimal data structures Improves performance over kd-trees Interesting approach: MapReduce [Dean and Ghemawat 2004] Brute-force But makes HPC automatic for a certain problem form Interesting approach: approximation in rank [Ram, Ouyang and Gray] Approximate NN in terms of distance conflicts with known theoretical results Is approximation in rank feasible?](https://image.slidesharecdn.com/ppt288/75/ppt-46-2048.jpg)

![Generalized N-body Problems Interesting approach: Generalized Fast Multipole Method, aka multi-tree methods [Gray and Moore 2001, NIPS; Riegel, Boyer and Gray] Fastest practical algorithms for the problems to which it has been applied Hard query-dependent relative error bounds Automatic parallelization ( THOR: Tree-based Higher-Order Reduce ) [Boyer, Riegel and Gray to be submitted]](https://image.slidesharecdn.com/ppt288/75/ppt-48-2048.jpg)
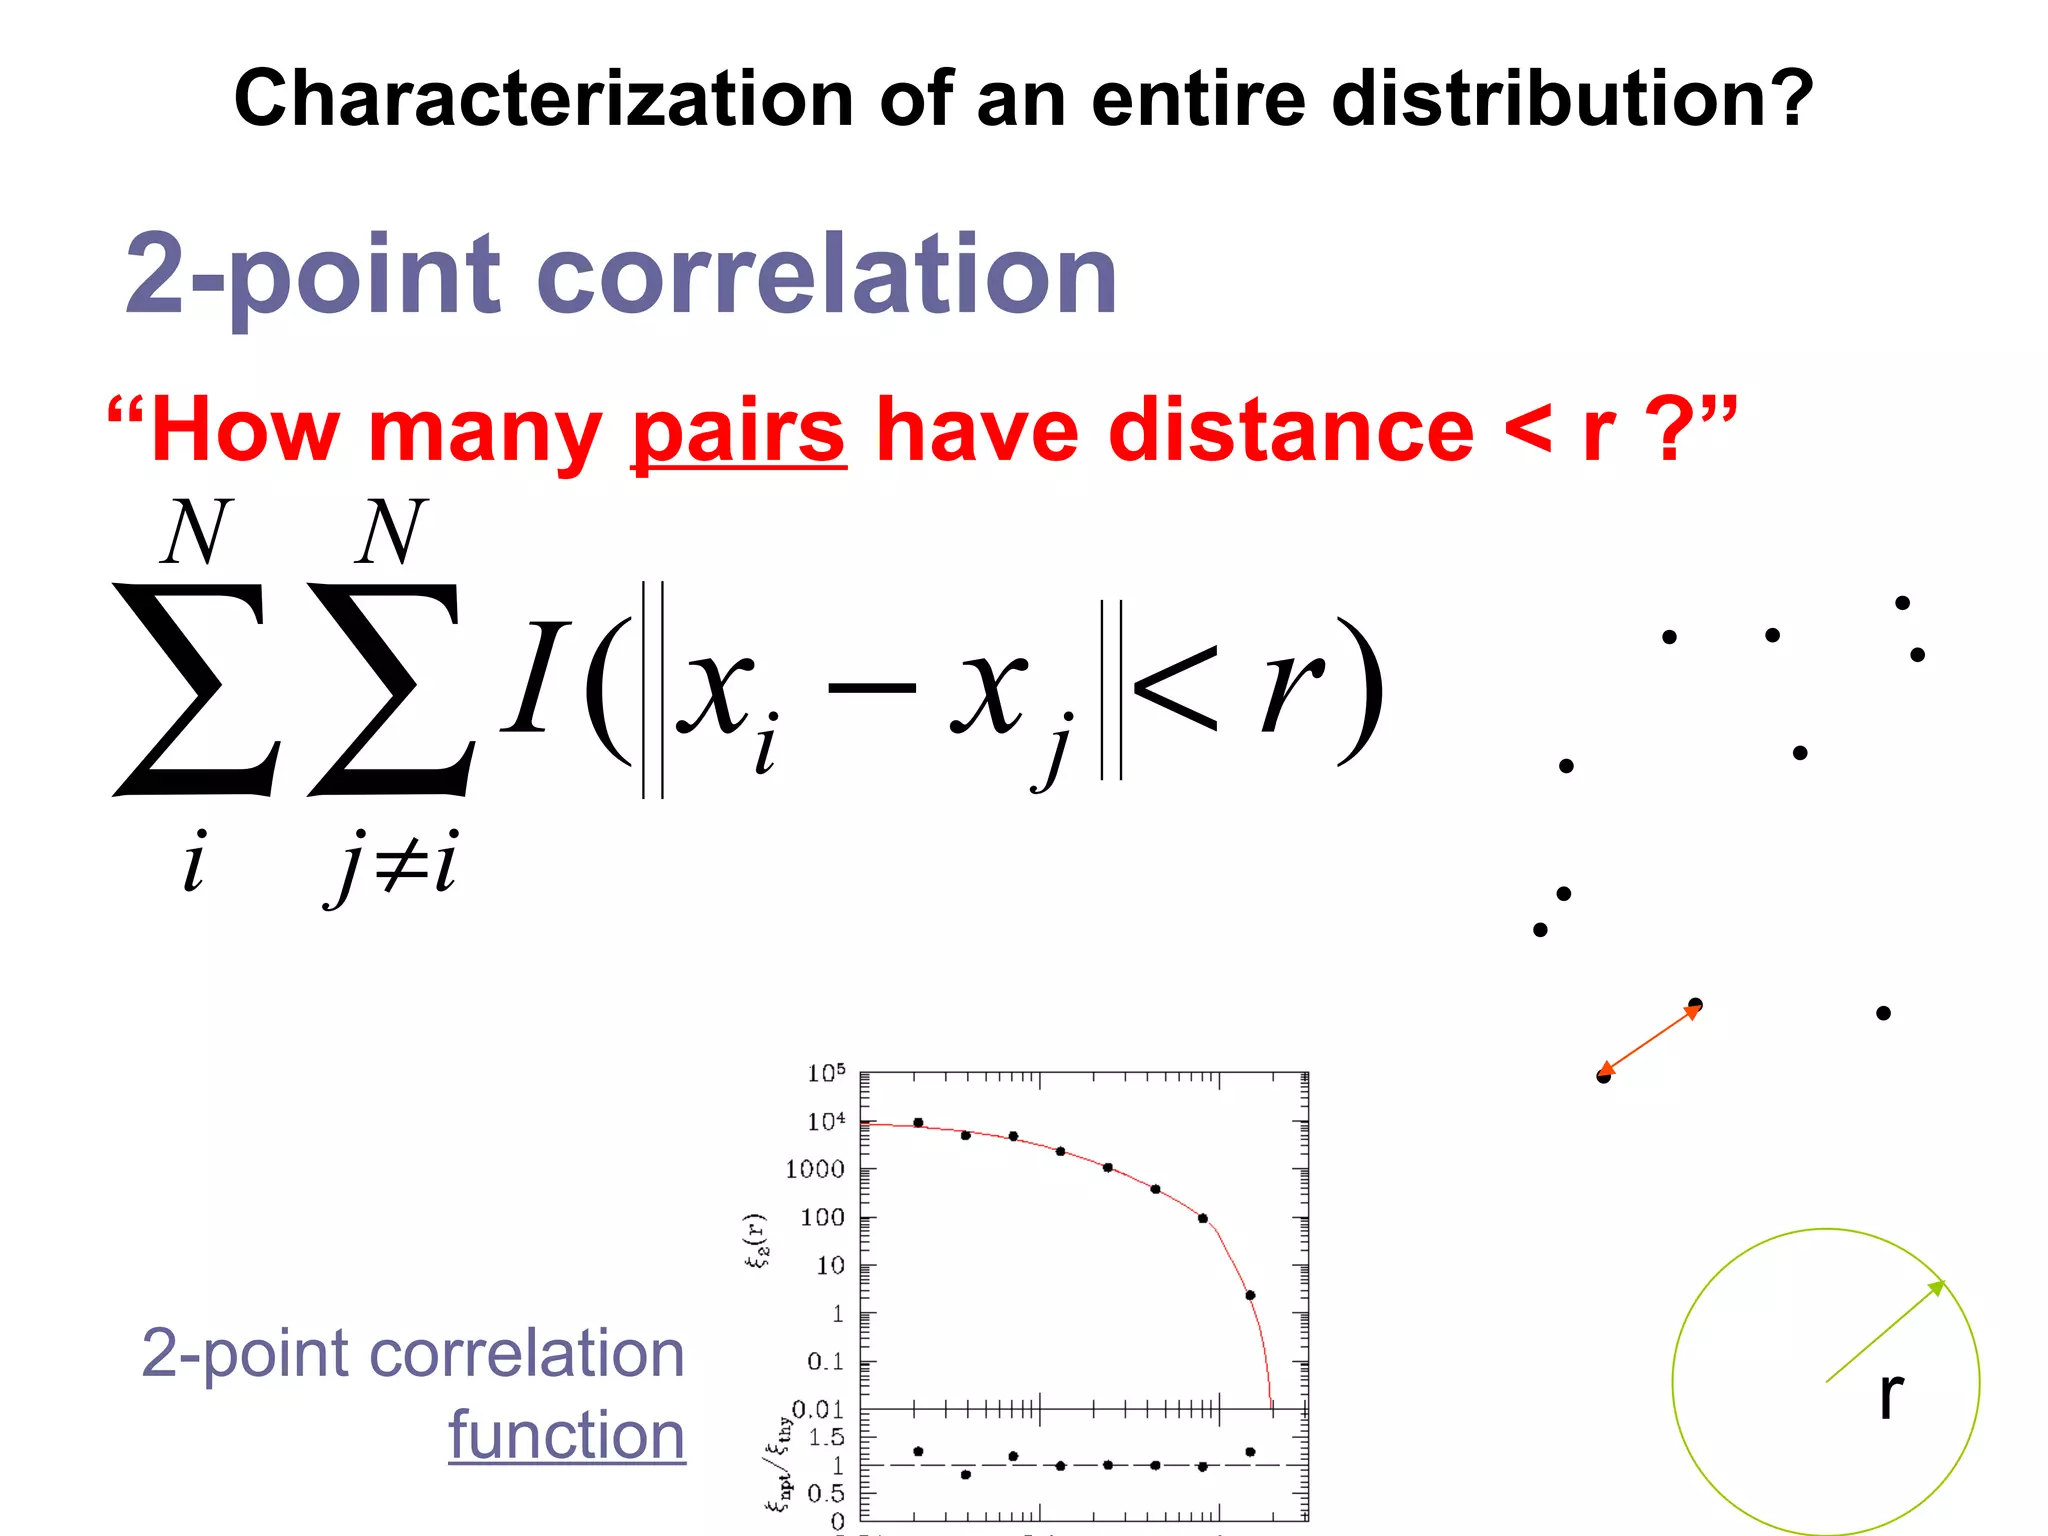
![The n -point correlation functions Spatial inferences: filaments, clusters, voids, homogeneity, isotropy, 2-sample testing, … Foundation for theory of point processes [Daley,Vere-Jones 1972], unifies spatial statistics [Ripley 1976] Used heavily in biostatistics, cosmology, particle physics, statistical physics 2pcf definition: 3pcf definition:](https://image.slidesharecdn.com/ppt288/75/ppt-50-2048.jpg)

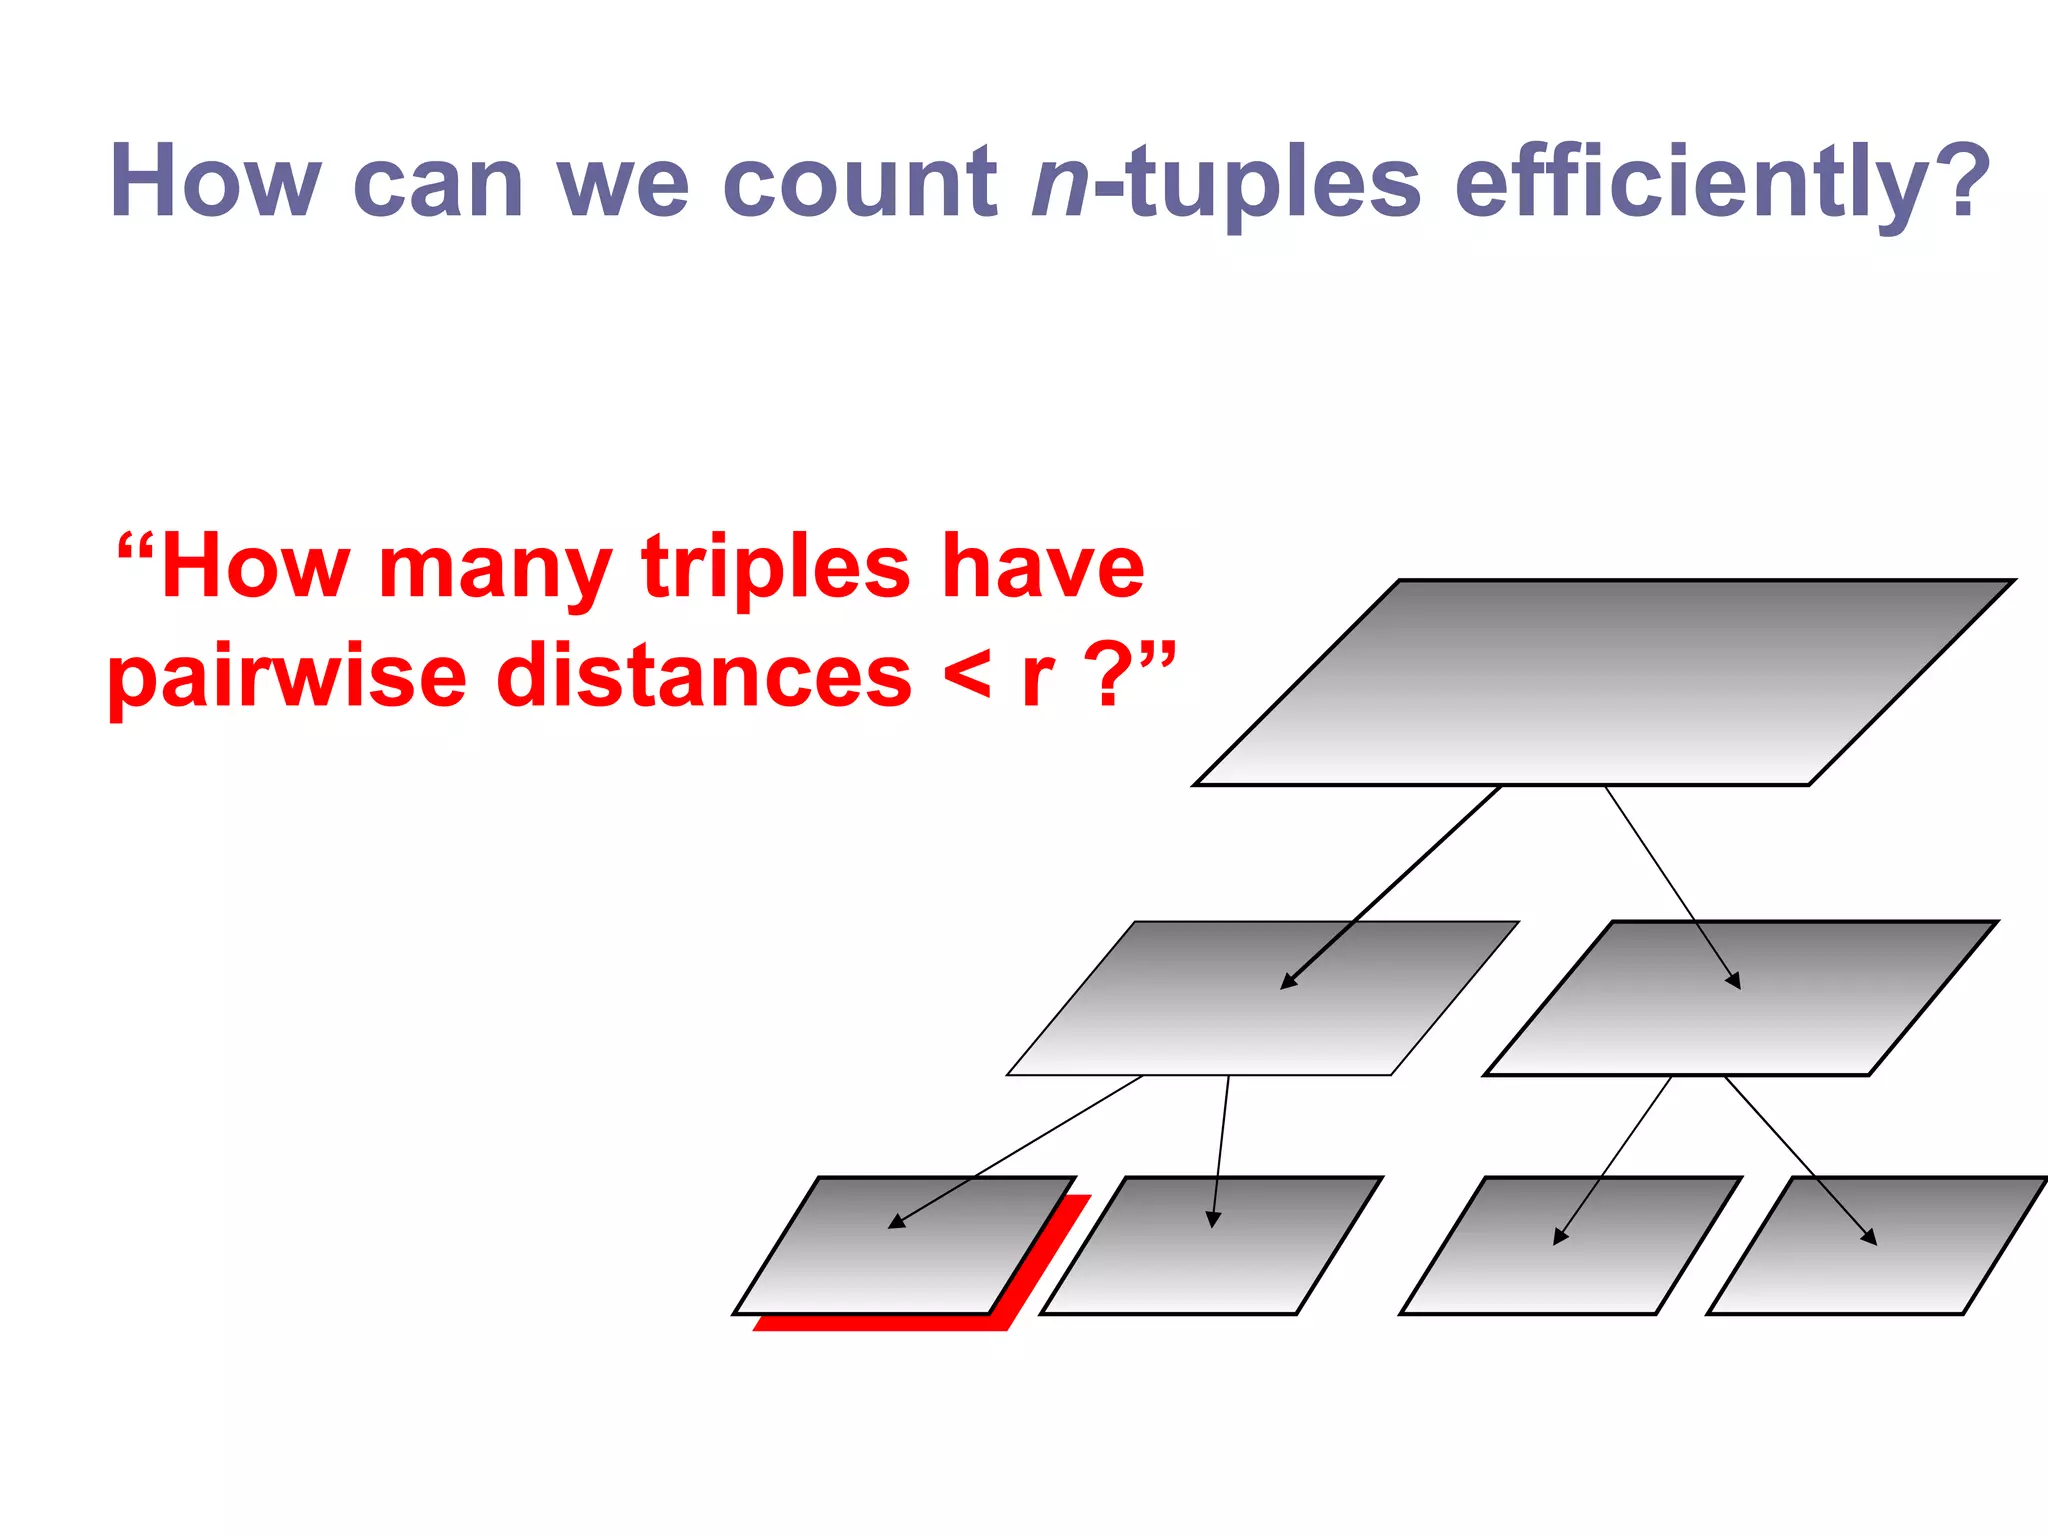
![Use n trees! [Gray & Moore, NIPS 2000]](https://image.slidesharecdn.com/ppt288/75/ppt-53-2048.jpg)


![Generalized N-body Problems Interesting approach (for n-point): n-tree algorithms [Gray and Moore 2001, NIPS; Moore et al. 2001, Mining the Sky] First efficient exact algorithm for n-point correlations Interesting approach (for n-point): Monte Carlo n-tree [Waters, Riegel and Gray] Orders of magnitude faster](https://image.slidesharecdn.com/ppt288/75/ppt-62-2048.jpg)
![Generalized N-body Problems Interesting approach (for EMST): dual-tree Boruvka algorithm [March and Gray] Note this is a cubic problem Interesting approach (N-body decision problems): dual-tree bounding with hybrid tree expansion [Liu, Moore, and Gray 2004; Gray and Riegel 2004, CompStat; Riegel and Gray 2007, SDM] An exact classification algorithm](https://image.slidesharecdn.com/ppt288/75/ppt-63-2048.jpg)
![Generalized N-body Problems Interesting approach (Gaussian kernel): dual-tree with multipole/Hermite expansions [Lee, Gray and Moore 2005, NIPS; Lee and Gray 2006, UAI] Ultra-accurate fast kernel summations Interesting approach (arbitrary kernel): automatic derivation of hierarchical series expansions [Lee and Gray] For large class of kernel functions](https://image.slidesharecdn.com/ppt288/75/ppt-64-2048.jpg)
![Generalized N-body Problems Interesting approach (summative forms): multi-scale Monte Carlo [Holmes, Gray, Isbell 2006 NIPS; Holmes, Gray, Isbell 2007, UAI] Very fast bandwidth learning Interesting approach (summative forms): Monte Carlo multipole methods [Lee and Gray 2008, NIPS] Uses SVD tree](https://image.slidesharecdn.com/ppt288/75/ppt-65-2048.jpg)
![Generalized N-body Problems Interesting approach (for multi-body potentials in physics): higher-order multipole methods [Lee, Waters, Ozakin, and Gray, et al.] First fast algorithm for higher-order potentials Interesting approach (for quantum-level simulation): 4-body treatment of Hartree-Fock [March and Gray, et al.]](https://image.slidesharecdn.com/ppt288/75/ppt-66-2048.jpg)

![Graphical model inference Interesting method (for discrete models): Survey propagation [Mezard et al 2002] Good results for combinatorial optimization Based on statistical physics ideas Interesting method (for discrete models): Expectation propagation [Minka 2001] Variational method based on moment-matching idea Interesting method (for Gaussian models): L p structure search, solve linear system for inference [Tran, Lee, Holmes, and Gray]](https://image.slidesharecdn.com/ppt288/75/ppt-68-2048.jpg)

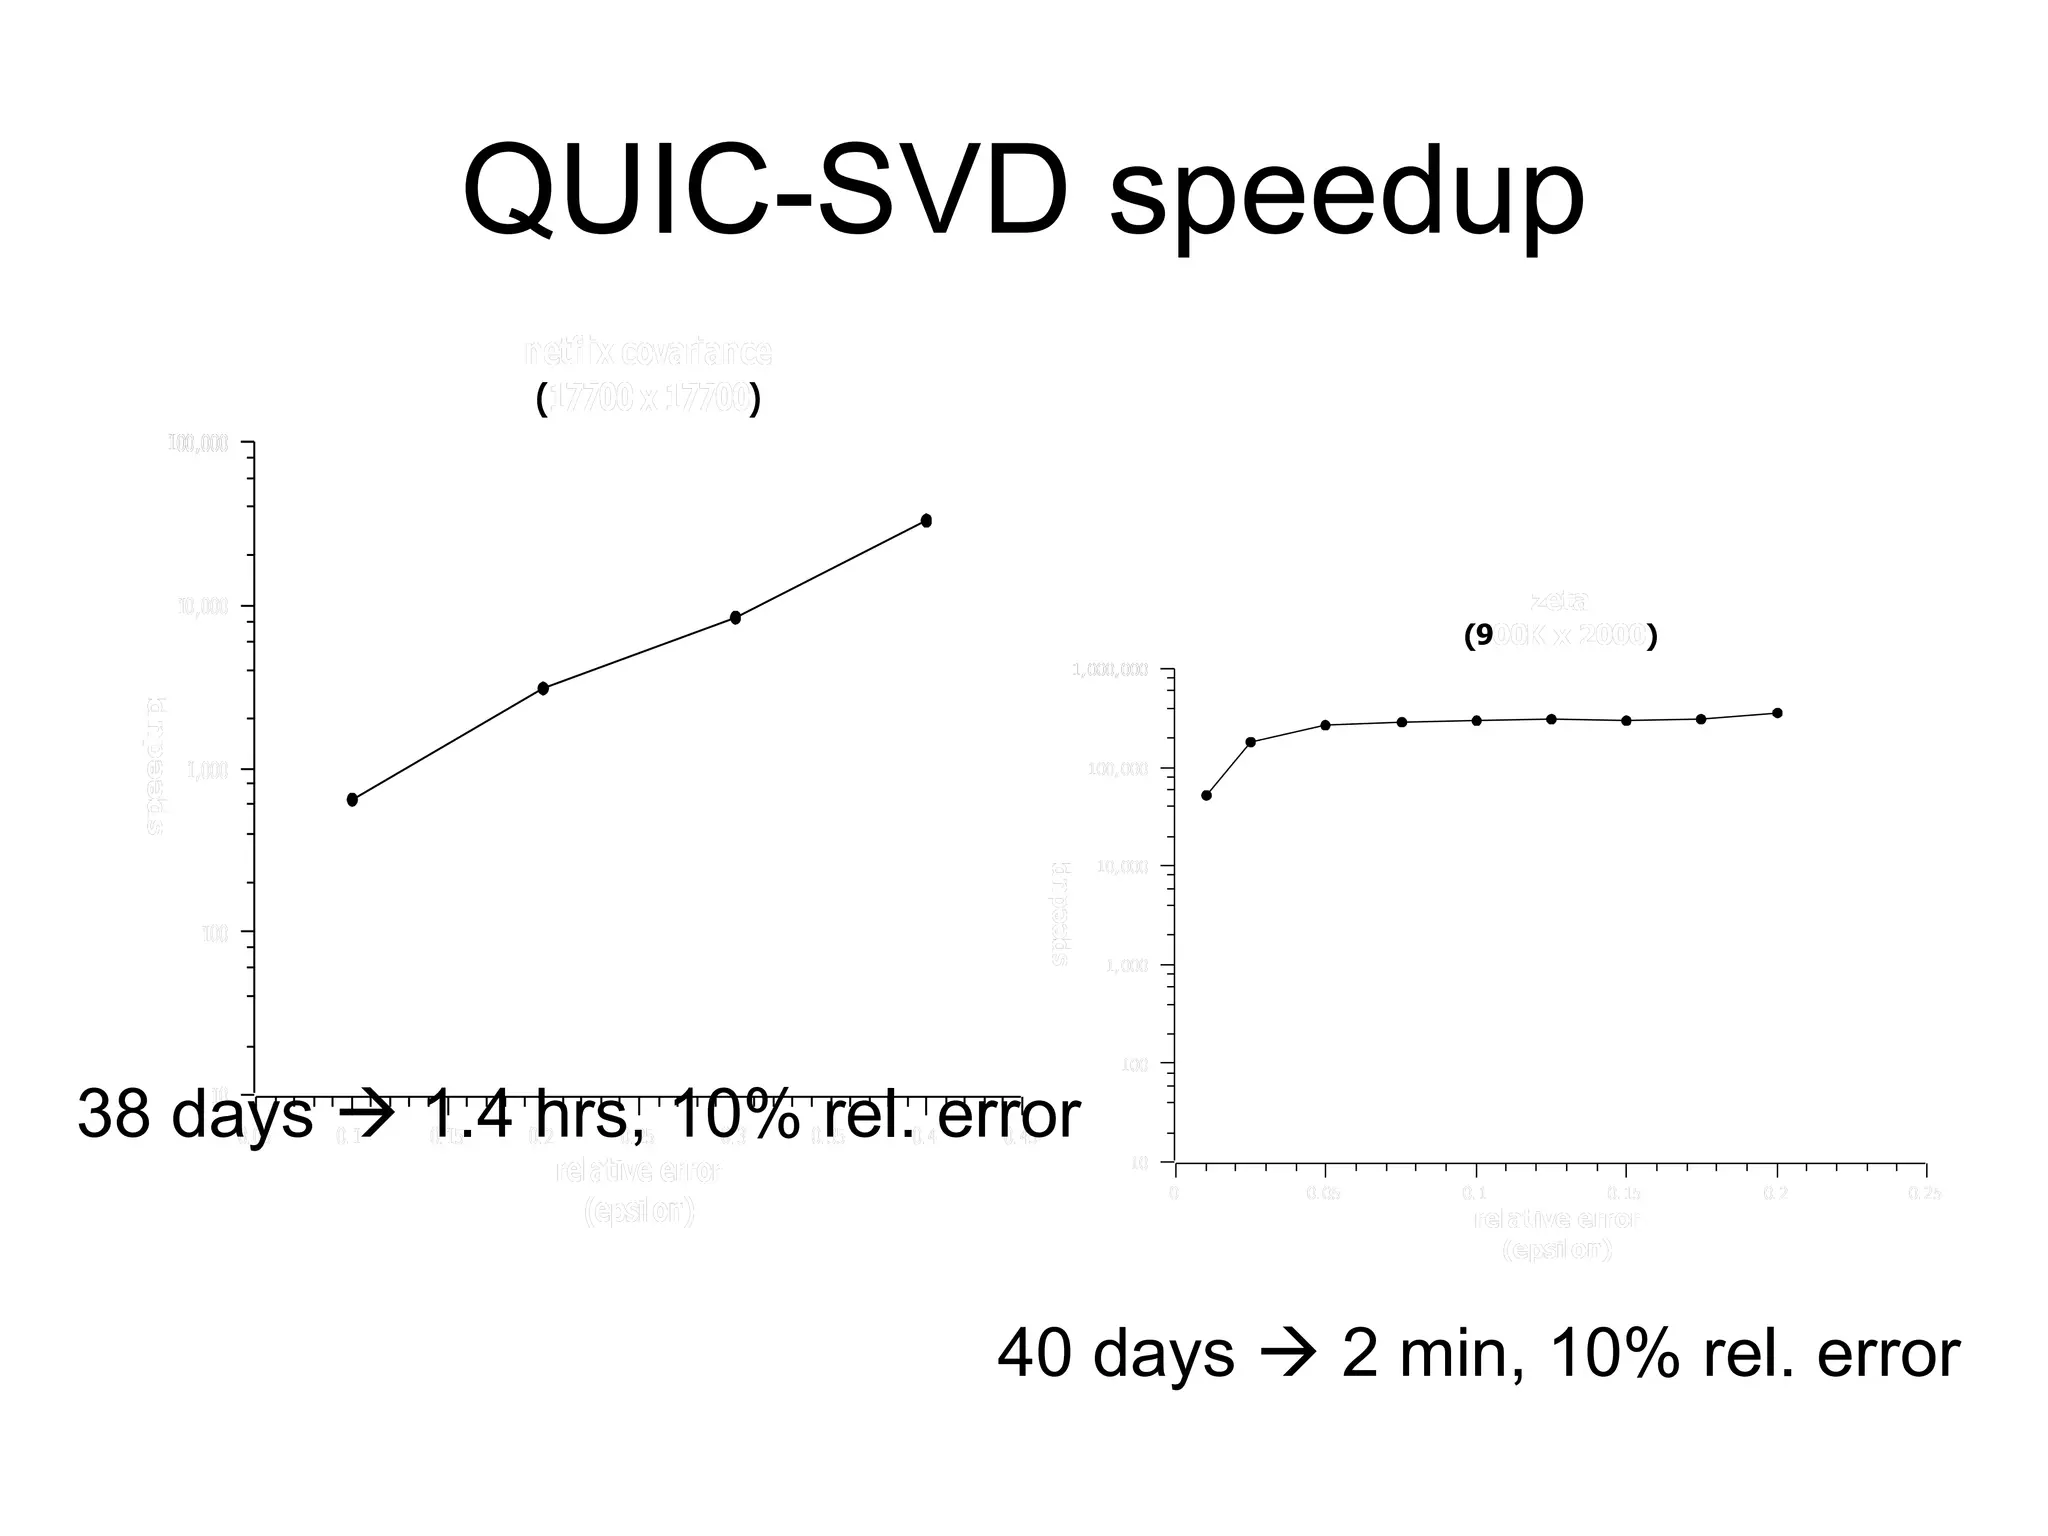
![Linear algebra Interesting method (for probably-approximate k-rank SVD): Monte Carlo k-rank SVD [Frieze, Drineas, et al. 1998-2008] Sample either columns or rows, from squared length distribution For rank-k matrix approx; must know k Interesting method (for probably-approximate full SVD): QUIC-SVD [Holmes, Gray, Isbell 2008, NIPS]; QUIK-SVD [Holmes and Gray] Sample using cosine trees and stratification Builds tree as needed Full SVD: automatically sets rank based on desired error](https://image.slidesharecdn.com/ppt288/75/ppt-70-2048.jpg)
![Optimization Interesting method: Sequential minimization optimization (SMO) [Platt 1999] Much more efficient than interior-point, for SVM QPs Interesting method: Stochastic quasi-Newton [Schraudolf 2007] Does not require scan of entire data Interesting method: Sub-gradient methods [Vishwanathan and Smola 2006] Handles kinks in regularized risk functionals Interesting method: Approximate inverse preconditioning using QUIC-SVD for energy minimization and interior-point [March, Vasiloglou, Holmes, Gray] Could potentially treat a large number of optimization problems](https://image.slidesharecdn.com/ppt288/75/ppt-73-2048.jpg)

![Astronomical applications All-k-nearest-neighbors: O(N 2 ) O(N), exact. Used in [Budavari et al., in prep] Kernel density estimation: O(N 2 ) O(N), rel err. Used in [Balogh et al. 2004] Nonparametric Bayes classifier (KDA): O(N 2 ) O(N), exact. Used in [Richards et al. 2004,2009], [Scranton et al. 2005] n-point correlations: O(N n ) O(N logn ), exact. Used in [Wake et al. 2004], [Giannantonio et al 2006],[Kulkarni et al 2007]](https://image.slidesharecdn.com/ppt288/75/ppt-75-2048.jpg)


![Our upcoming products MLPACK: “the LAPACK of machine learning” – Dec. 2008 [FASTlab] THOR: “the MapReduce of Generalized N-body Problems” – Apr. 2009 [Boyer, Riegel, Gray] CAS Analytics: fast data analysis in CAS (SQL Server) – Apr. 2009 [Riegel, Aditya, Krishnaiah, Jakka, Karnik, Gray] LogicBlox: all-in-one business intelligence [Kanetkar, Riegel, Gray]](https://image.slidesharecdn.com/ppt288/75/ppt-81-2048.jpg)
![Keep in mind the software complexity Automatic code generation (e.g. MapReduce) Automatic tuning (e.g. OSKI) Automatic algorithm derivation (e.g. SPIRAL, AutoBayes) [Gray et al. 2004; Bhat, Riegel, Gray, Agarwal]](https://image.slidesharecdn.com/ppt288/75/ppt-82-2048.jpg)
![The end We have/will have fast algorithms for most data analysis methods in MLPACK Many opportunities for applied math and computer science in large-scale data analysis Caveat: Must treat the right problem Computational astronomy workshop and large-scale data analysis workshop coming soon Alexander Gray [email_address] (email is best; webpage sorely out of date)](https://image.slidesharecdn.com/ppt288/75/ppt-83-2048.jpg)


