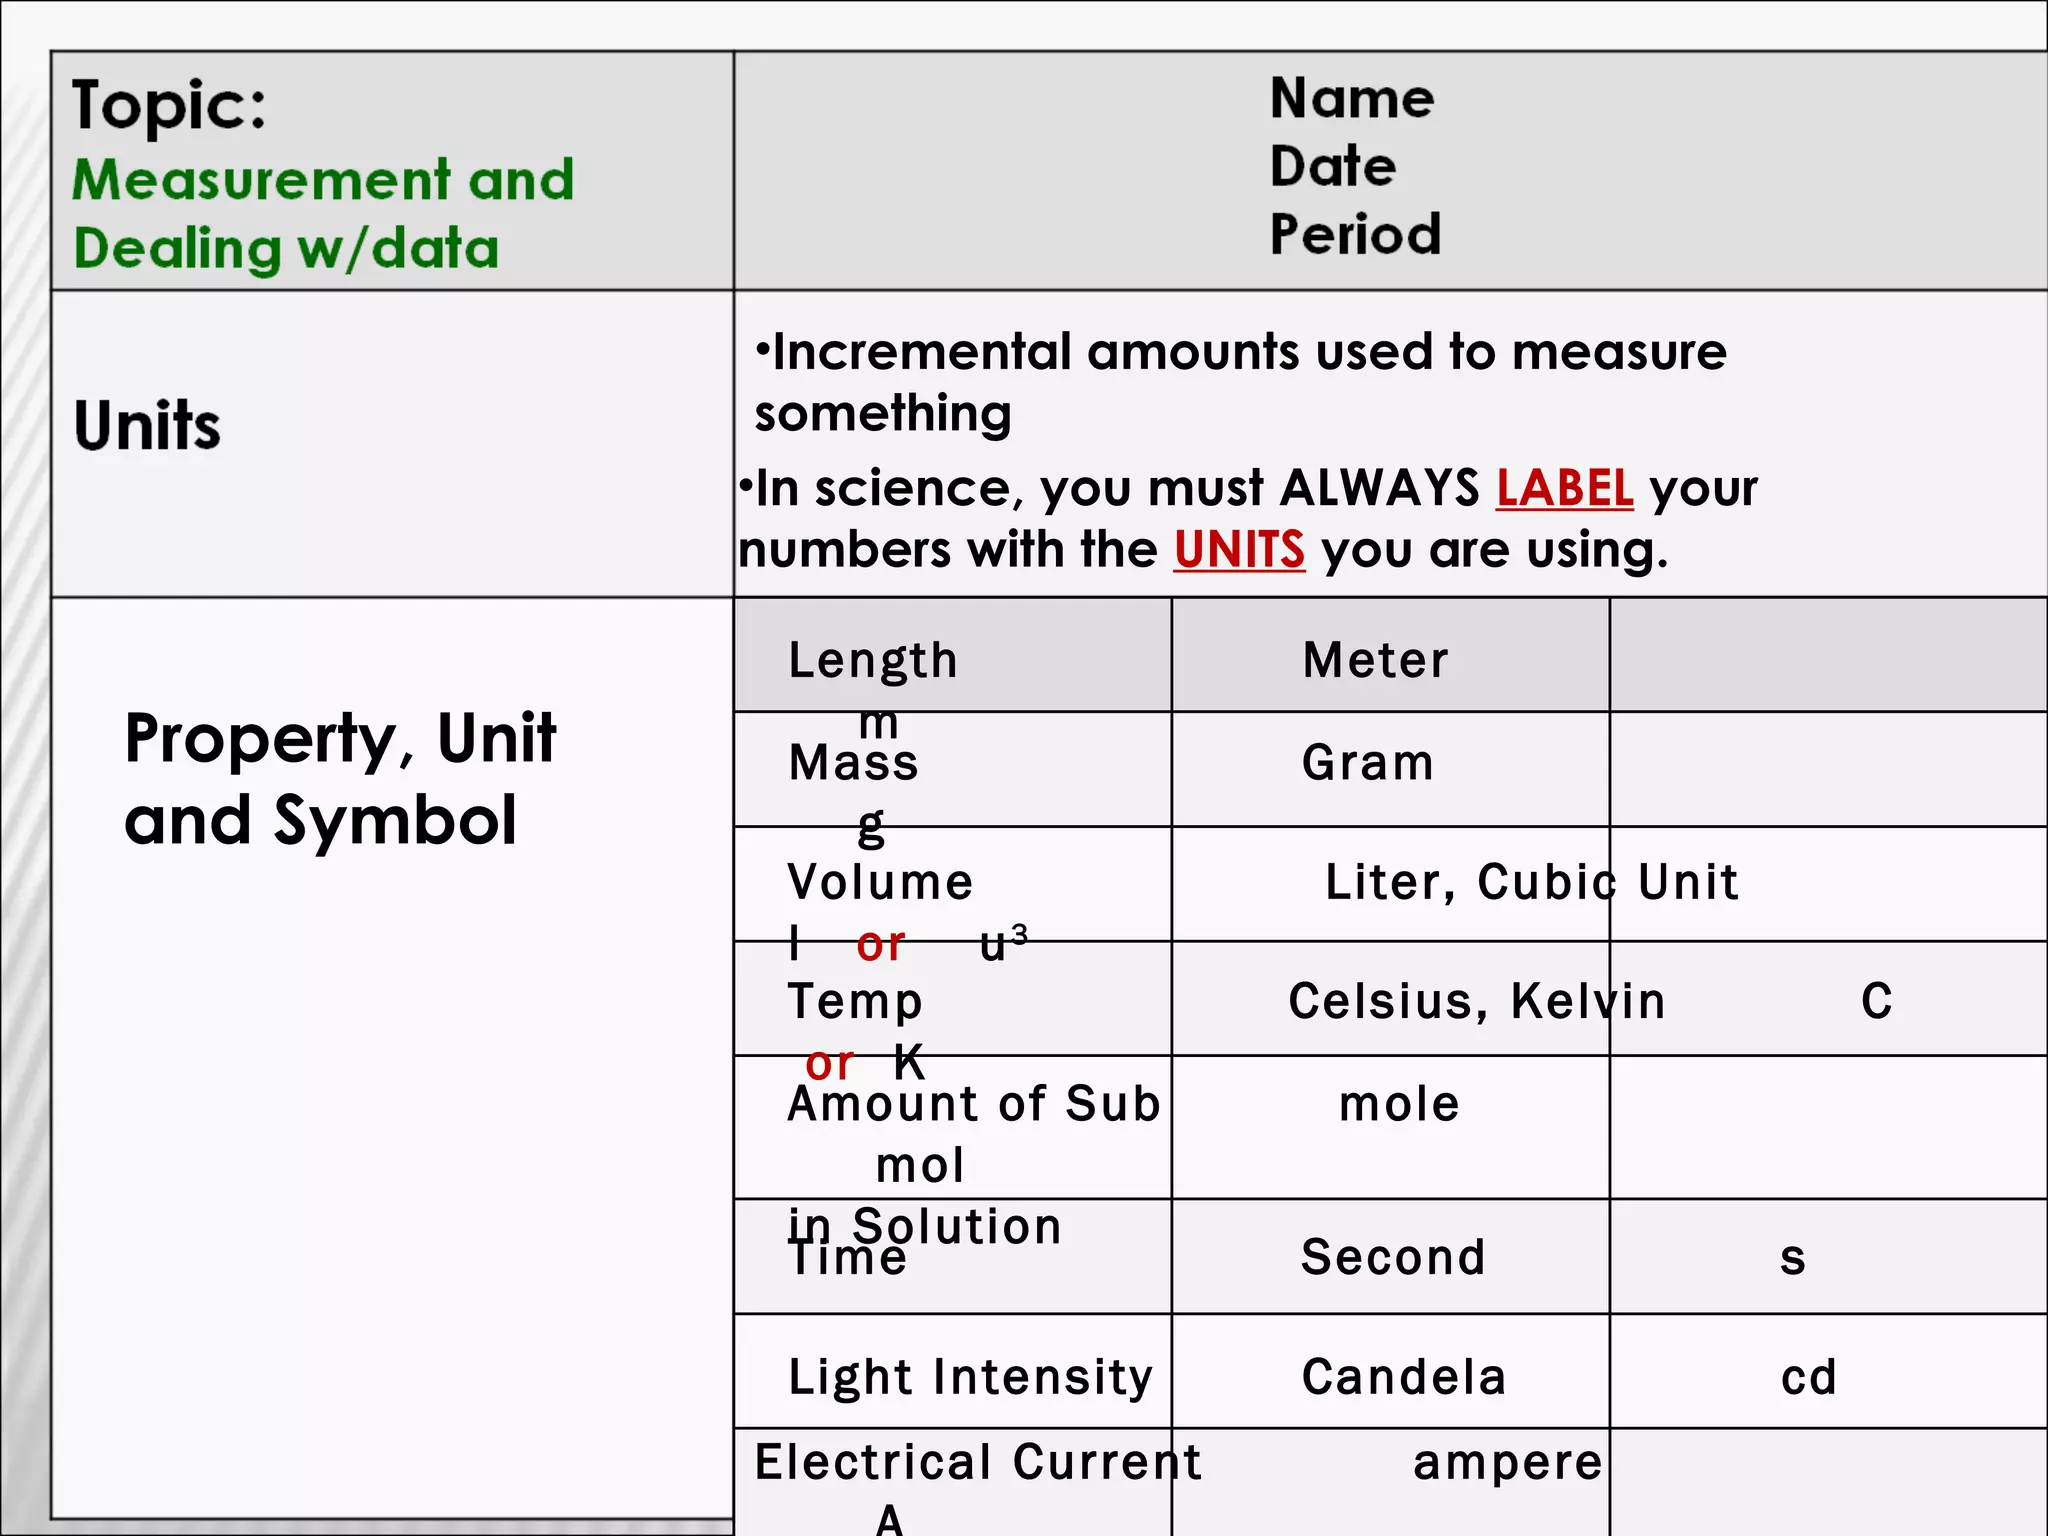
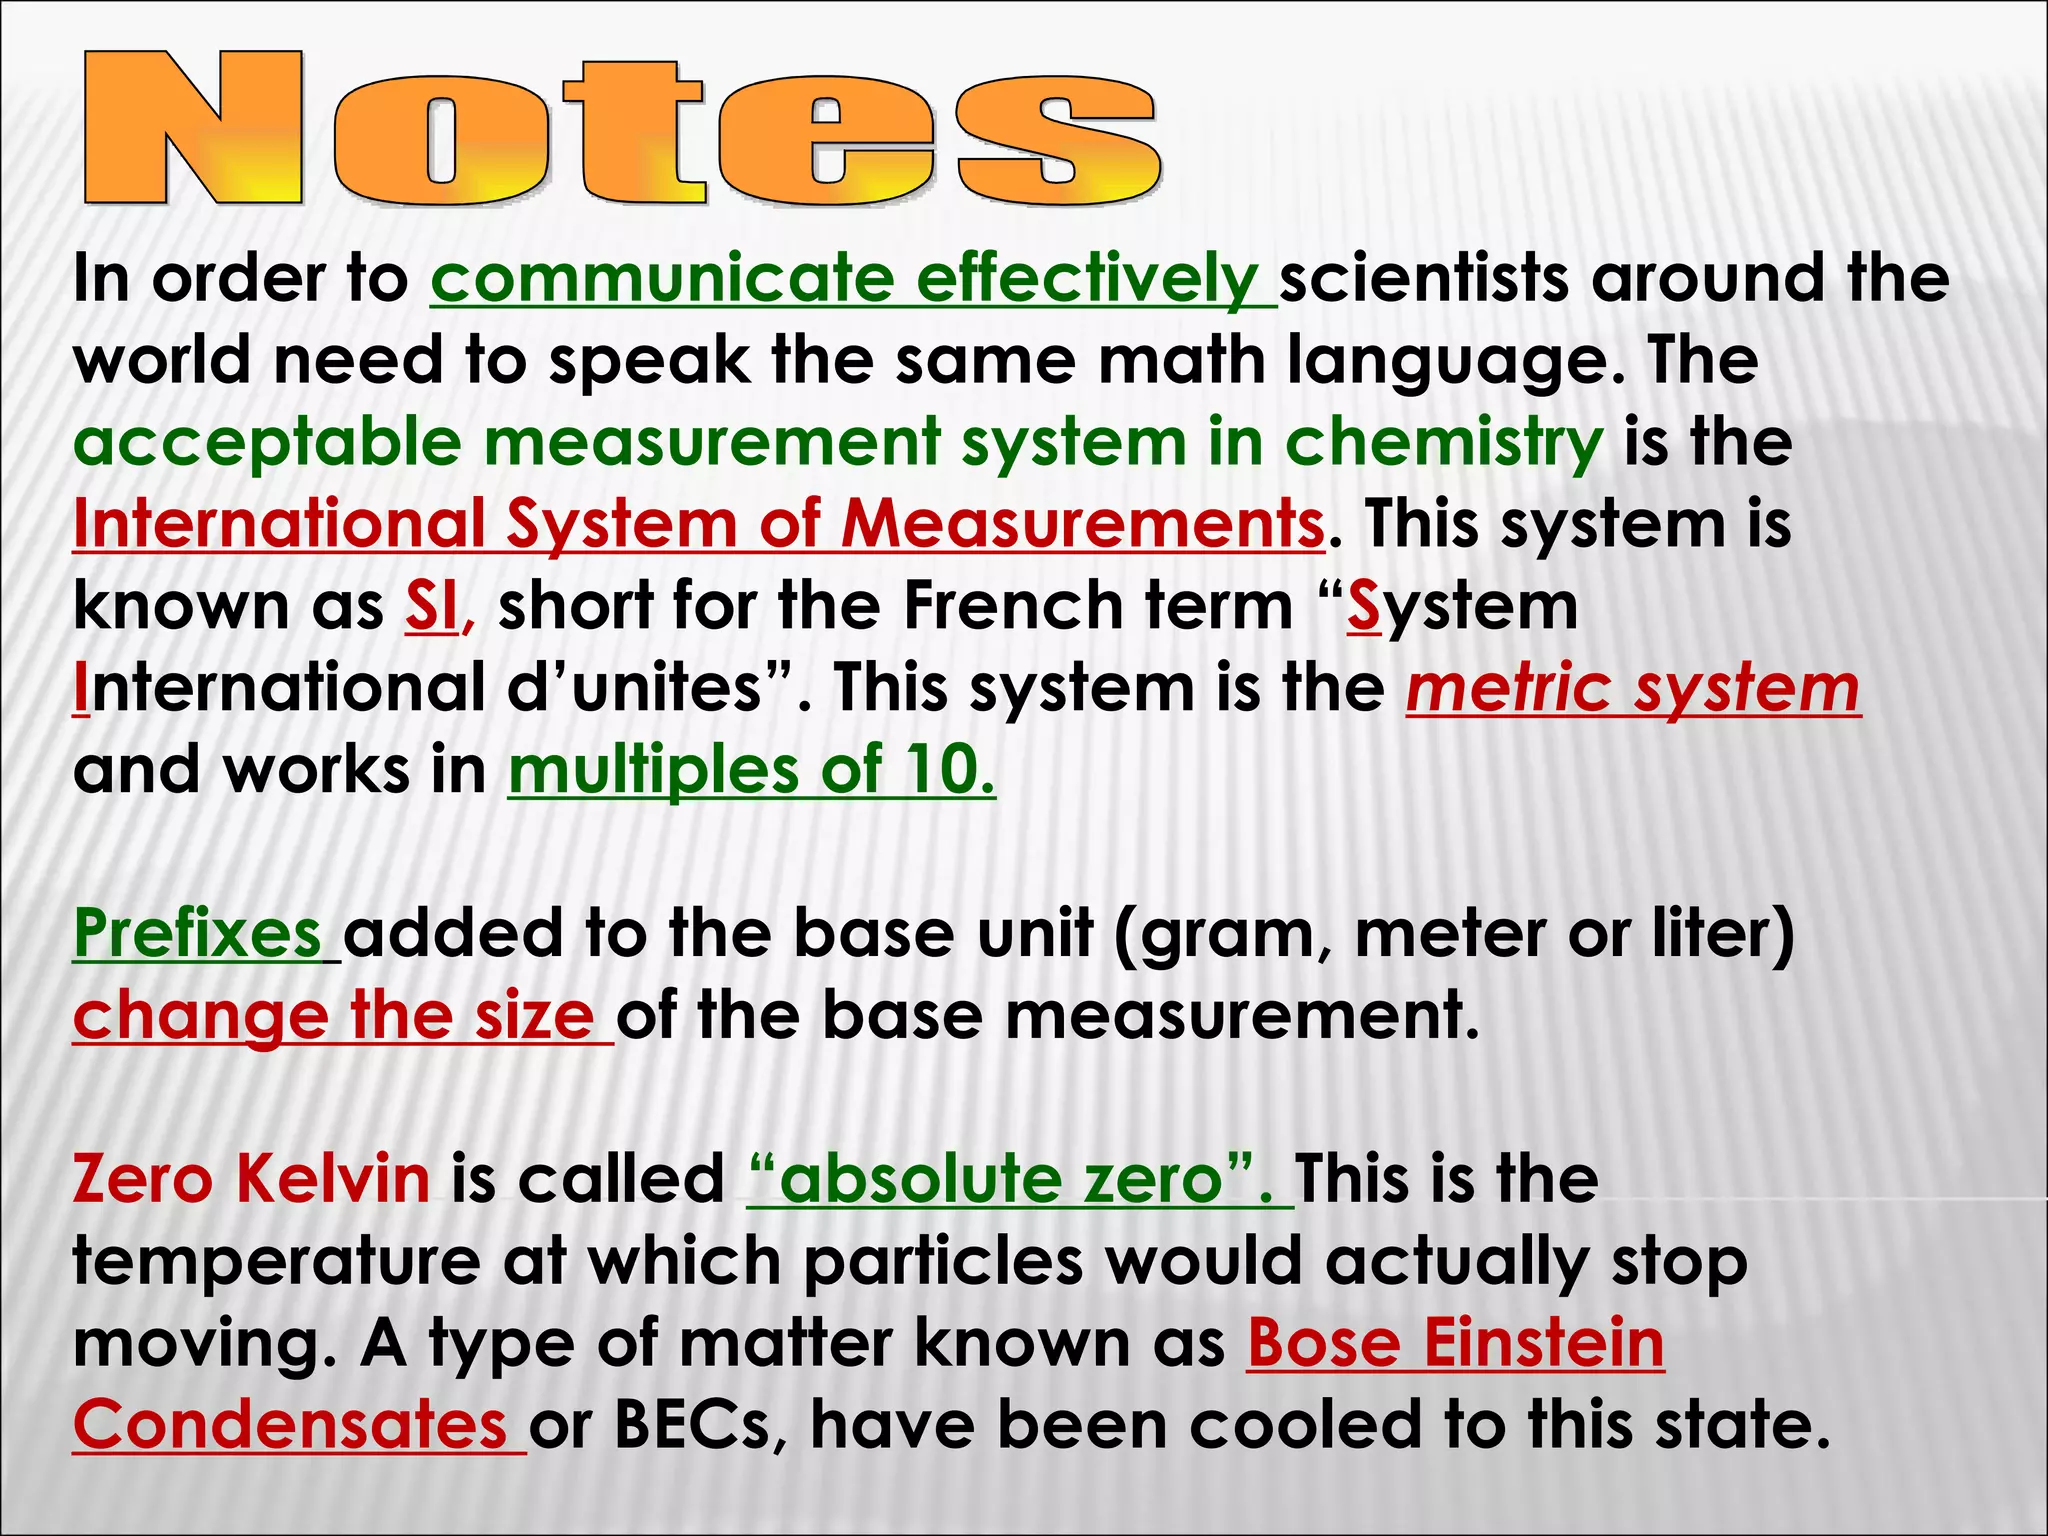
1) The document provides an overview of measurements and units used in chemistry, including the metric system prefixes and units for length, mass, volume, temperature, amount of substance, and time.
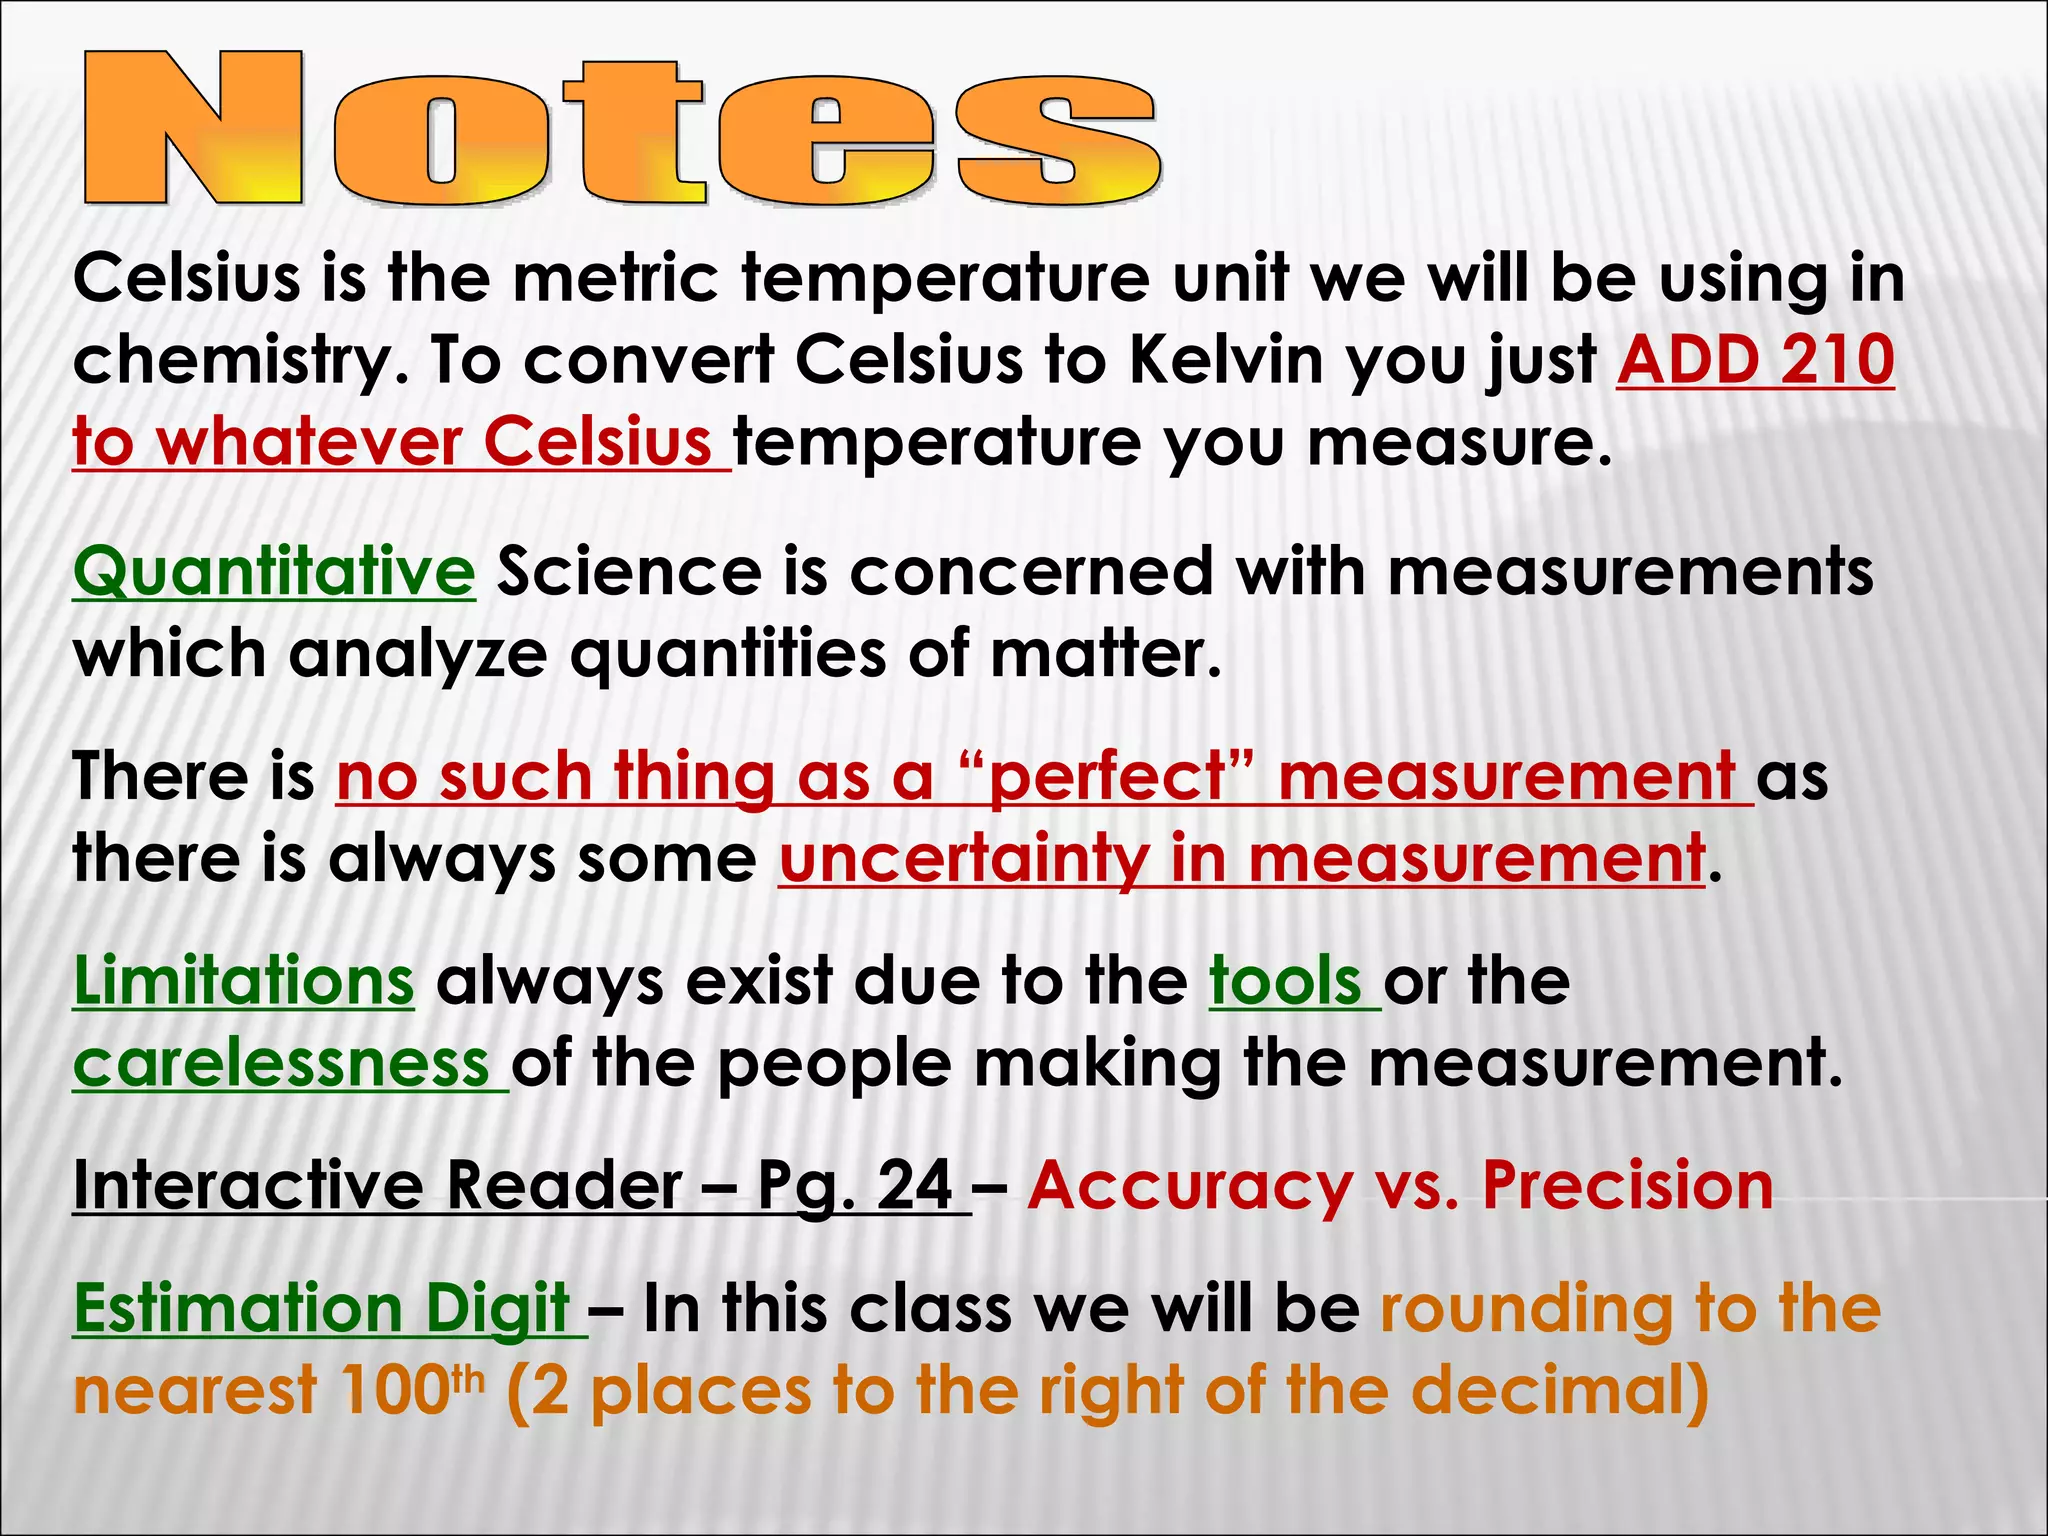
2) It discusses the importance of labeling measurements with units and outlines sources of uncertainty in measurements.
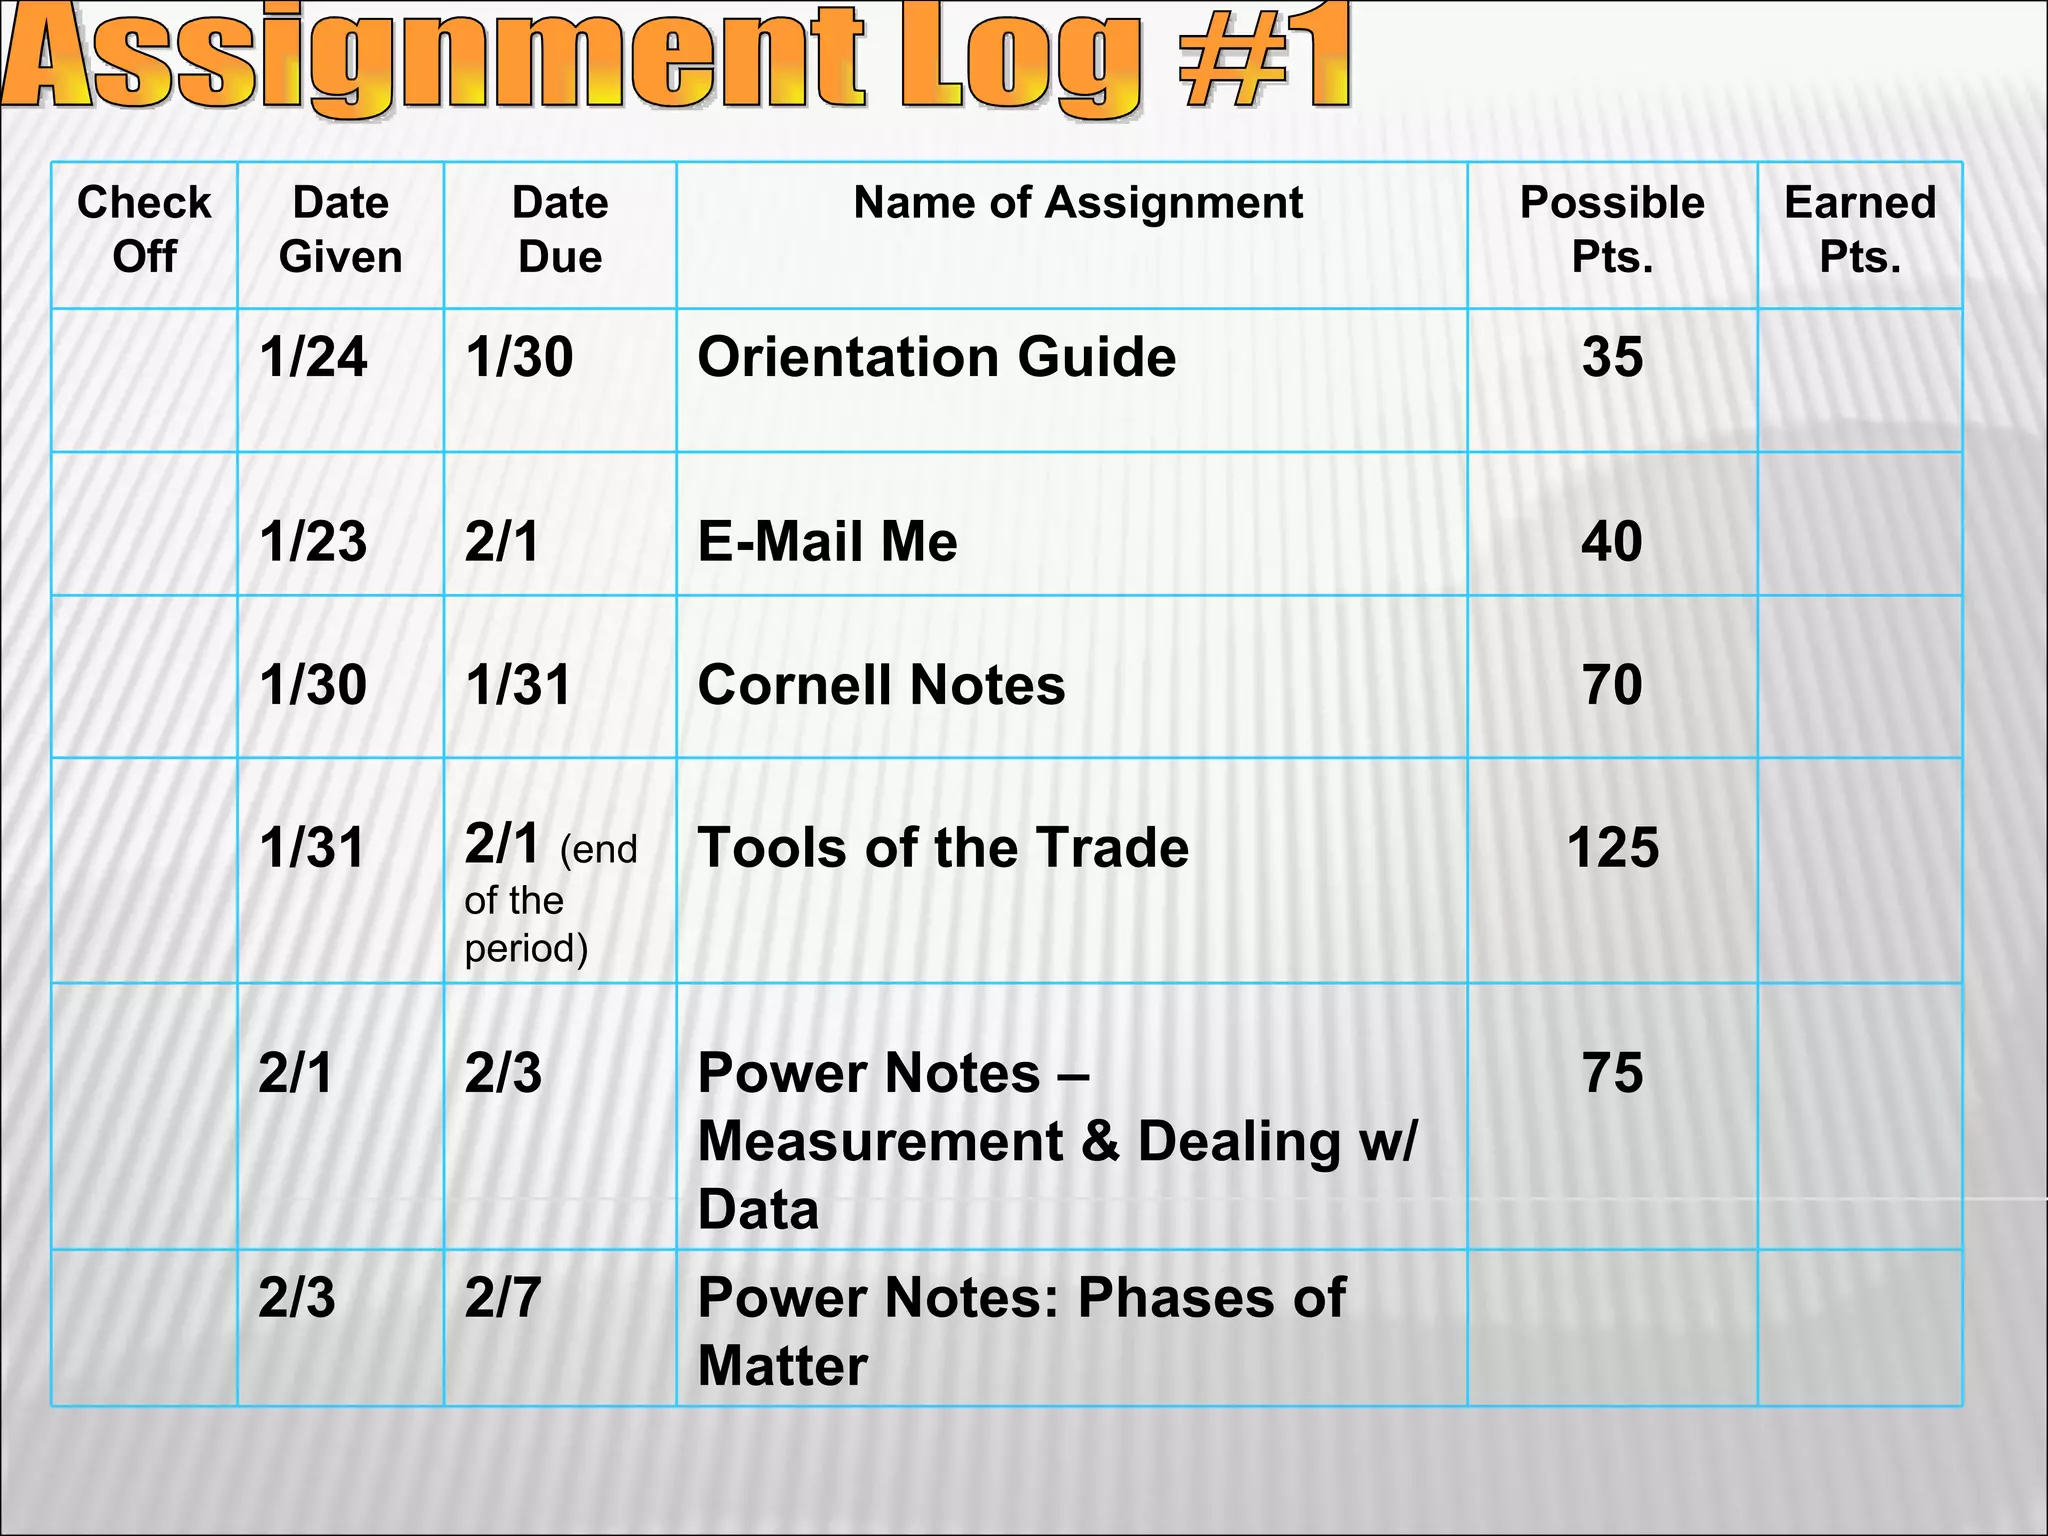
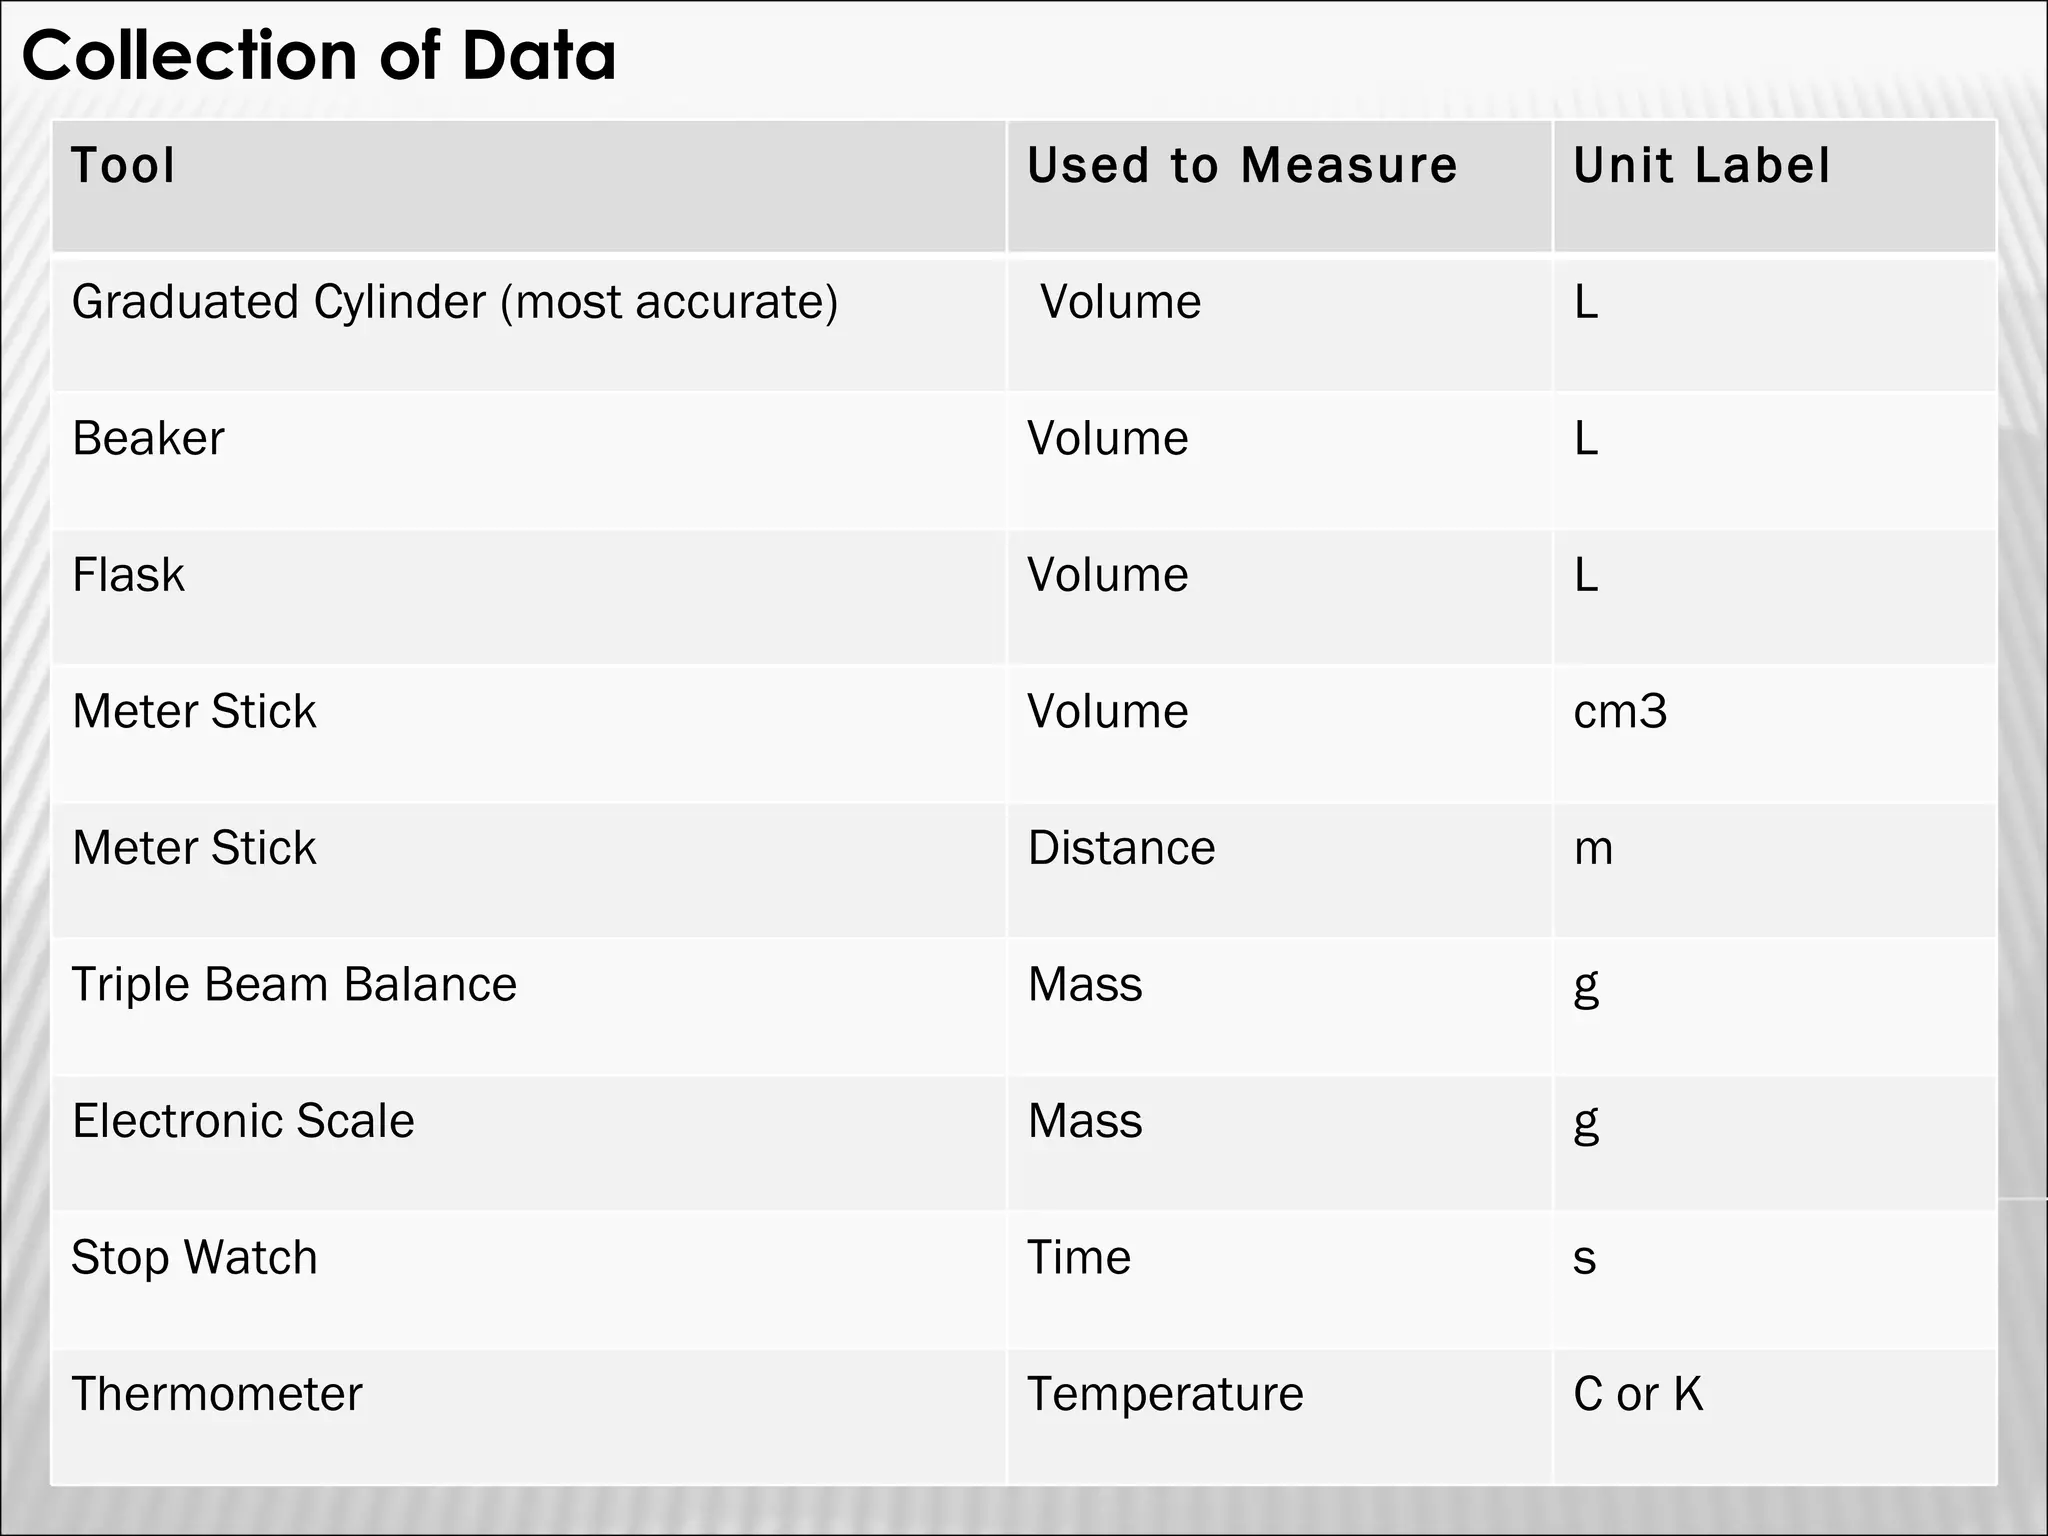
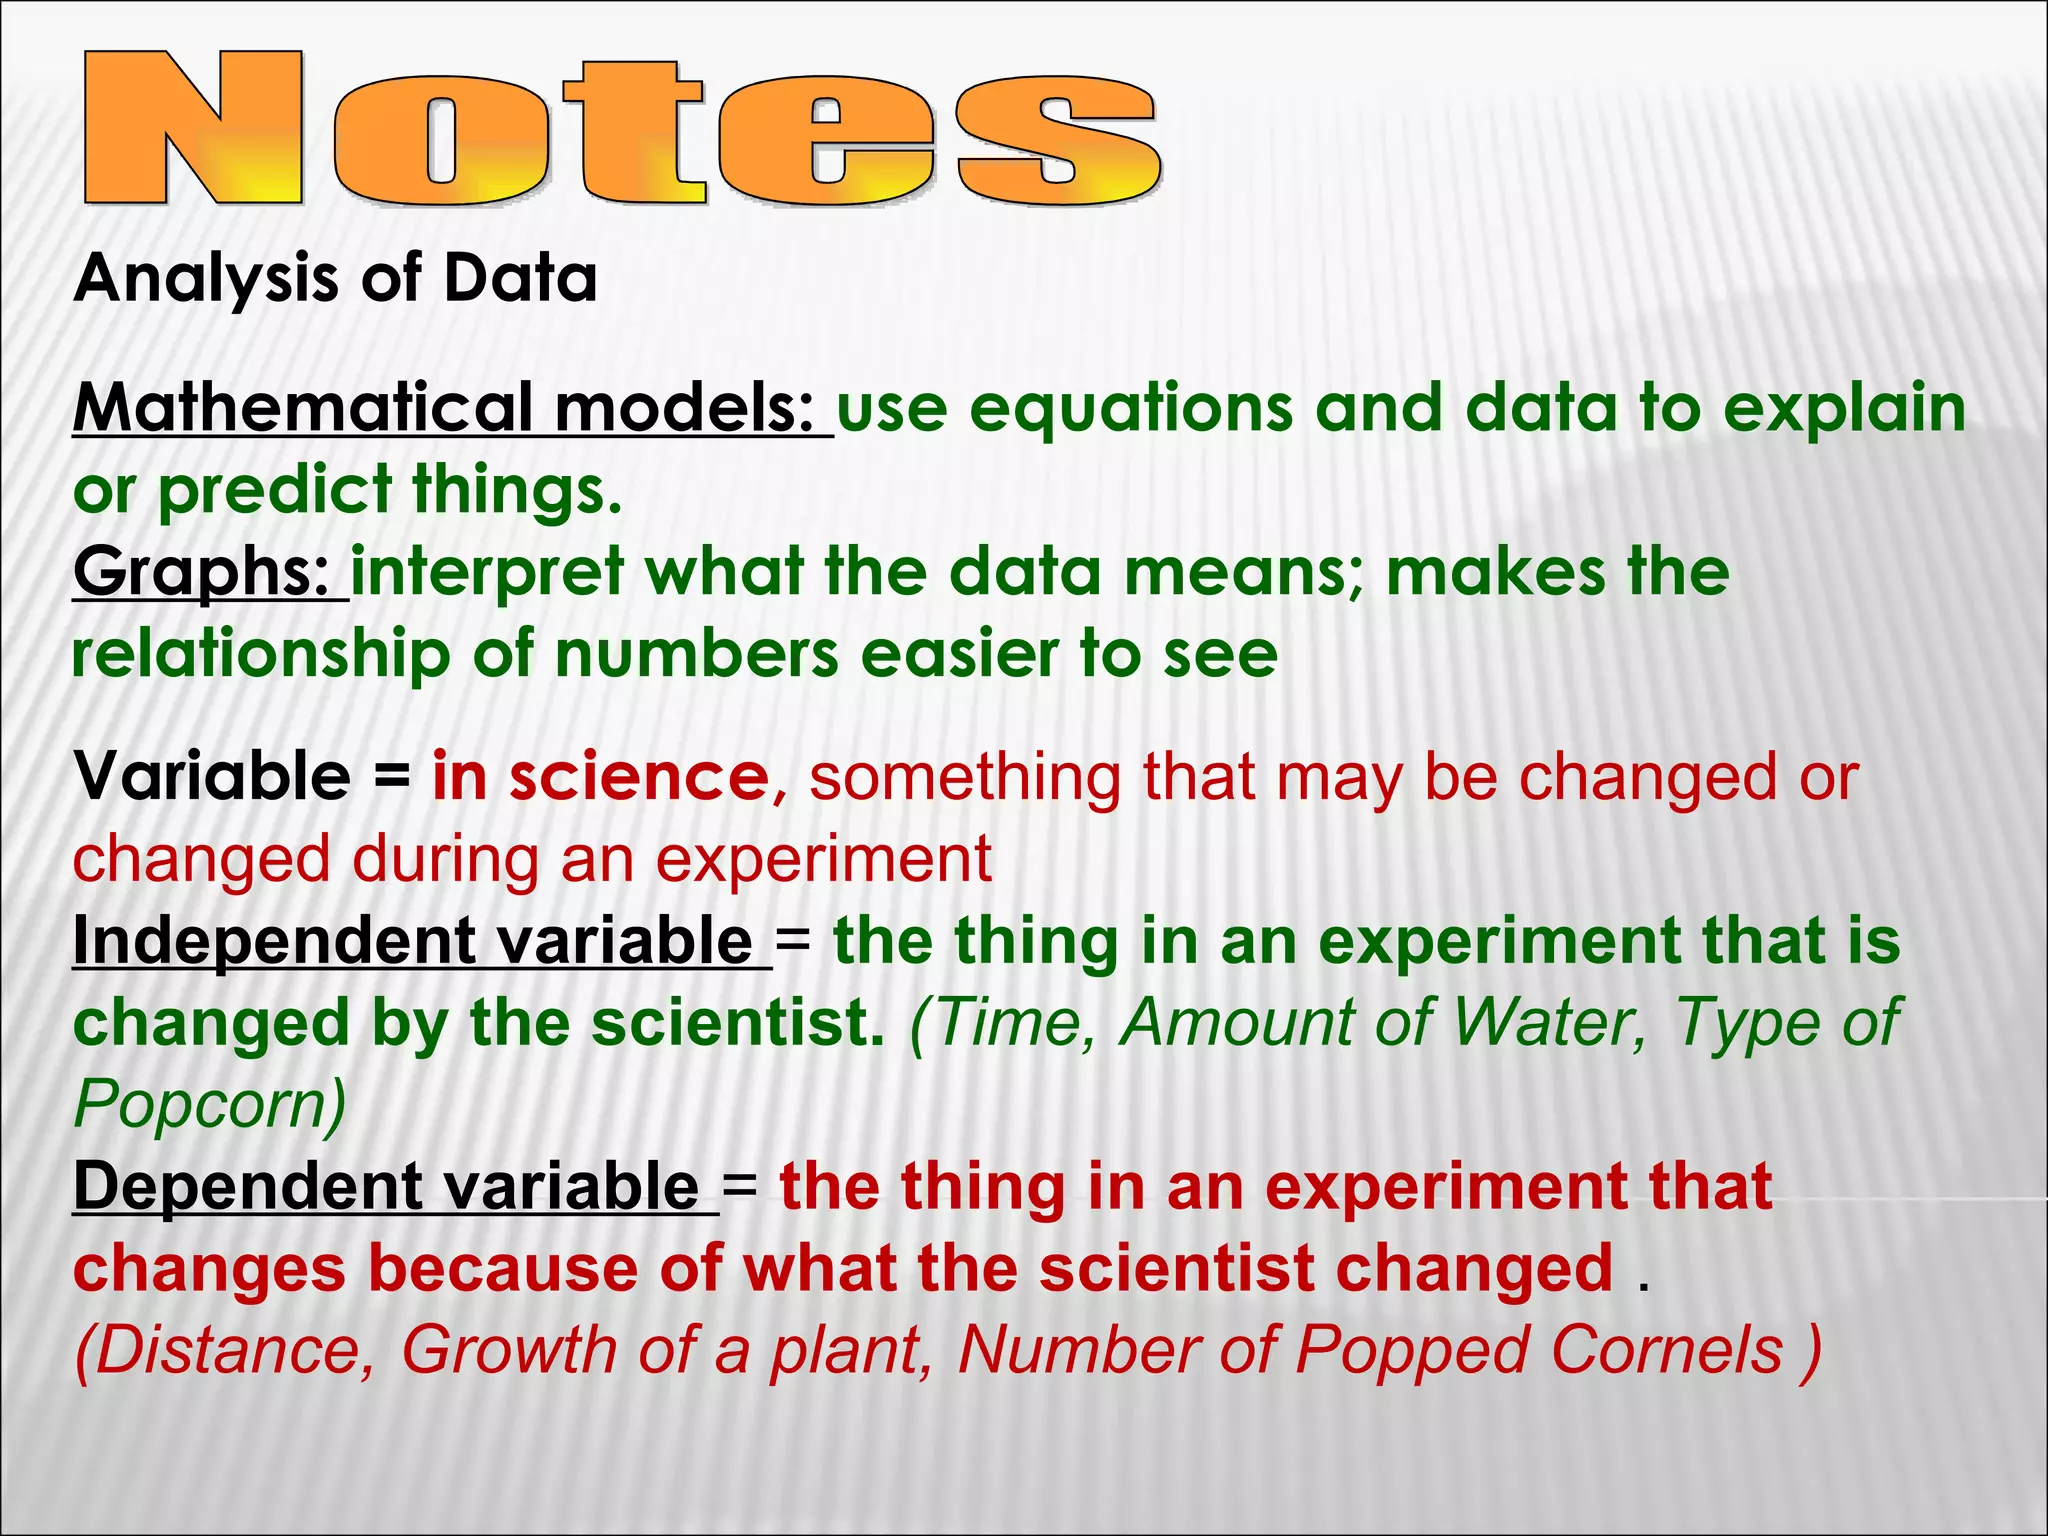
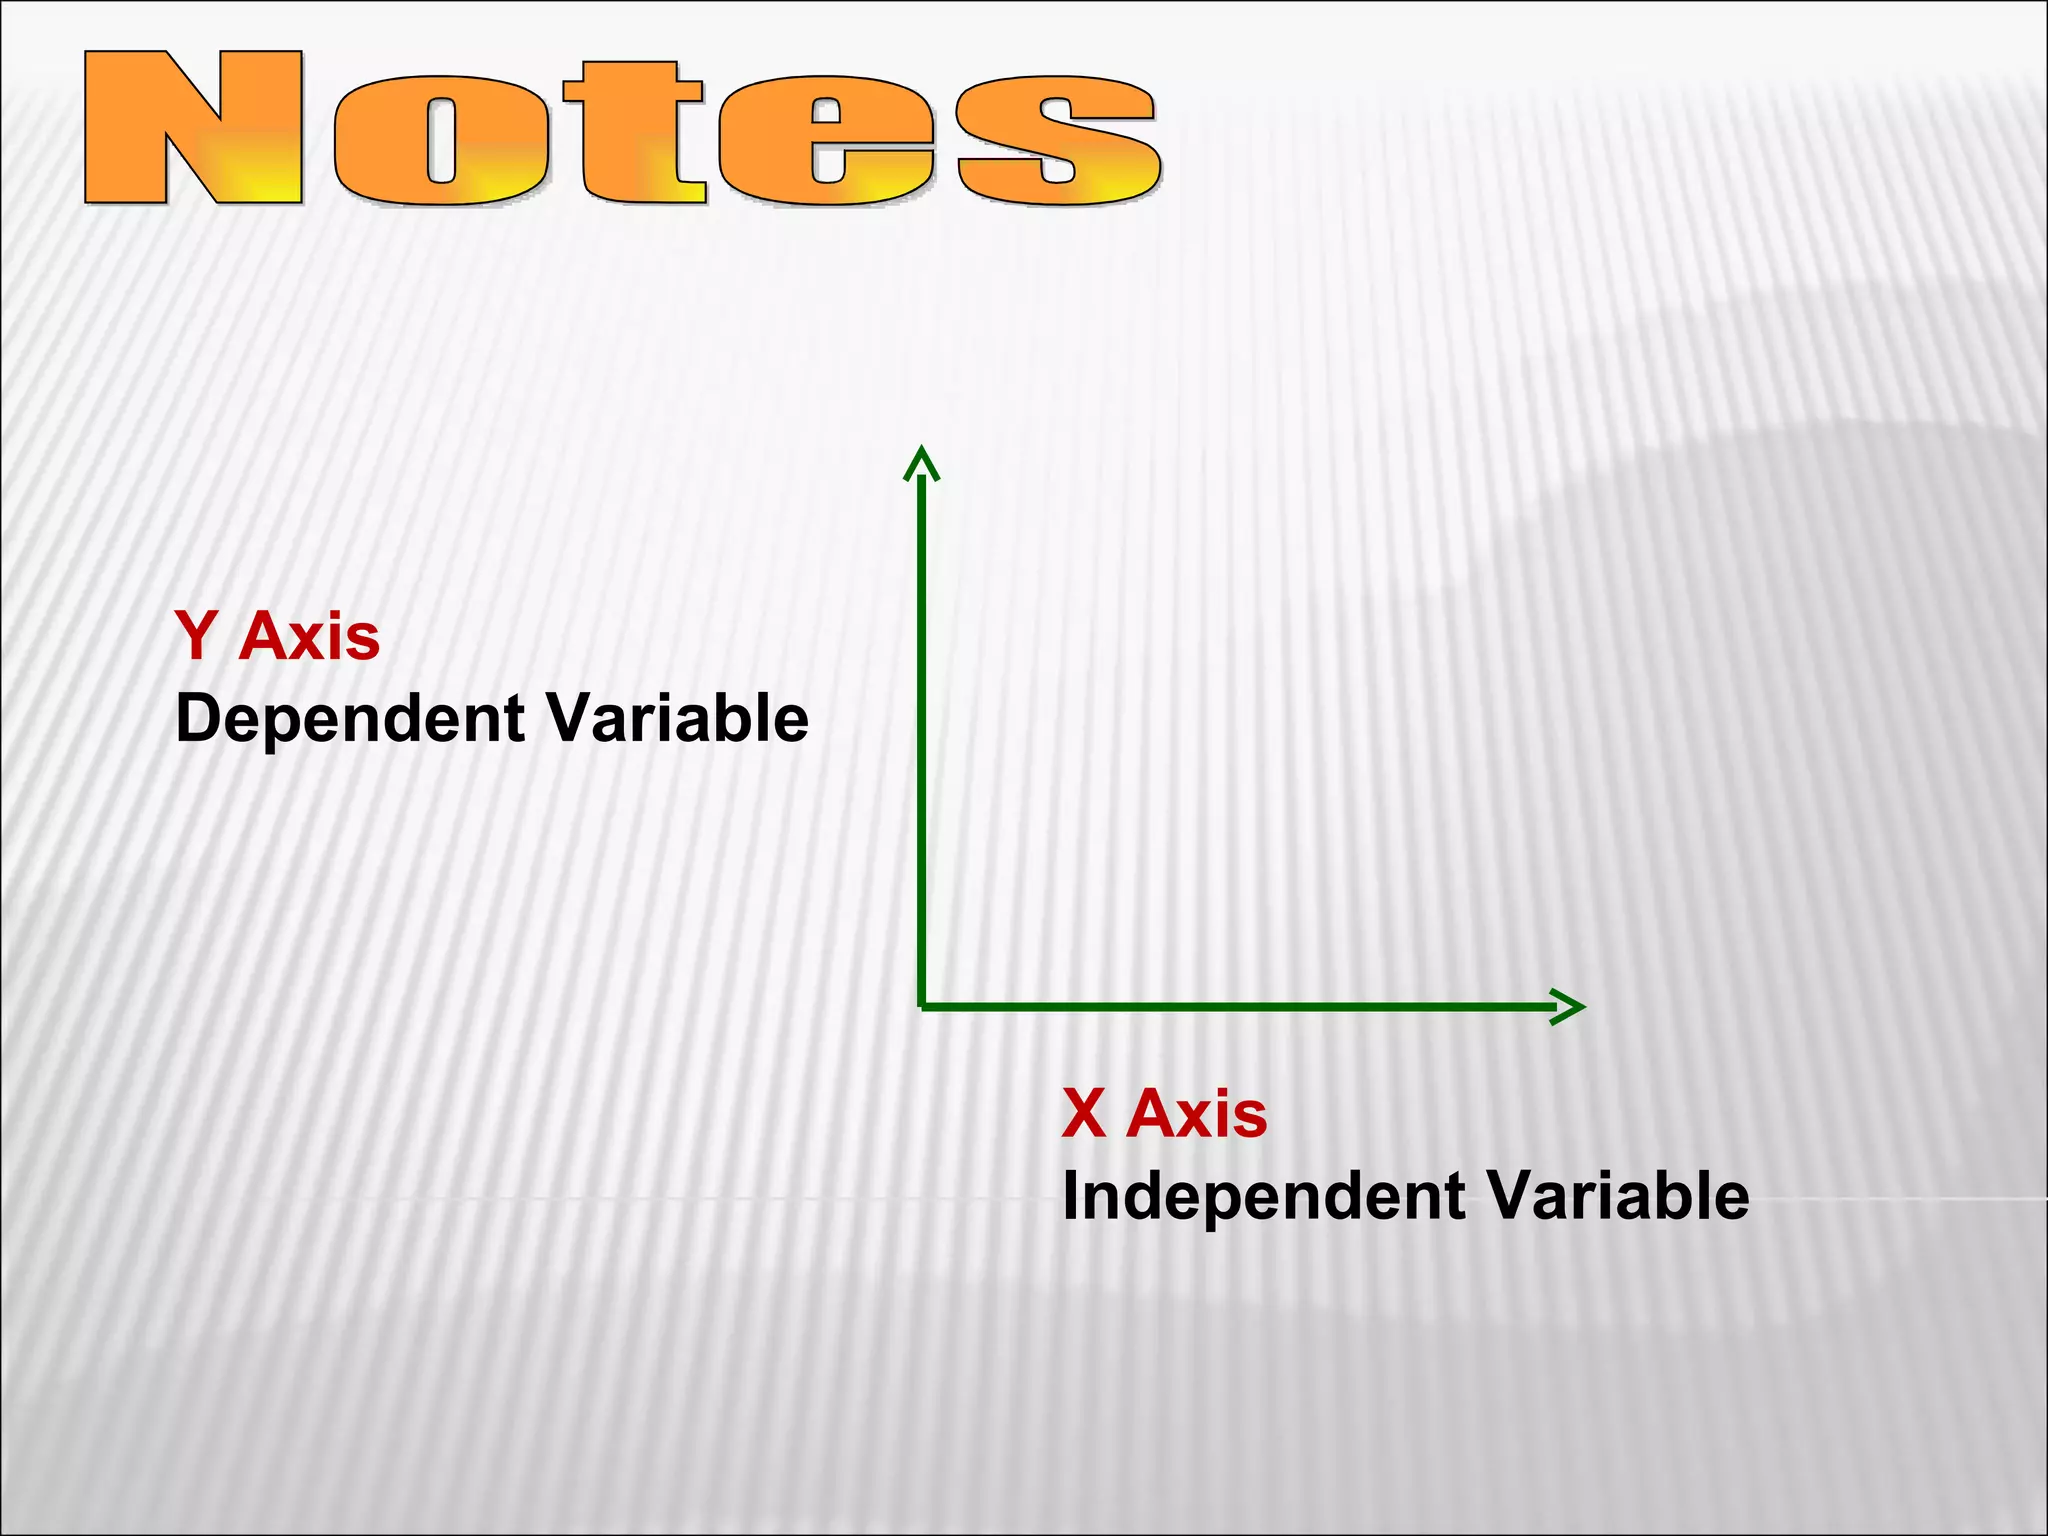
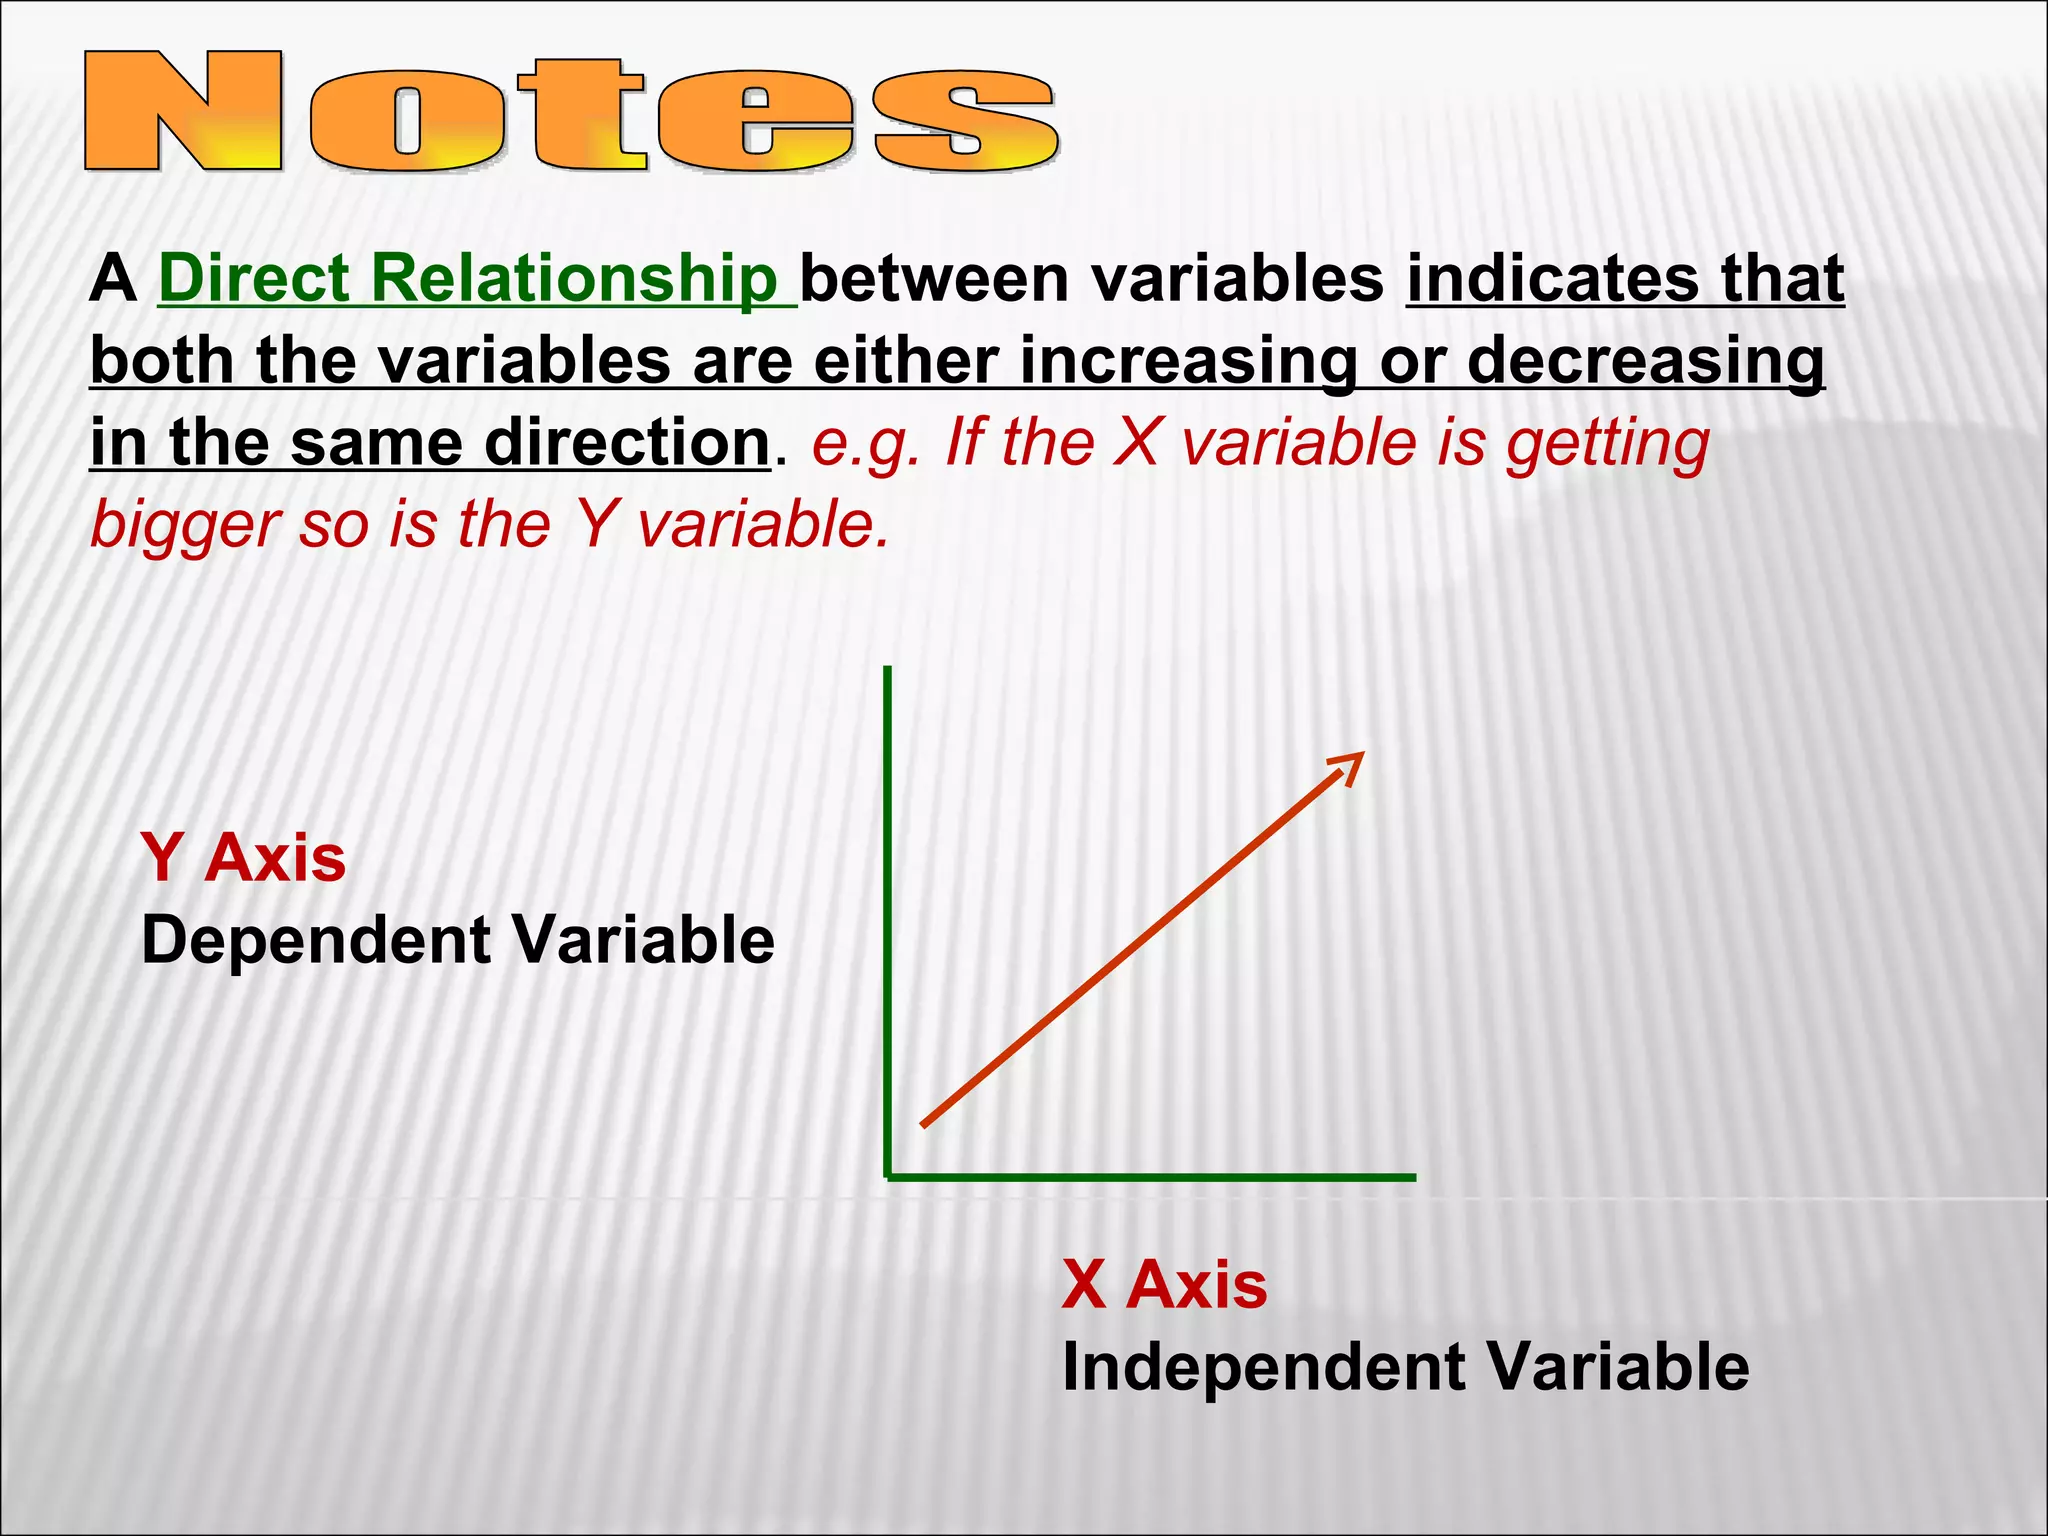
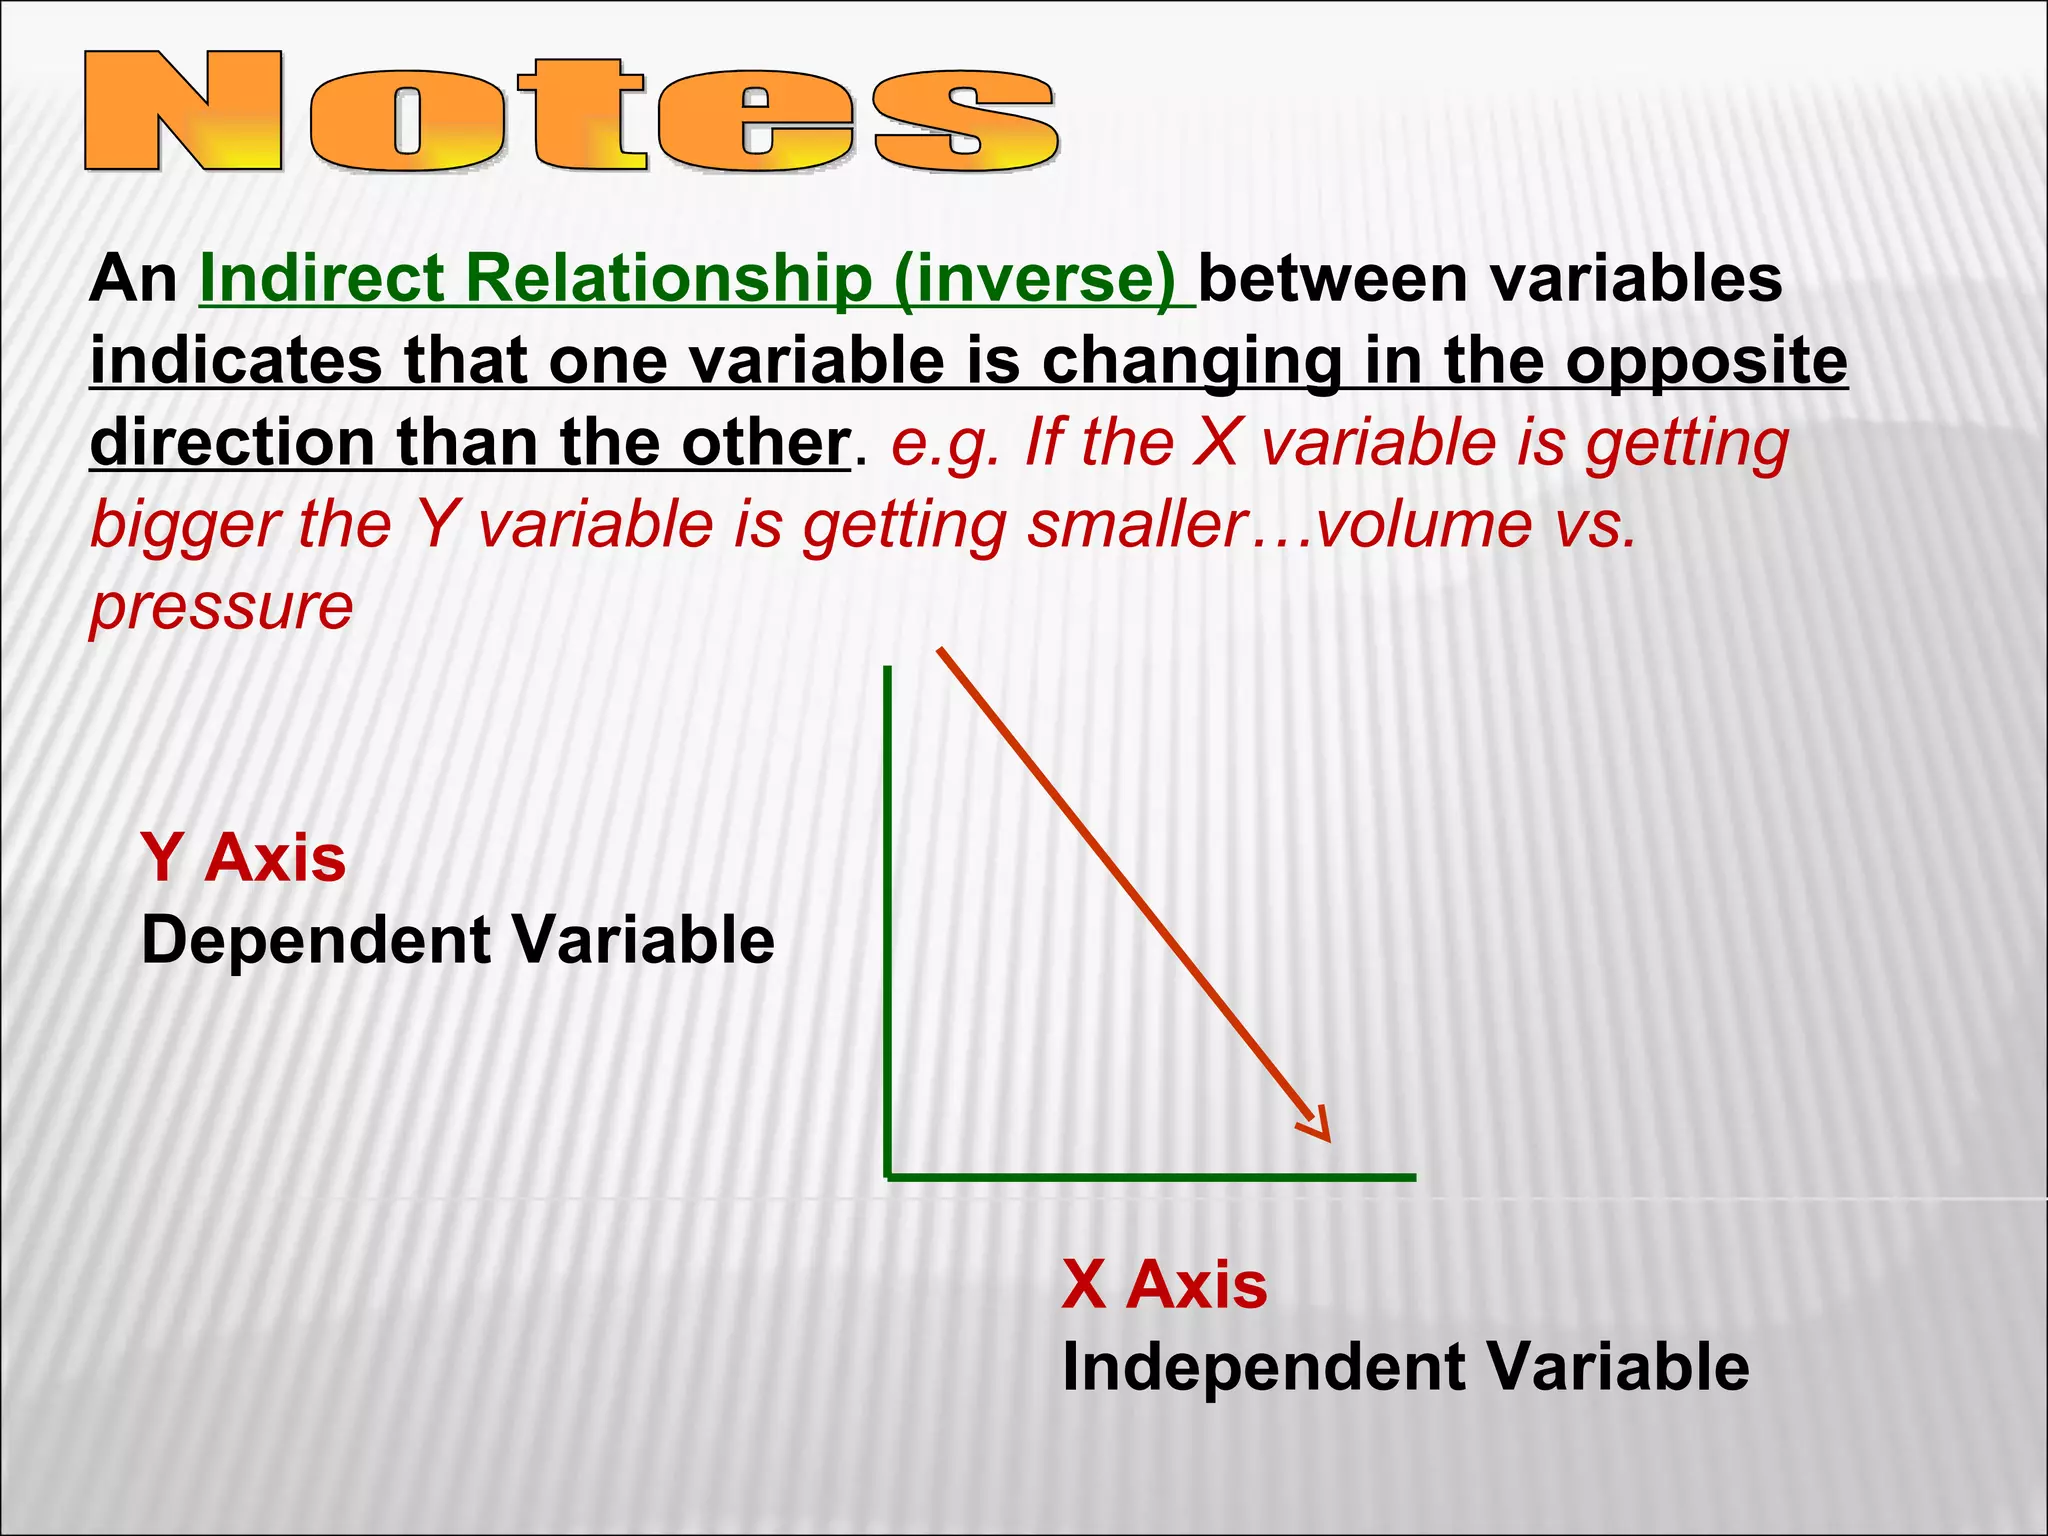
3) The final sections cover tools for collecting data, analyzing data through graphs and mathematical models, and identifying direct and indirect relationships between variables in an experiment.