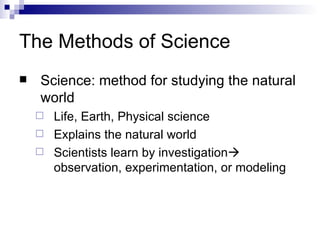
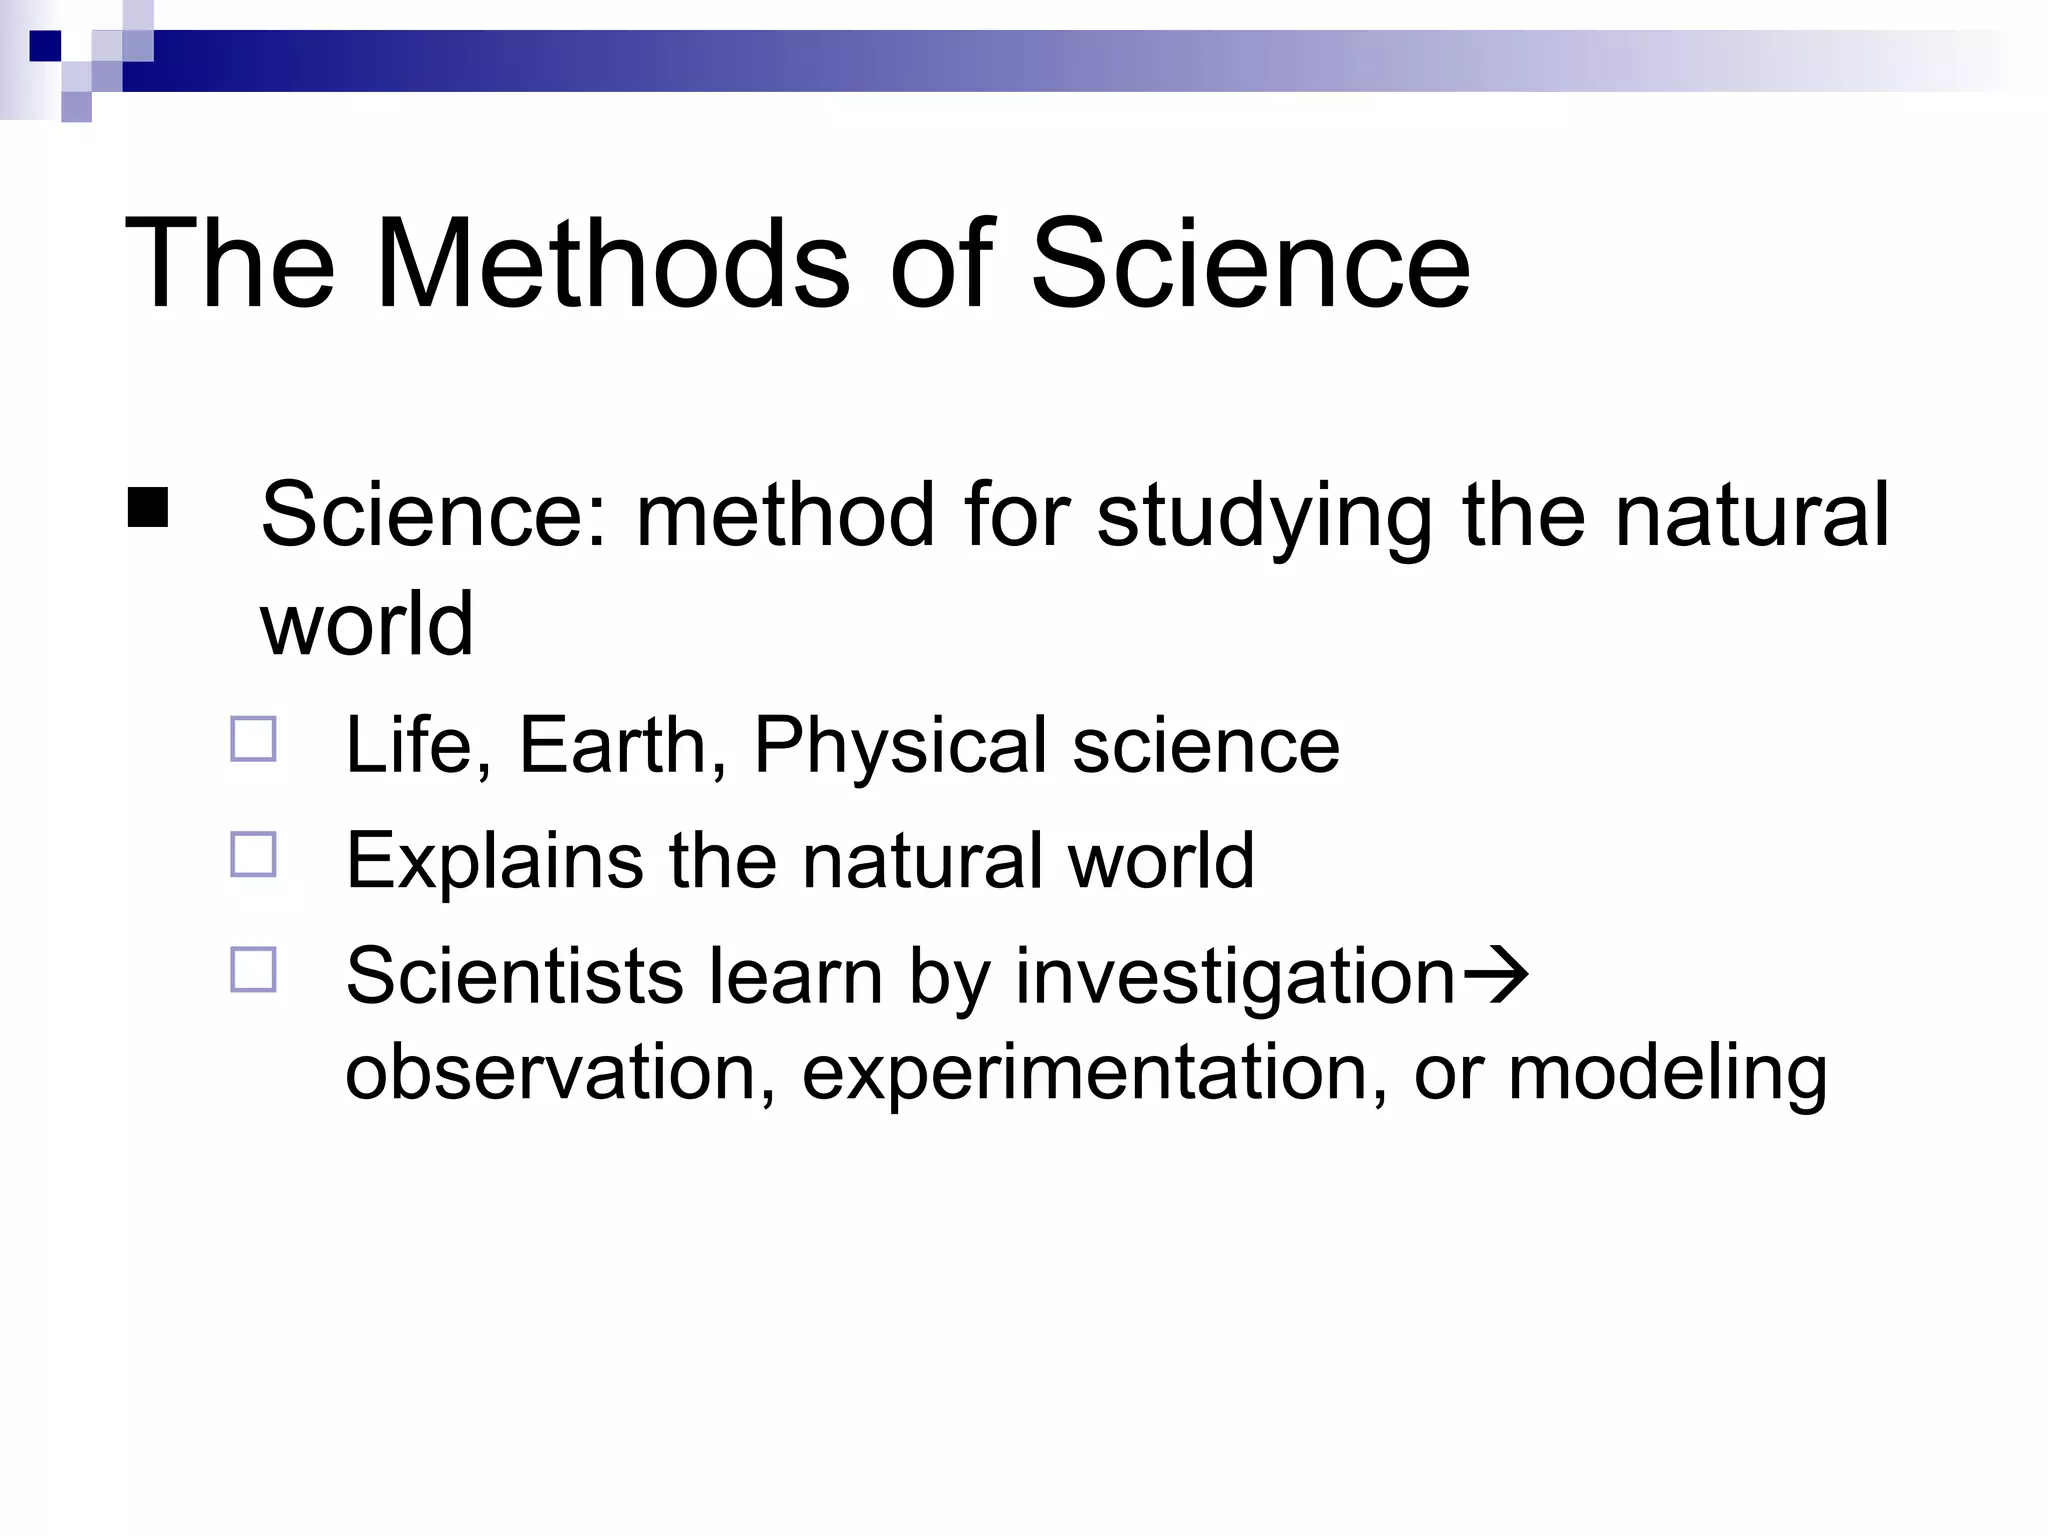
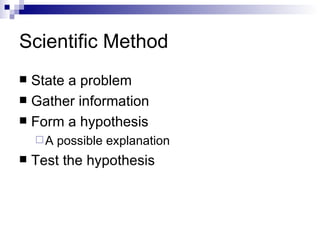
The Methods of Science Science: method for studying the natural world Life, Earth, Physical science Explains the natural world Scientists learn by investigation   observation, experimentation, or modeling
Scientific Method State a problem Gather information Form a hypothesis A possible explanation Test the hypothesis
Testing a Hypothesis Experiments with variables Dependant variable changes values as other variables change Independent variable is changed to determine how it will affect the dependent variable A variable that does not change when other variables change is a constant A control is the standard to which test results are compared
Analyze data from experiment or investigation Form a conclusion based on the data Reduce bias by  keeping accurate records Repeating the experiment Using data that is measurable
Standards of Measurement Standard Exact quantity that people agree to use for comparison Measurements must be taken carefully Precise:  how closely measurements are to each other Accurate:  how closely measurement is to real or accepted value
International System of Units:  SI Based on the metric system    multiples of 10 Used by scientists worldwide
Distance Measure distance between 2 points SI unit of measure is the  Meter:  about a baseball bat in length Volume Amount of space occupied by an object 1 L= 1 dm 3  = 10 cm 3 =  1000 ml
Mass A measurement of the quantity of matter in an object Density is a combination of units   derived unit Mass/volume  Aluminum vs. iron
Time Interval between 2 events SI unit    seconds Temperature Measure of how hot or cold something is SI unit is Kelvin    K  0 K is the coldest possible temperature -273  ºC = 0 K
Communicating with Graphs Visual display of information or data  Used to detect patterns Line graph Shows a relationship where the dependent variable changes due to a change in the independent variable x axis = independent variable y axis = dependent variable
Bar graph compares information collected by counting Each bar represents a quantity counted at a particular time Circle graph shows how a whole is broken into parts The parts represent percentages of the whole


The Methods Of Science

  • 1.
    The Methods ofScience Science: method for studying the natural world Life, Earth, Physical science Explains the natural world Scientists learn by investigation  observation, experimentation, or modeling
  • 2.
    Scientific Method Statea problem Gather information Form a hypothesis A possible explanation Test the hypothesis
  • 3.
    Testing a HypothesisExperiments with variables Dependant variable changes values as other variables change Independent variable is changed to determine how it will affect the dependent variable A variable that does not change when other variables change is a constant A control is the standard to which test results are compared
  • 4.
    Analyze data fromexperiment or investigation Form a conclusion based on the data Reduce bias by keeping accurate records Repeating the experiment Using data that is measurable
  • 5.
    Standards of MeasurementStandard Exact quantity that people agree to use for comparison Measurements must be taken carefully Precise: how closely measurements are to each other Accurate: how closely measurement is to real or accepted value
  • 6.
    International System ofUnits: SI Based on the metric system  multiples of 10 Used by scientists worldwide
  • 7.
    Distance Measure distancebetween 2 points SI unit of measure is the Meter: about a baseball bat in length Volume Amount of space occupied by an object 1 L= 1 dm 3 = 10 cm 3 = 1000 ml
  • 8.
    Mass A measurementof the quantity of matter in an object Density is a combination of units  derived unit Mass/volume Aluminum vs. iron
  • 9.
    Time Interval between2 events SI unit  seconds Temperature Measure of how hot or cold something is SI unit is Kelvin  K 0 K is the coldest possible temperature -273 ºC = 0 K
  • 10.
    Communicating with GraphsVisual display of information or data Used to detect patterns Line graph Shows a relationship where the dependent variable changes due to a change in the independent variable x axis = independent variable y axis = dependent variable
  • 11.
    Bar graph comparesinformation collected by counting Each bar represents a quantity counted at a particular time Circle graph shows how a whole is broken into parts The parts represent percentages of the whole
  • 12.
  • 13.