Download to read offline
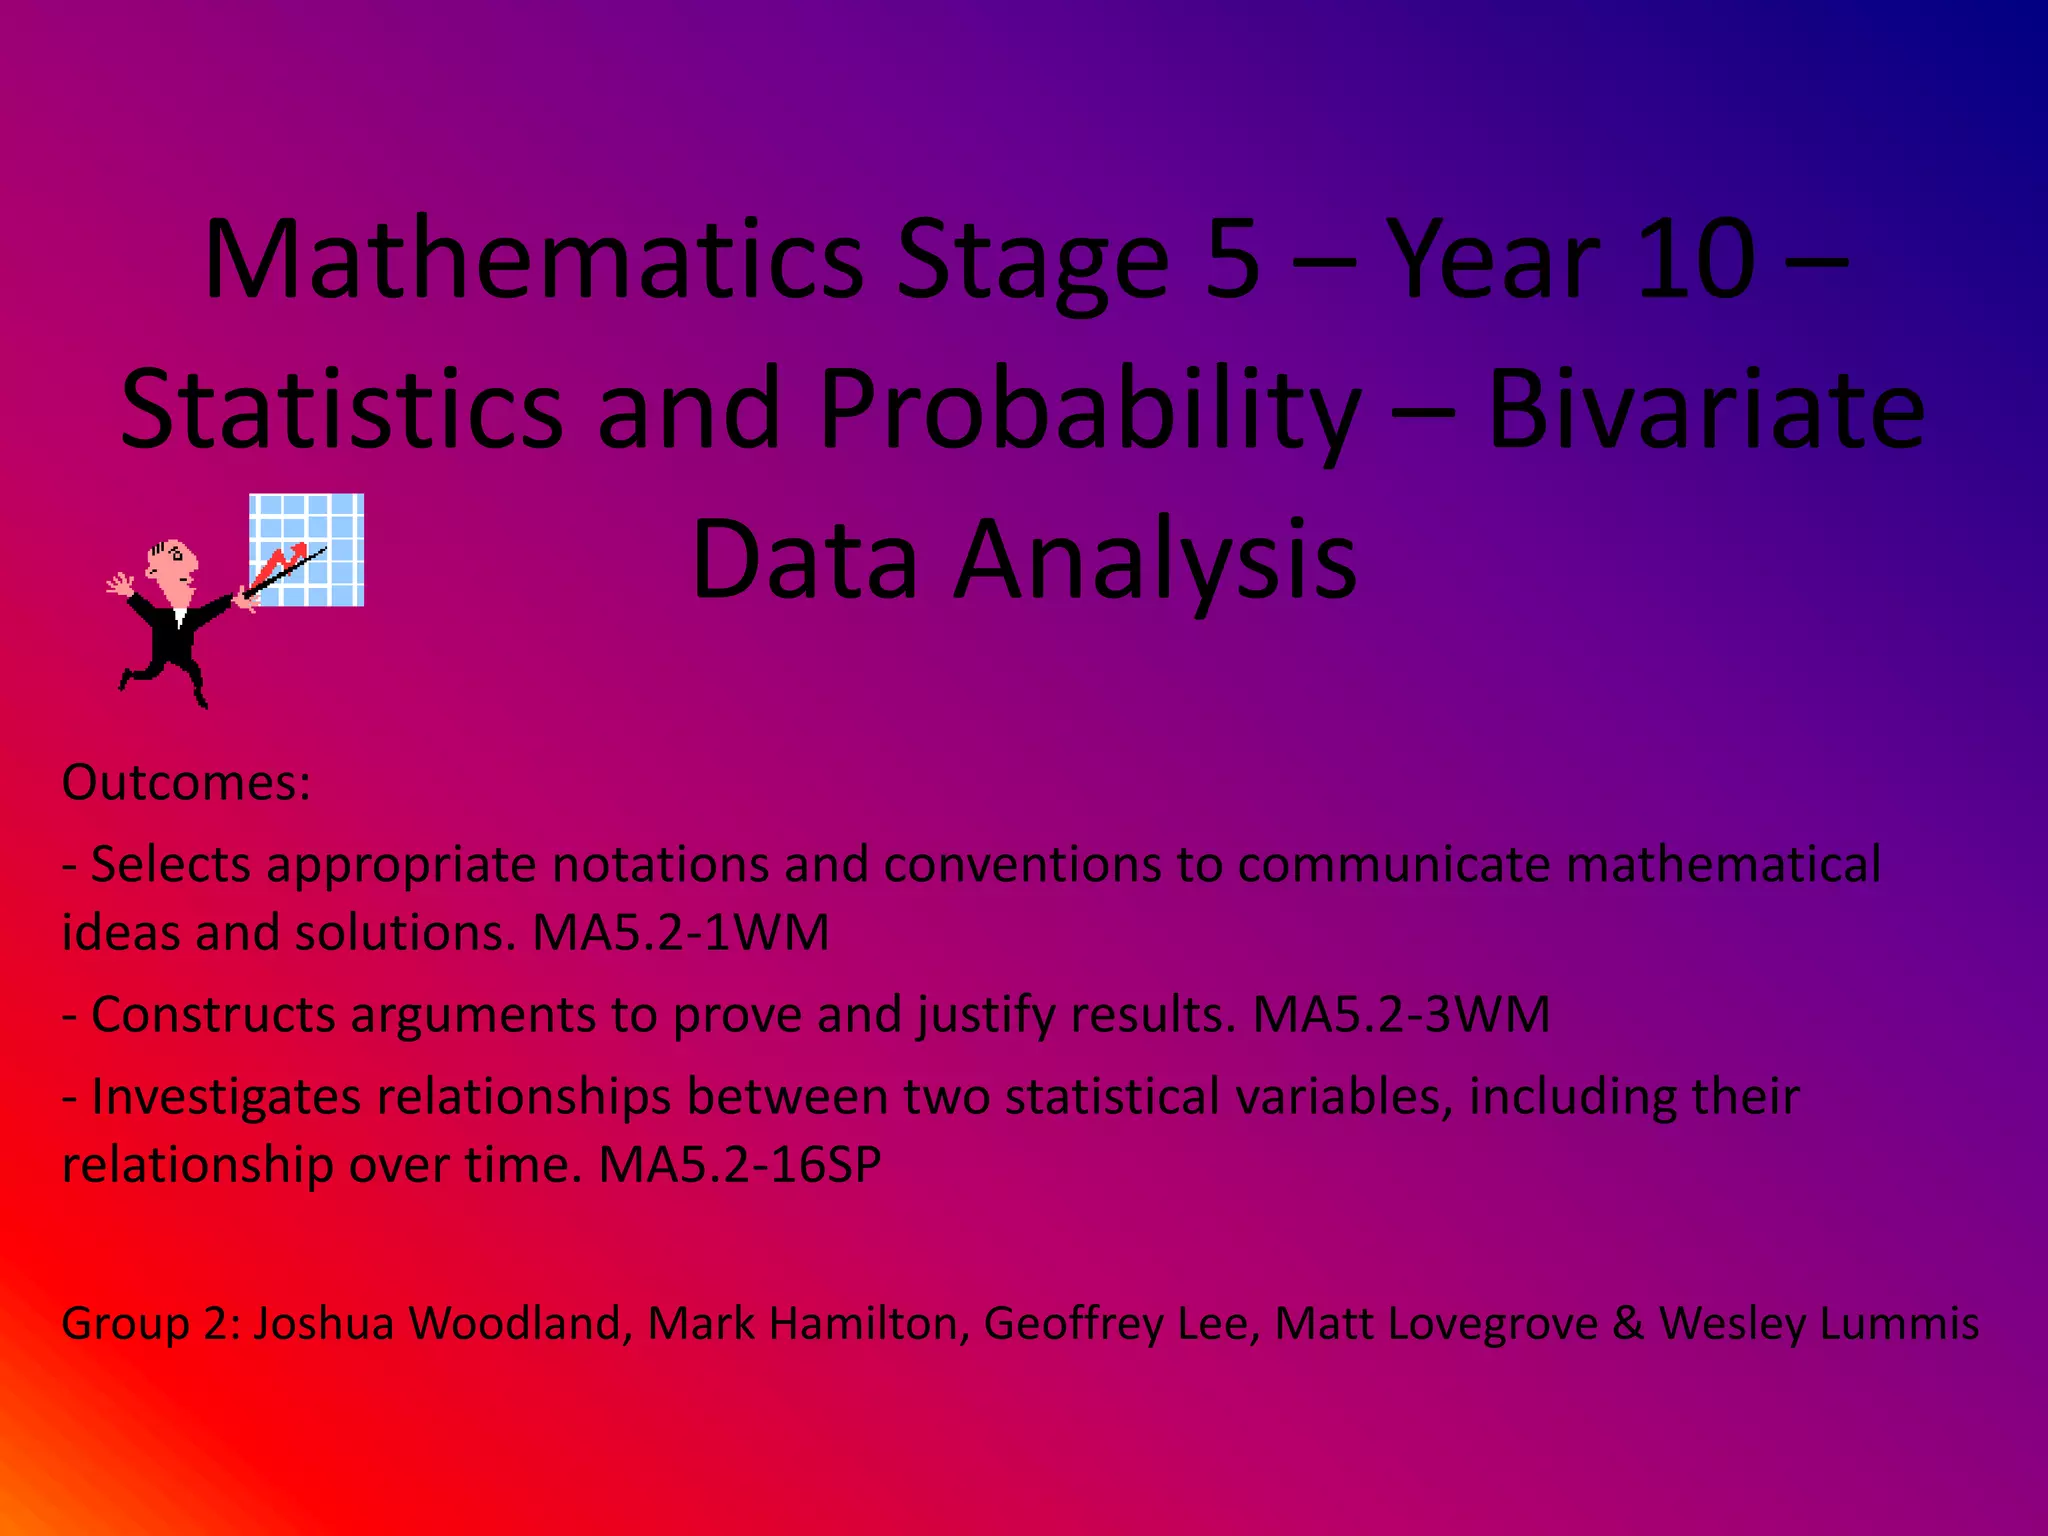
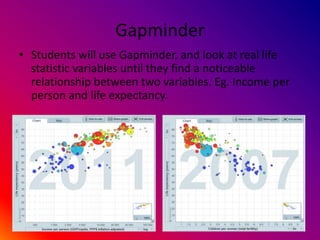

This document outlines an activity where students will use Gapminder to investigate relationships between two statistical variables over time. Students will find a noticeable relationship, discuss possible reasons for it, and conduct research to justify their proposed reasons. They will then create a Smart Notebook presentation with slides showing the relationship, their proposed reasons, and the results of their research. Finally, each group will report their findings and the relationship they determined was most noticeable and easily explained to the class.


