Back to Basics: Using GWAS to Drive Discovery for Complex Diseases

Genome-wide association studies (GWAS) have been providing valuable insight to the genetics of common and complex diseases for nearly 10 years. Despite some assertions to the contrary, GWAS is not dead. GWAS is alive and well, and remains a viable technology for genetic discovery. This webcast will cover: GWAS data formats, usability, and data management techniques. Imputation: Myths, facts, and when to use it. Quality assurance: What questions should you be asking about your data? Genotype association testing and statistics: Contingency tables, linear and logistic regression, Mixed Linear Models, and more. Visualizations including Manhattan Plots, linkage disequilibrium plots, and genomic annotation sources. Exploring public databases to investigate your results. Tips for using exome chips and other targeted genotyping platforms. Along the way, Dr. Christensen will highlight best practice approaches and common pitfalls to avoid. Golden Helix SNP & Variation Suite (SVS) software will be used to demonstrate many of these concepts.

Recommended
More Related Content
What's hot
What's hot (20)
Similar to Back to Basics: Using GWAS to Drive Discovery for Complex Diseases
Similar to Back to Basics: Using GWAS to Drive Discovery for Complex Diseases (20)
More from Golden Helix Inc
More from Golden Helix Inc (20)
Recently uploaded
Recently uploaded (20)
Back to Basics: Using GWAS to Drive Discovery for Complex Diseases
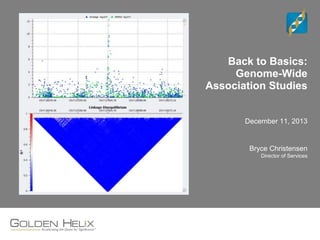
- 1. Back to Basics: Genome-Wide Association Studies December 11, 2013 Bryce Christensen Director of Services
- 2. Use the Questions pane in your GoToWebinar window Questions during the presentation
- 3. Golden Helix Leaders in Genetic Analytics Founded in 1998 Multi-disciplinary: computer science, bioinformatics, statistics, genetics Software and analytic services About Golden Helix
- 4. Core Features Packages Core Features Powerful Data Management Rich Visualizations Robust Statistics Flexible Easy-to-use Applications Genotype Analysis DNA sequence analysis CNV Analysis RNA-seq differential expression Family Based Association SNP & Variation Suite (SVS)
- 5. Approximate Agenda Association Testing Q&A 2 3 4 What about Imputation? GWAS QC Considerations1
- 6. Previous GWAS Webcasts Online
- 8. Genetic Epidemiology 34:591-602 (2010)
- 10. Autosomal MAF distribution on Affy 500k chip Most GWAS chips are designed to capture global variation Homogeneous cohorts will only be polymorphic for some subset of SNPs.
- 11. Autosomal MAF distribution for Illumina Omni-2.5 Higher-density chips have more rare content, so smaller relative proportion of SNPs will be polymorphic Diminishing returns with increased density
- 12. X Heterozygosity Variability by Chip Chip design can affect distribution of many statistics, including X heterozygosity Targeted chips may have minimal polymorphic content on X Adjust workflows accordingly - Ex: Filter on MAF before running gender inference
- 13. Why Care about Chip Design and Content? Many sample statistics are based on allele frequencies, and behave differently from chip to chip - IBD testing - Principal Components - Autosomal heterozygosity rates - Runs of homozygosity Many of those statistics also assume that you are using a “GWAS” chip with uniform coverage, and may be confounded when using chips with targeted or non-uniform coverage content - Exome chips - ImmunoChip - Cardio-MetaboChip Adjust workflows accordingly! - Use different MAF thresholds with targeted chips - Filter to polymorphic SNPs and prune for LD before running IBD or PCA
- 14. [Demonstration]
- 15. Original Slides by Greta Linse Peterson, Senior Statistician Mixed Models: How to Effectively Account for Inbreeding and Population Structure in GWAS
- 16. A brief background of GWAS First the naïve approaches: Trend Tests, Contingency Tables, Linear/Logistic Regression Batch Effects, Population Structure and sharing of controls may violate assumptions of the naïve approaches and result in confounding of results. Stratification effects are more pronounced with larger sample sizes. Non-independence of samples is especially problematic in agrigenomic applications.
- 17. The Real Problem Vilhjalmsson and Nordborg (2013) argue that “population structure” itself is not a problem for GWAS. The real problems are the environment and the genetic background of a population. - PCA can serve as a proxy for both, but doesn’t entirely explain either. The solution is to account for the relatedness between all pairs of samples in a mixed linear model.
- 18. Mixed Model Method Overview Calculate kinship matrix defining pairwise relationships between all sample pairs. Include kinship matrix as random effect in MLM regression. May also include PCs and other factors as fixed effects. Allows for population-based and family-based cohorts to be analyzed together.
- 19. Applied Example: WTCCC-2 Multiple Sclerosis About 10k cases and 17k controls from world-wide Caucasian populations Naïve GWAS: λ=2.48 PCA adjusted: λ=1.21 Stratified analysis in ancestry- matched subgroups, with results combined in meta analysis: λ=1.44 MLM approach: λ=1.04!
- 20. Methods Implemented in SVS Regression with PCA Correction - Accounts for the relationship between samples with Principal Components - Need to know how many components to correct for EMMAX - Adjusts for the pair-wise relationship between all samples using a kinship matrix - Approximates the variance components and uses the same variance for all probes - Tests a single locus at a time MLMM - Adjusts for the pair-wise relationship between all samples using a kinship matrix - Approximates the variance components and uses the same variance for all probes, but re- computes at every step - Stepwise EMMAX, assumes multiple loci are associated with the phenotype GBLUP - Adjusts for the pair-wise relationship between all samples using a kinship matrix - Computes allele substitution effects to determine best genomic predictors of the phenotype
- 21. [Demonstration]
- 22. Standard GWAS is based on tag-SNPs We typically test for the relationship between A and C, assuming that B probably won’t be on the array. BUT: Correlation is not transitive. - If A is correlated with B, and B with C, A is not necessarily correlated with C. Is that a problem? What does it mean for imputation? A. Observed GWAS SNP B. Untyped Causal SNP C. Disease Outcome
- 23. Imputation Implications A. Observed GWAS SNP B. Untyped Causal SNP D. Additional GWAS SNPs in LD with B. Imputation accuracy is usually improved when several GWAS SNPs contribute to the imputed genotype of a given variant. Testing disease association with accurately imputed variants is the best available alternative to sequencing, and much cheaper. As always: Carefully follow up on any significant results!
- 24. Imputation: What to Watch For Accuracy metrics from imputation software Always look for inter-cohort differences Example: Beagle’s Allelic R2 stat. Look at the allelic dosage histograms:
- 25. Imputation: What to Watch For Imputed allele frequencies different from reference panel frequencies - Especially when common alleles are imputed with 0 frequency. Watch for inter-cohort differences.
- 26. rs429358 Significant But Not Assayed By 500k Not on 500k array Would 1000 Genomes imputation have found it?
- 27. Alzheimer’s 1kG Imputation Results Page 32
- 28. Genotype Imputation: Why? Fill in the blanks—improve SNP call rate in GWAS - This is where imputation started Increase density of genotype calls - Define and/or refine the search space for identifying candidate causal variants around GWAS signals Harmonize different array platforms for mega-analysis or meta-analysis - Additional power to be gained from increased sample sizes - Very common in disease consortia Identify new associations not observed in GWAS? - Rare, but possible to identify a new locus - Remember: our reference panels are usually made up of healthy people…
- 29. SVS and Imputation SVS does not have an imputation algorithm Add-on functions available to read and write file formats used by Beagle, MACH/Minimac and Impute2. SVS supports analysis of imputed genotypes, including allelic dosage formats
- 30. Review GWAS is not dead Golden Helix SVS is a powerful platform for GWAS analysis - Data management - Quality Assurance - Visualization - Association Testing - LD & Haplotype Analysis New analysis methods like mixed model regression continue to improve GWAS quality Imputation is very powerful, but has limitations Look for new GWAS features in SVS 8.1!
- 31. Questions or more info: Email info@goldenhelix.com Request an evaluation of the software at www.goldenhelix.com Check out our abstract competition!
- 32. Questions? Use the Questions pane in your GoToWebinar window