Download to read offline
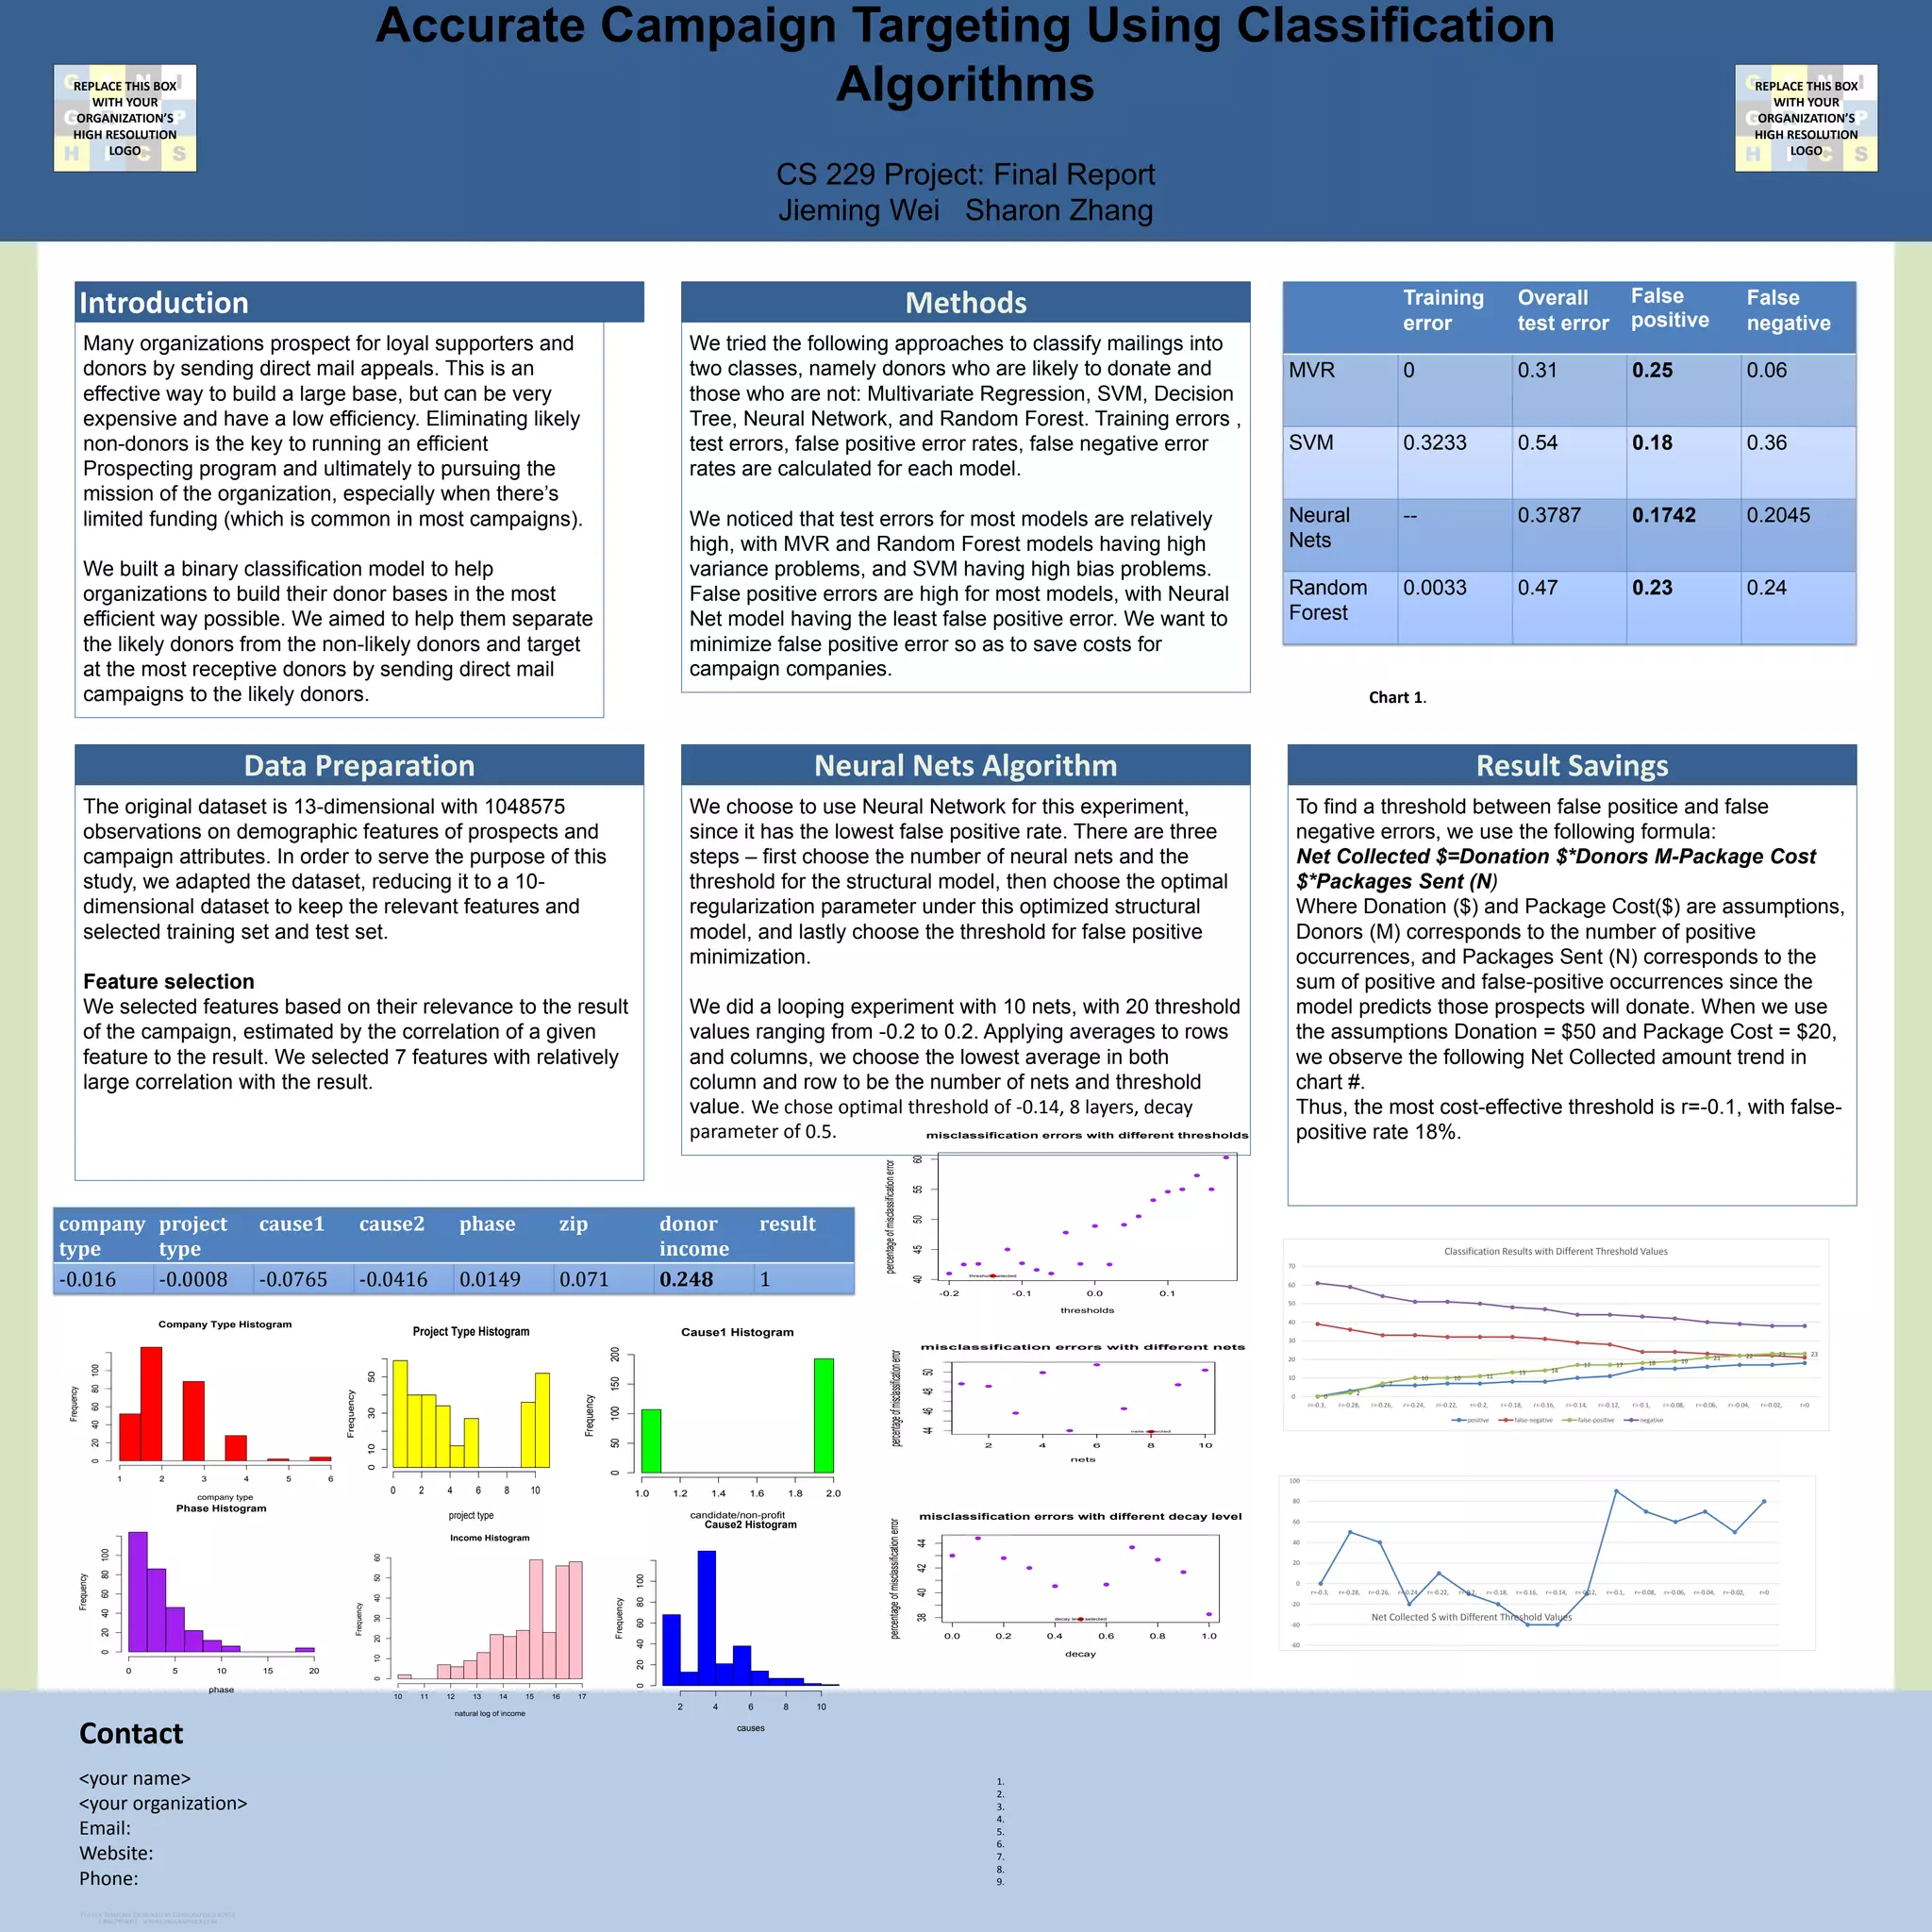

This document summarizes research on using machine learning algorithms to classify potential donors for fundraising campaigns. The researchers built a binary classification model using neural networks to identify likely donors. They found that a neural network approach had the lowest false positive rate compared to other models. Testing different thresholds, they determined that a threshold of -0.1 achieved the most cost-effective balance between identifying donors and minimizing mailing costs.