


![Three
methods
26
Train one model for E[Yi
(treatment)|Xi
] and another for E[Yi
(control)|Xi
]
Well known implementation: CausalLift
Treatment
Control
Model B
E[Yi
(treatment)|Xi
]
Model A
E[Yi
(treatment)|Xi
]
Uplift:
Model A - Model B
* to score individuals going forward, take Δ of models
Experiment](https://image.slidesharecdn.com/1205hamed-191205144421/75/Uplift-Modelling-as-a-Tool-for-Making-Causal-Inferences-at-Shopify-Mojan-Hamed-26-2048.jpg)

![[1] Real-World Uplift Modelling with Significance-Based Uplift Trees,
[2] Causal Inference and Uplift Modeling,
[3] Uplift Modeling in Direct Marketing,
[4] Decision trees for uplift modeling with single and multiple treatments,
[1] Pylift,
[2] CausalLift,
42](https://image.slidesharecdn.com/1205hamed-191205144421/75/Uplift-Modelling-as-a-Tool-for-Making-Causal-Inferences-at-Shopify-Mojan-Hamed-42-2048.jpg)


The document presents a talk by Mojan Hamed on uplift modeling, which focuses on identifying individuals whose behavior can be positively influenced through targeted marketing efforts. It details methodologies for estimating the causal effect of treatments on individuals and discusses various approaches for modeling, including the use of decision trees and binary outcomes. The aim is to improve marketing effectiveness by tailoring strategies to those most likely to respond incrementally to campaigns.
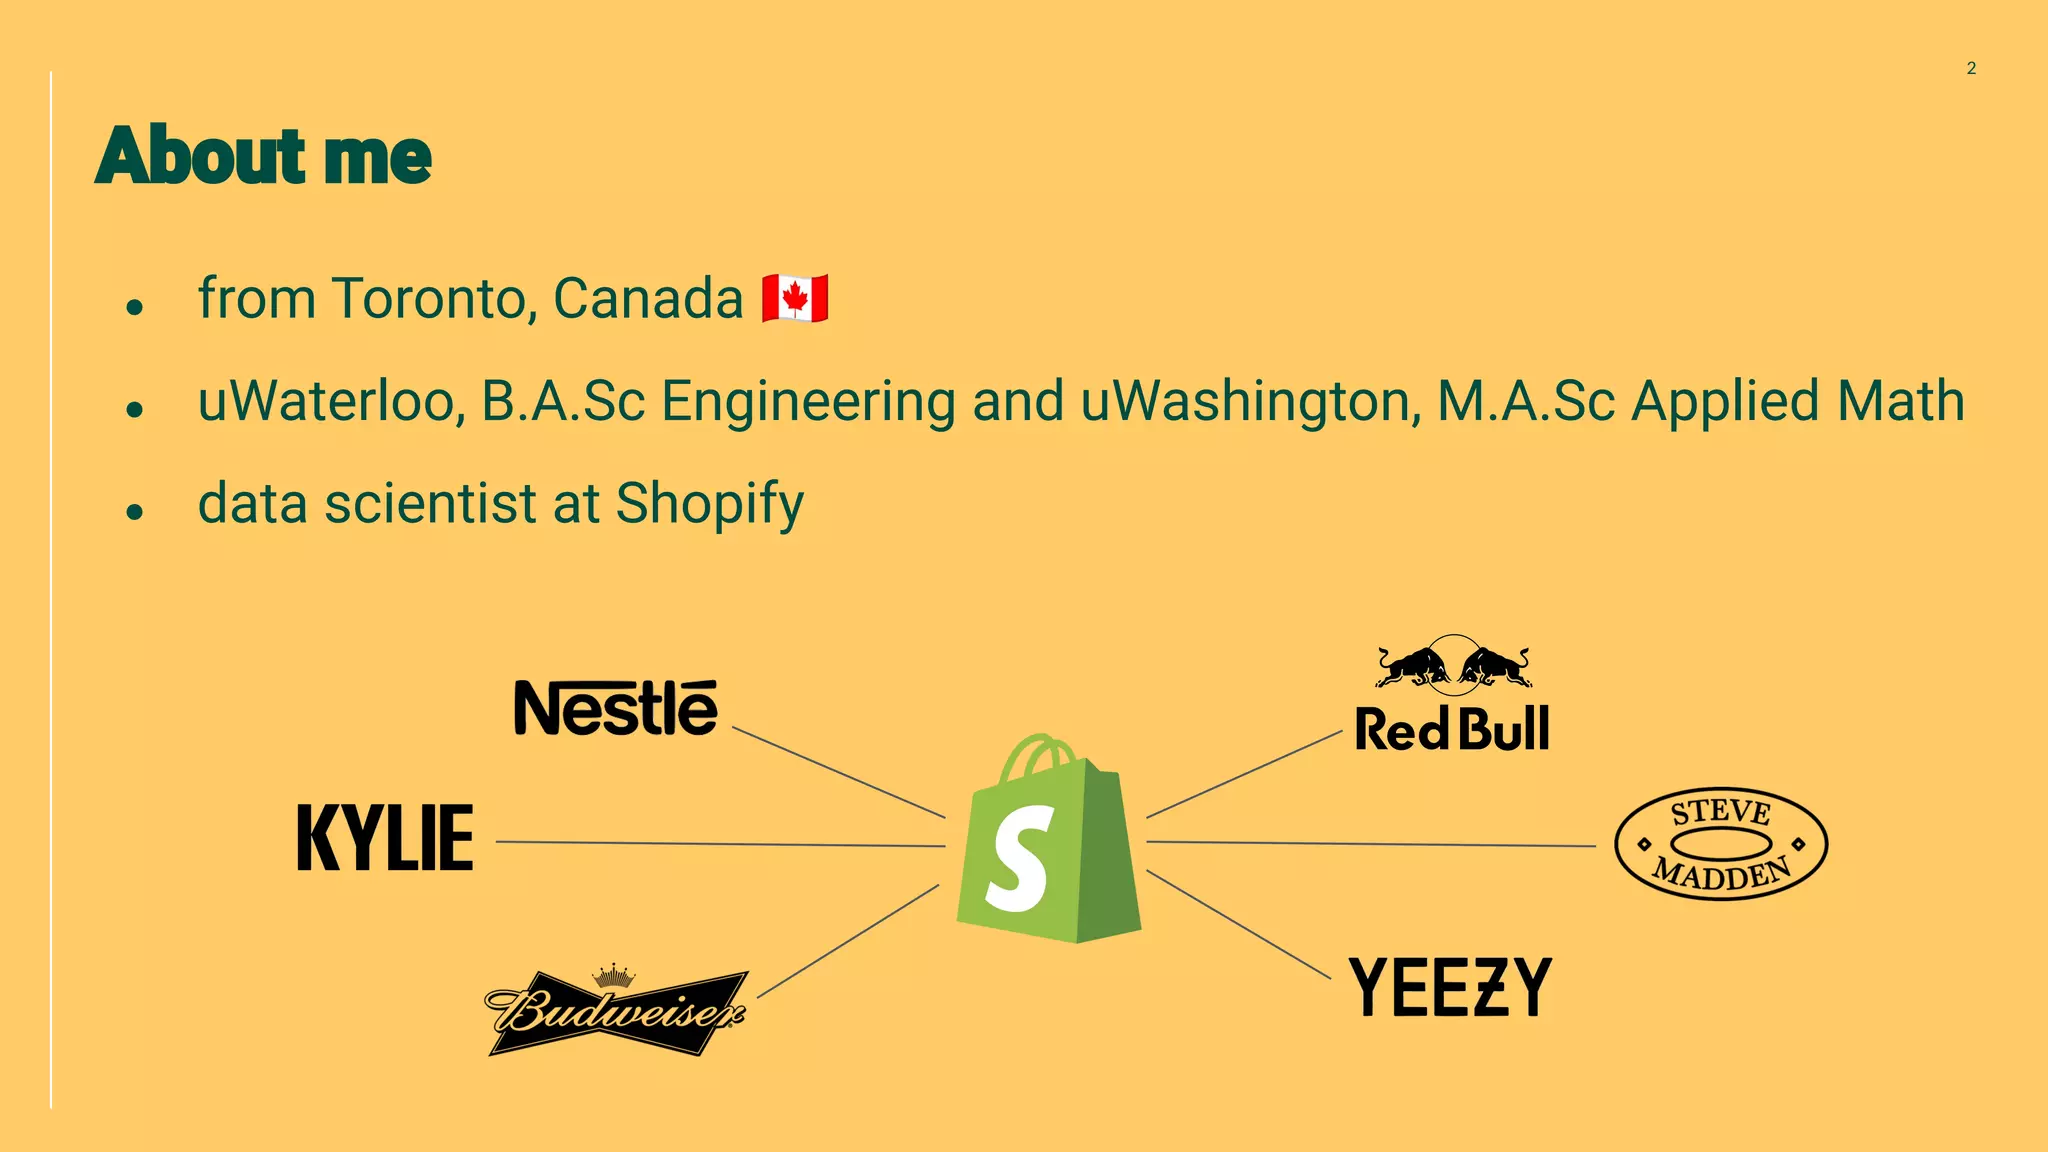
Introduction of Mojan Hamed, location and educational background as a Data Scientist.
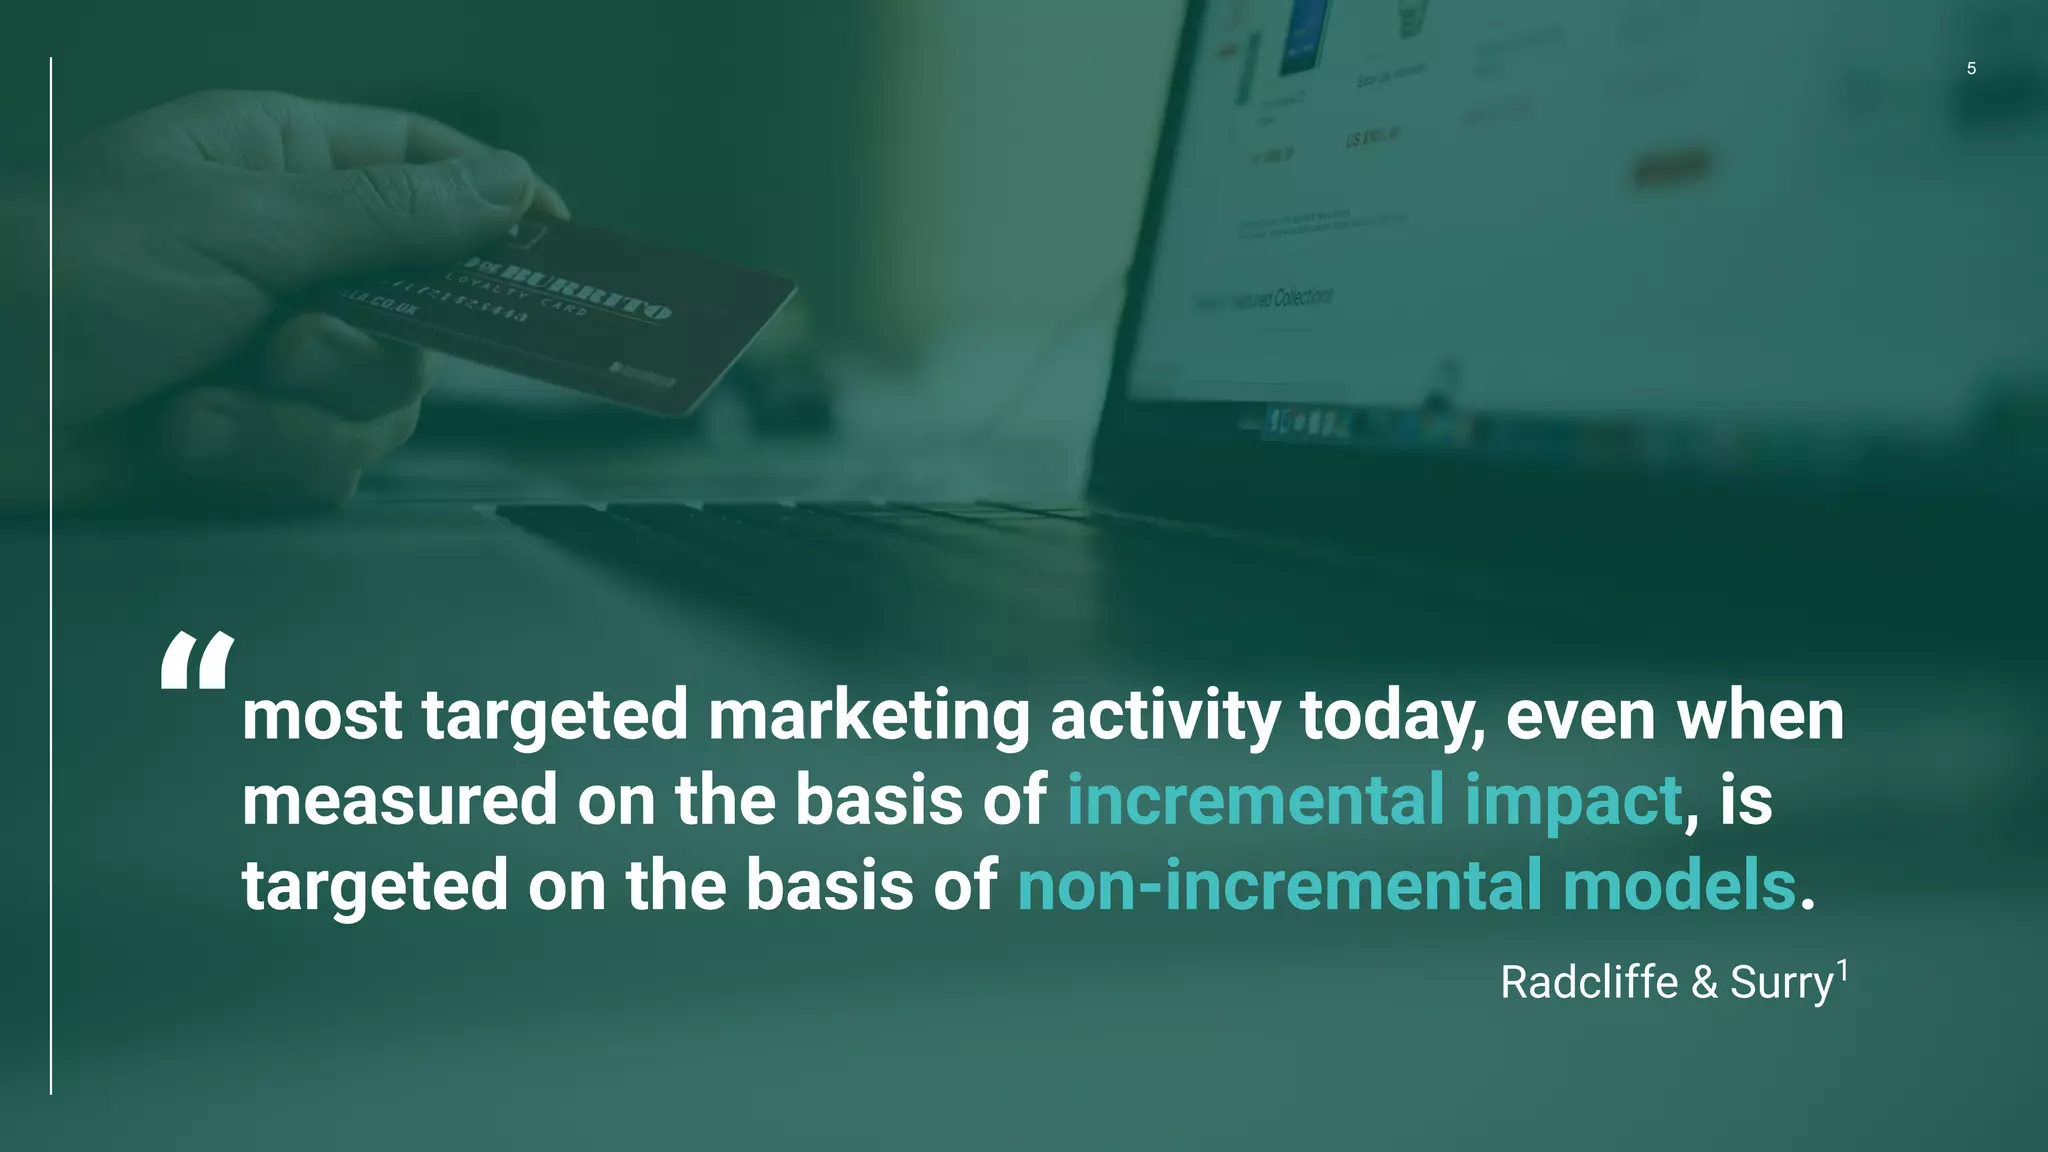
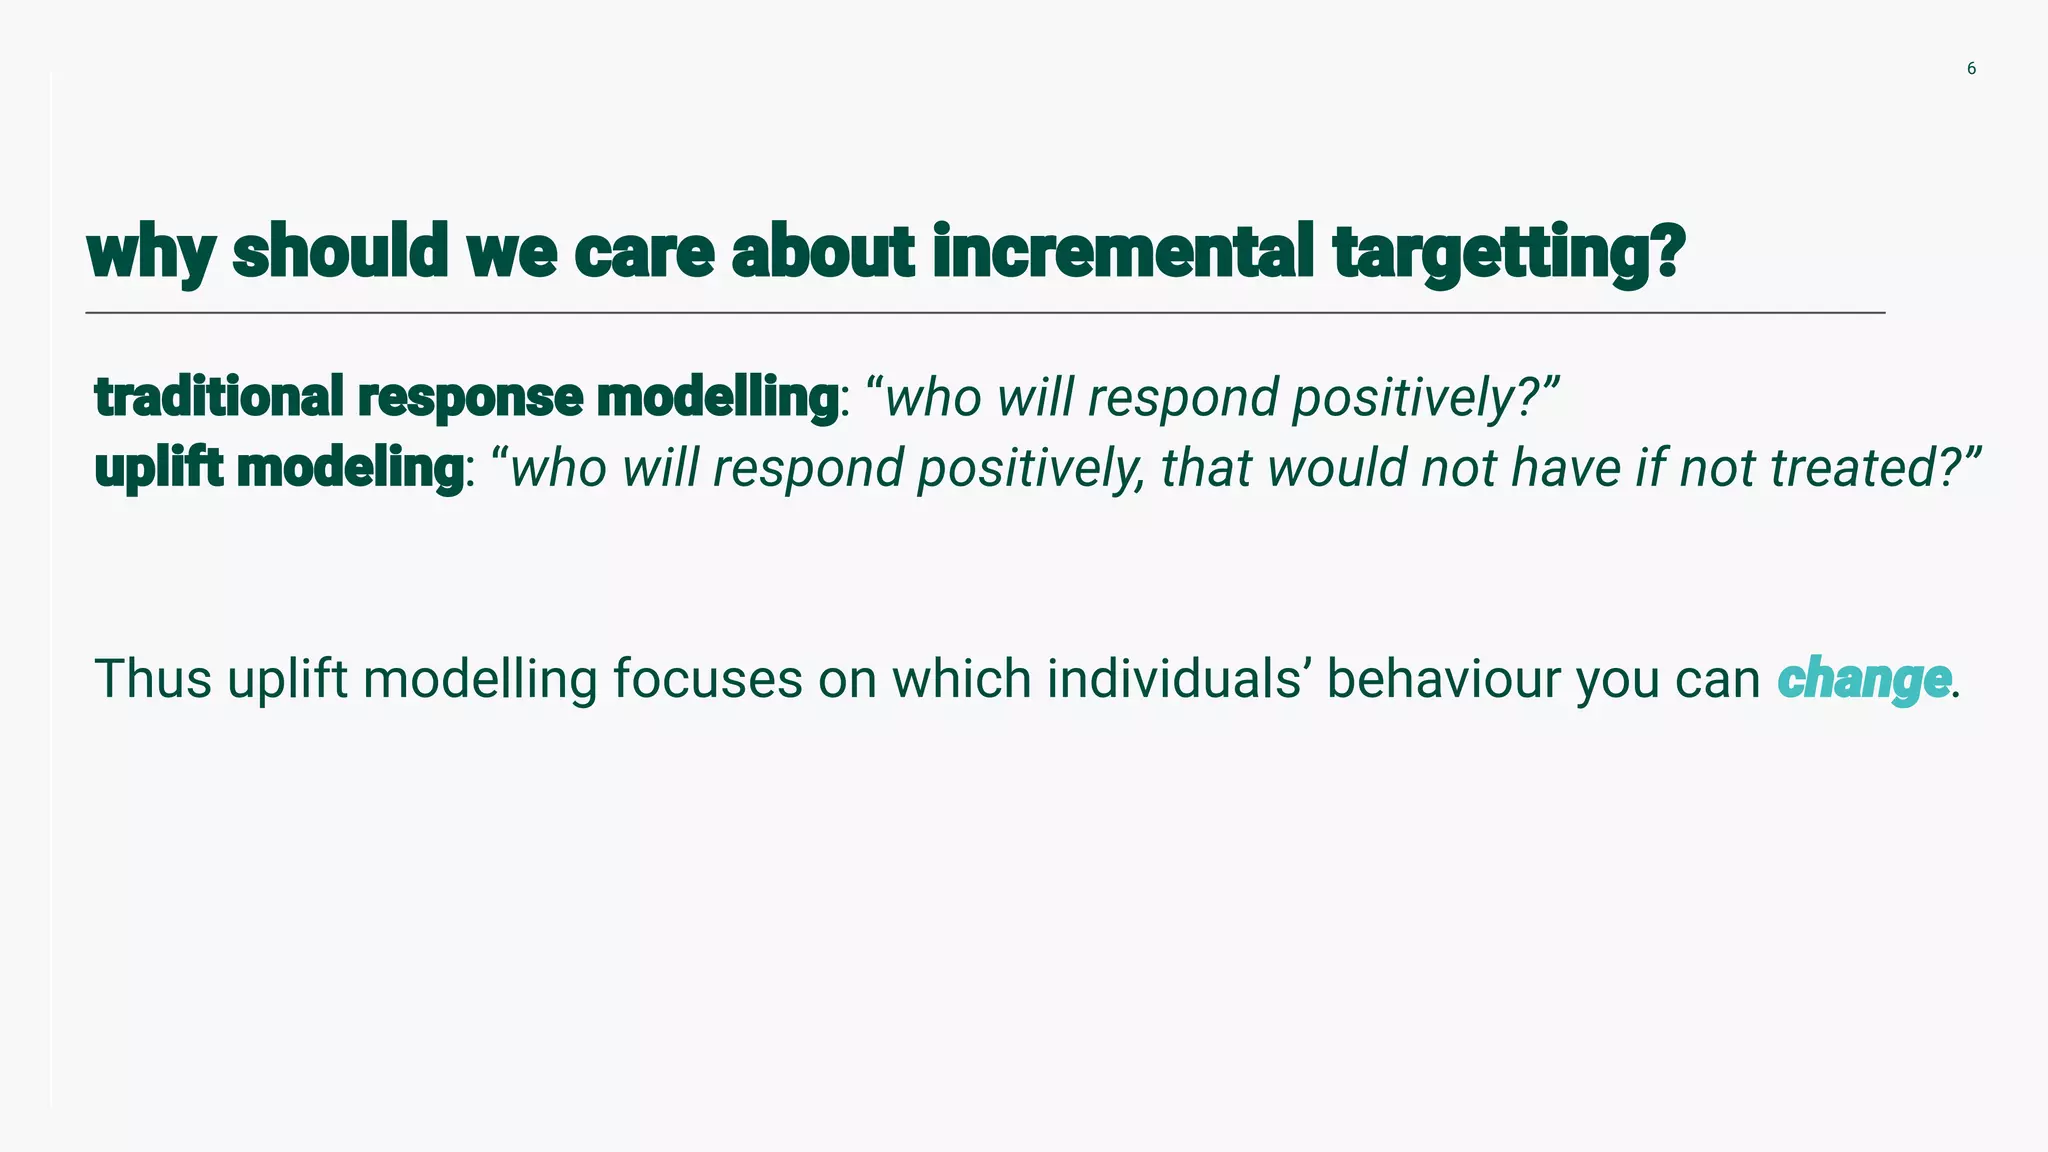
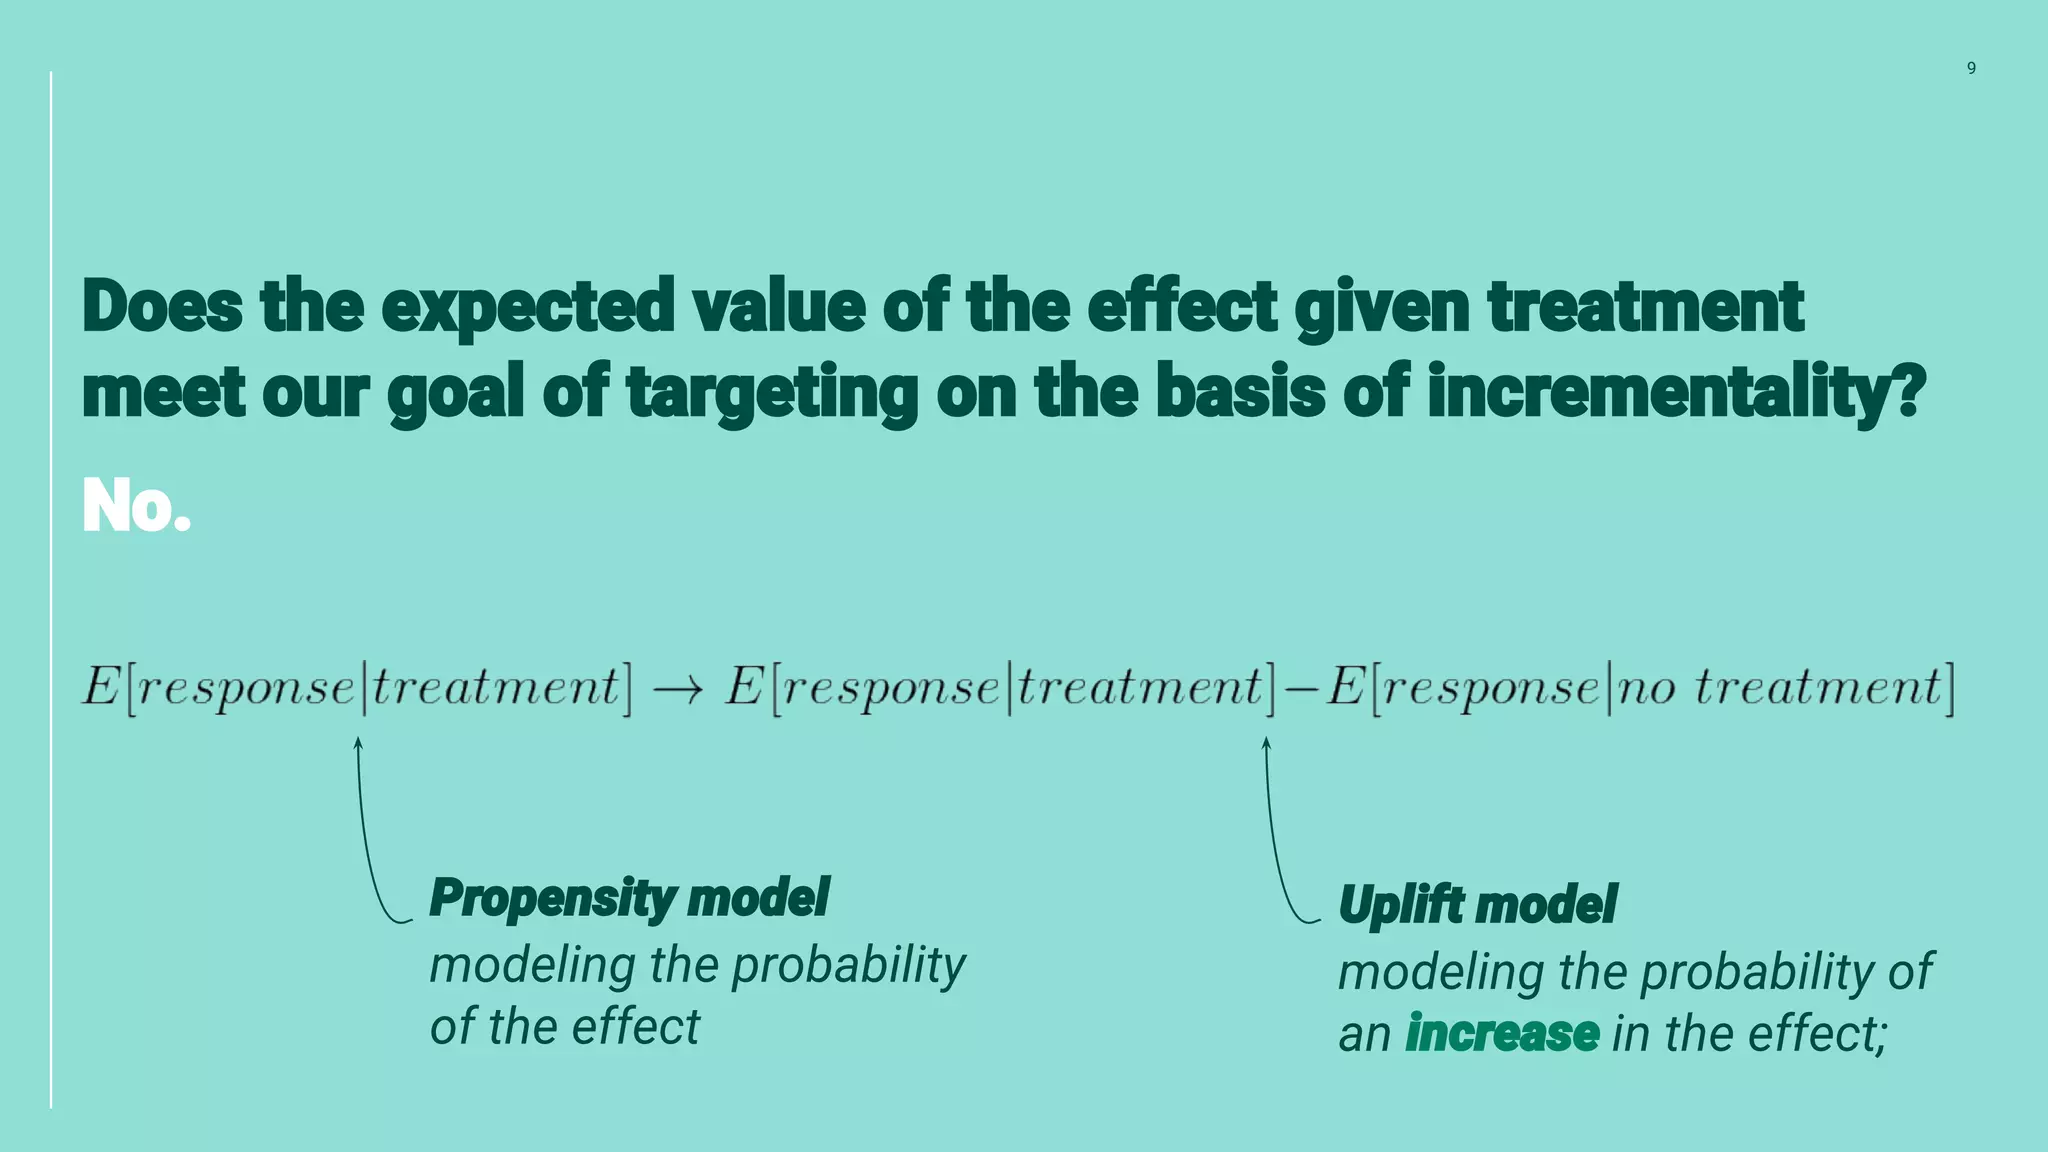
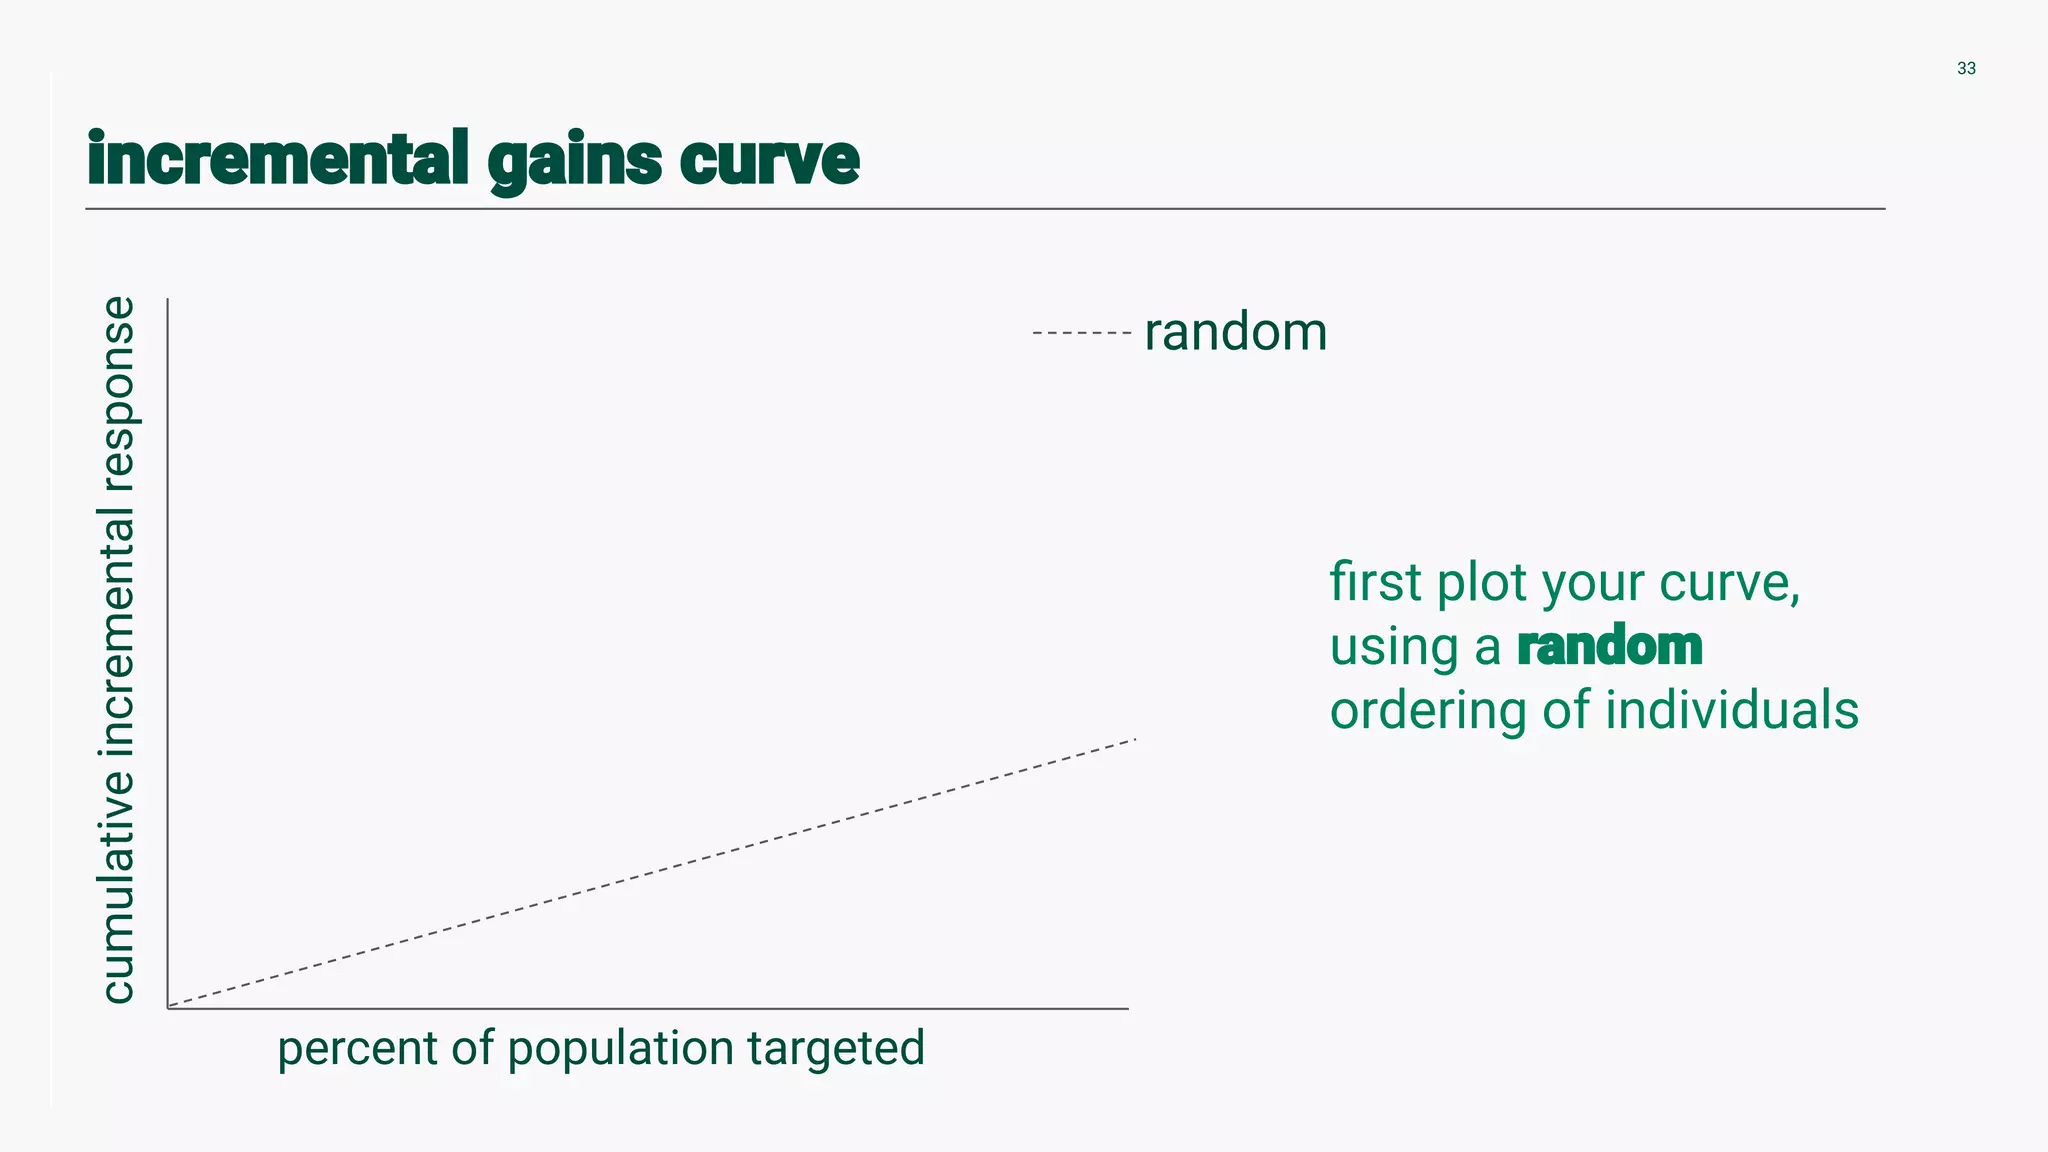
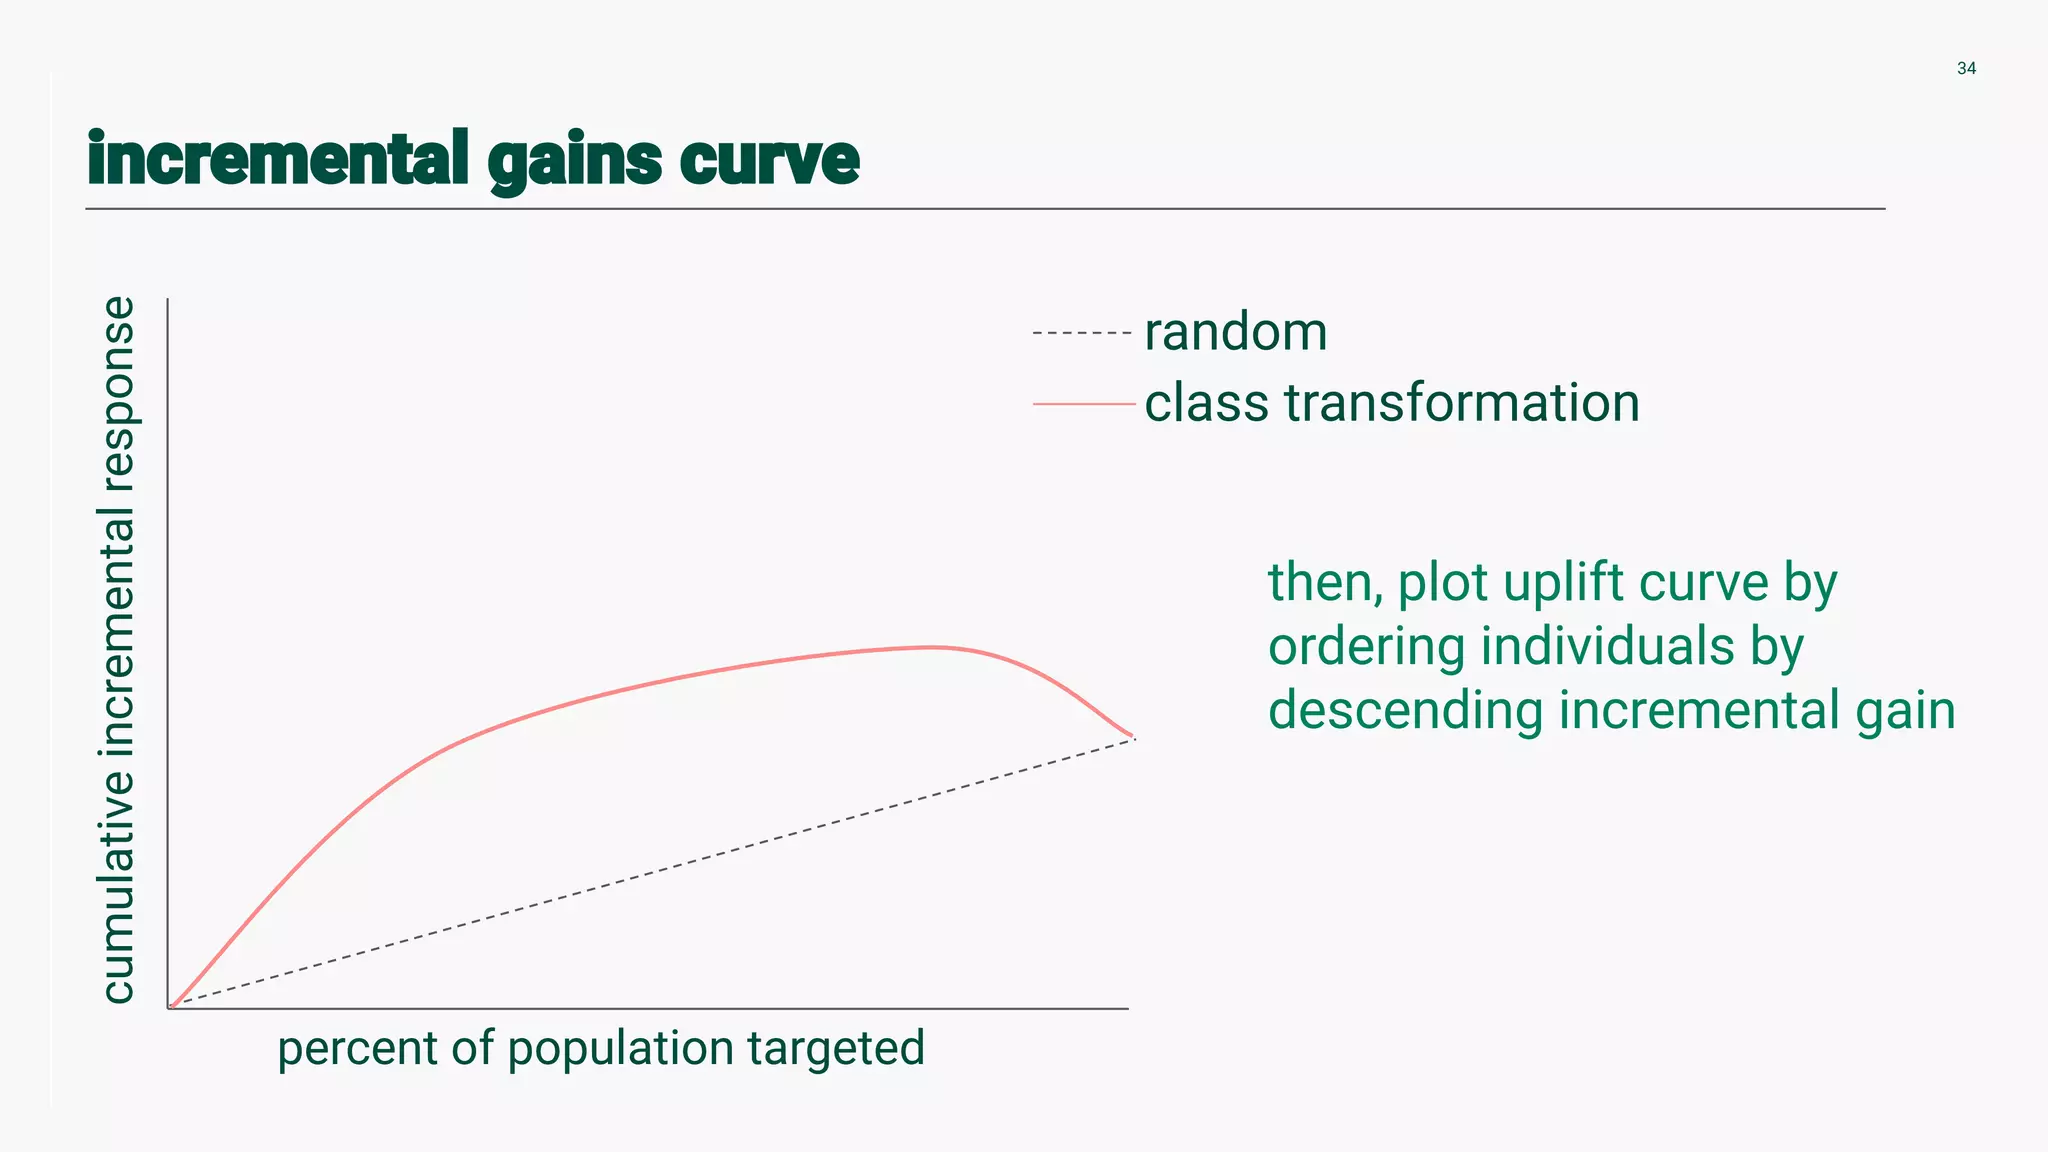
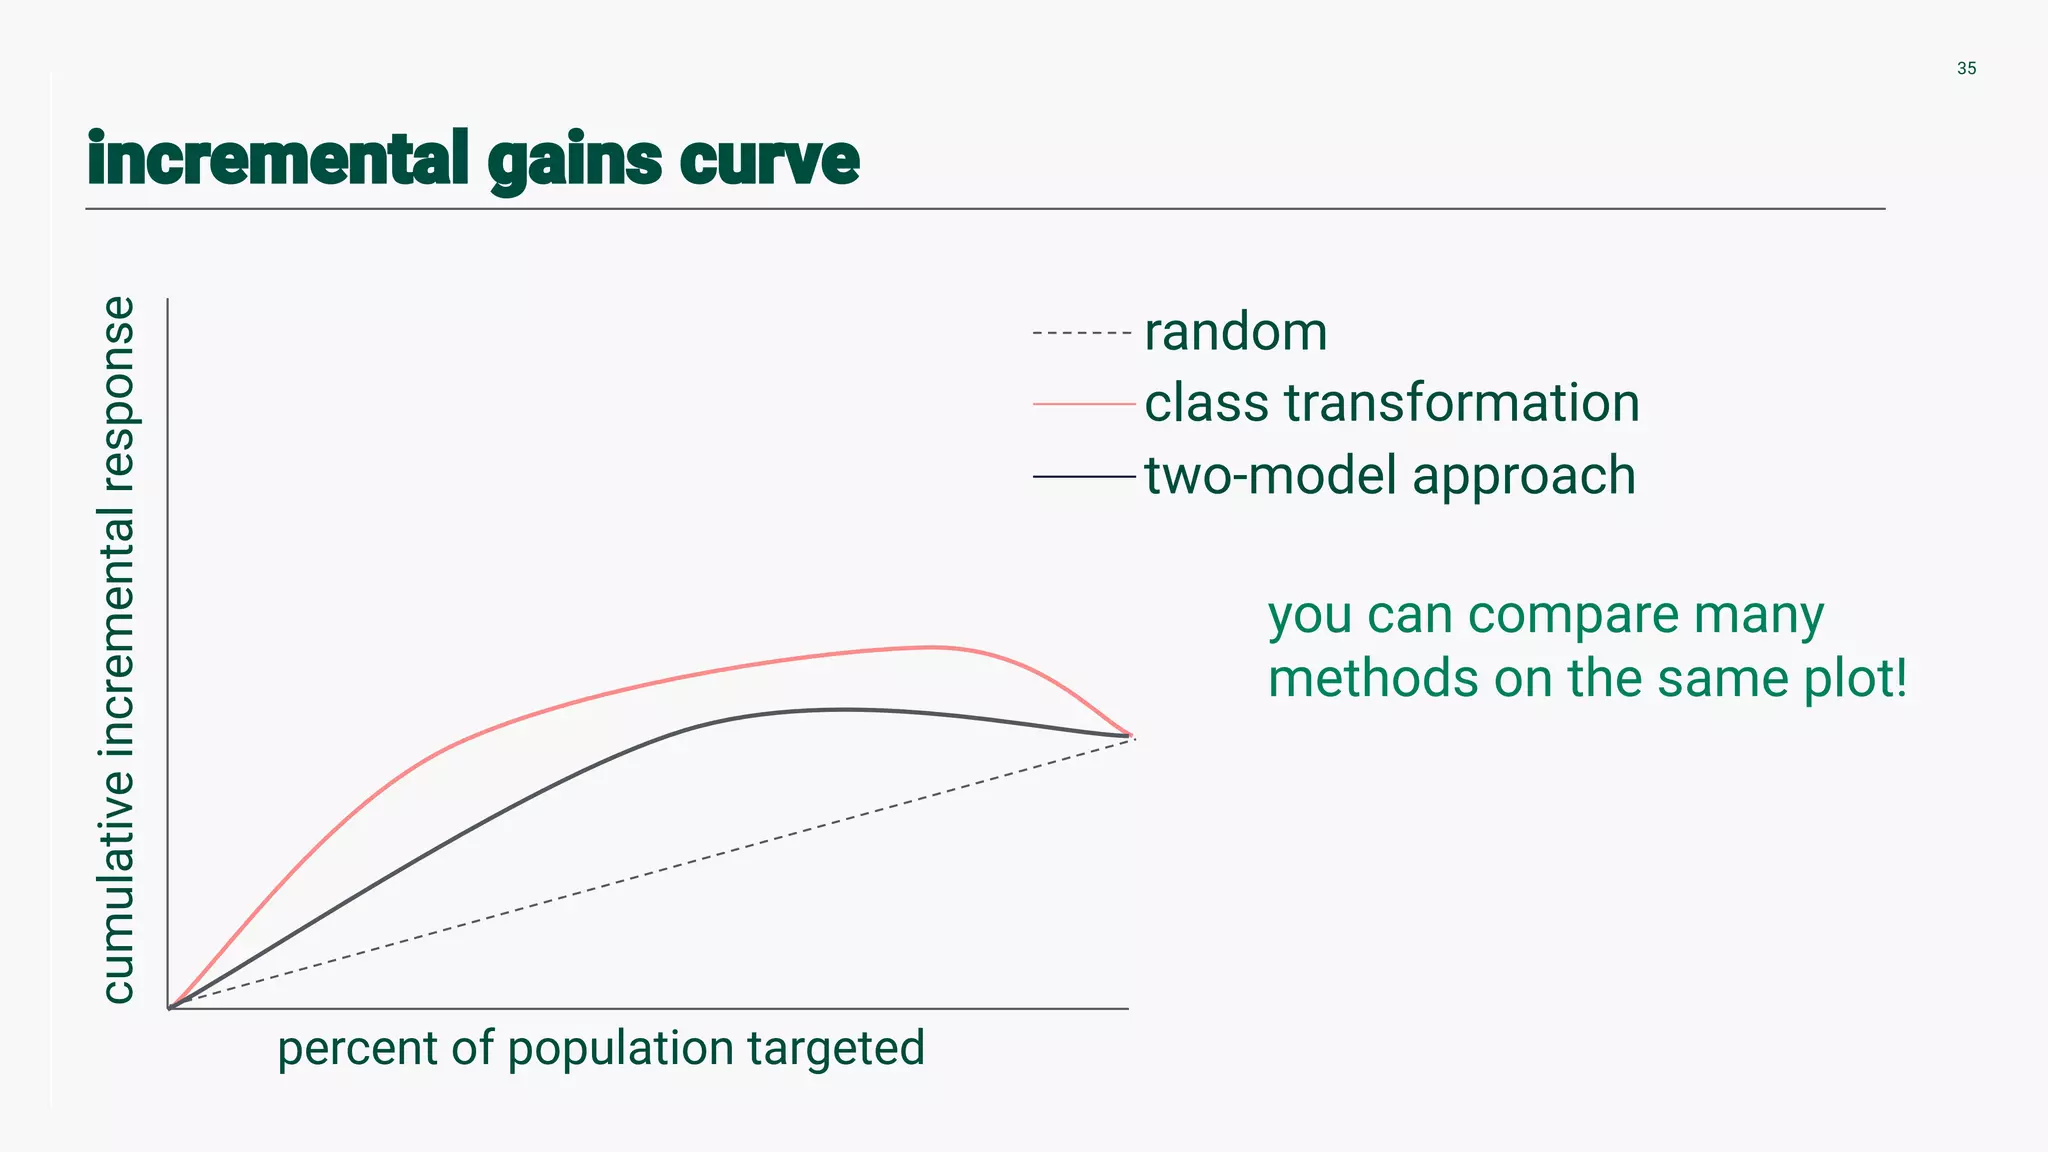
Discusses the essence of uplift modeling, focusing on measuring incremental impact and distinguishing response modes.
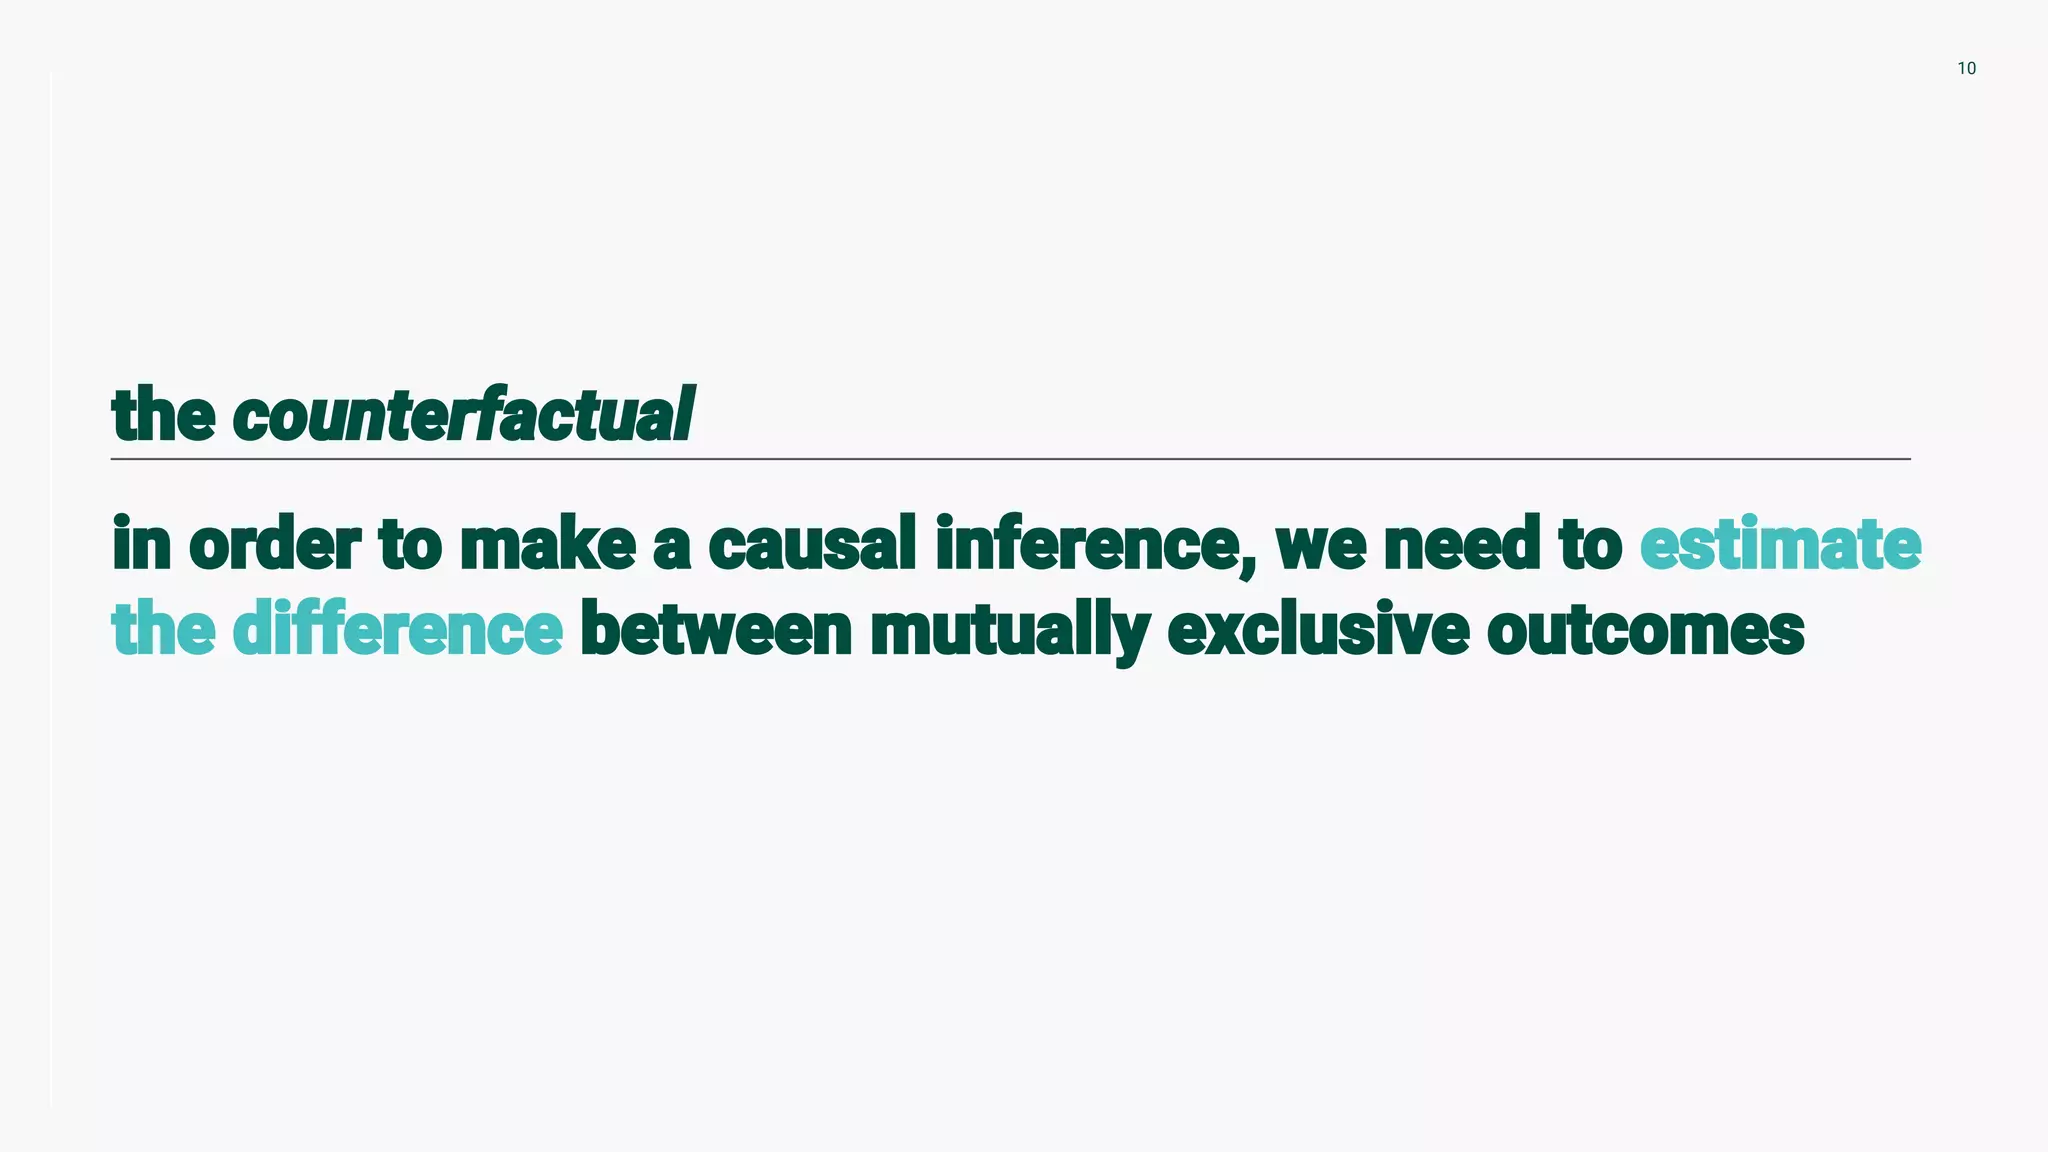
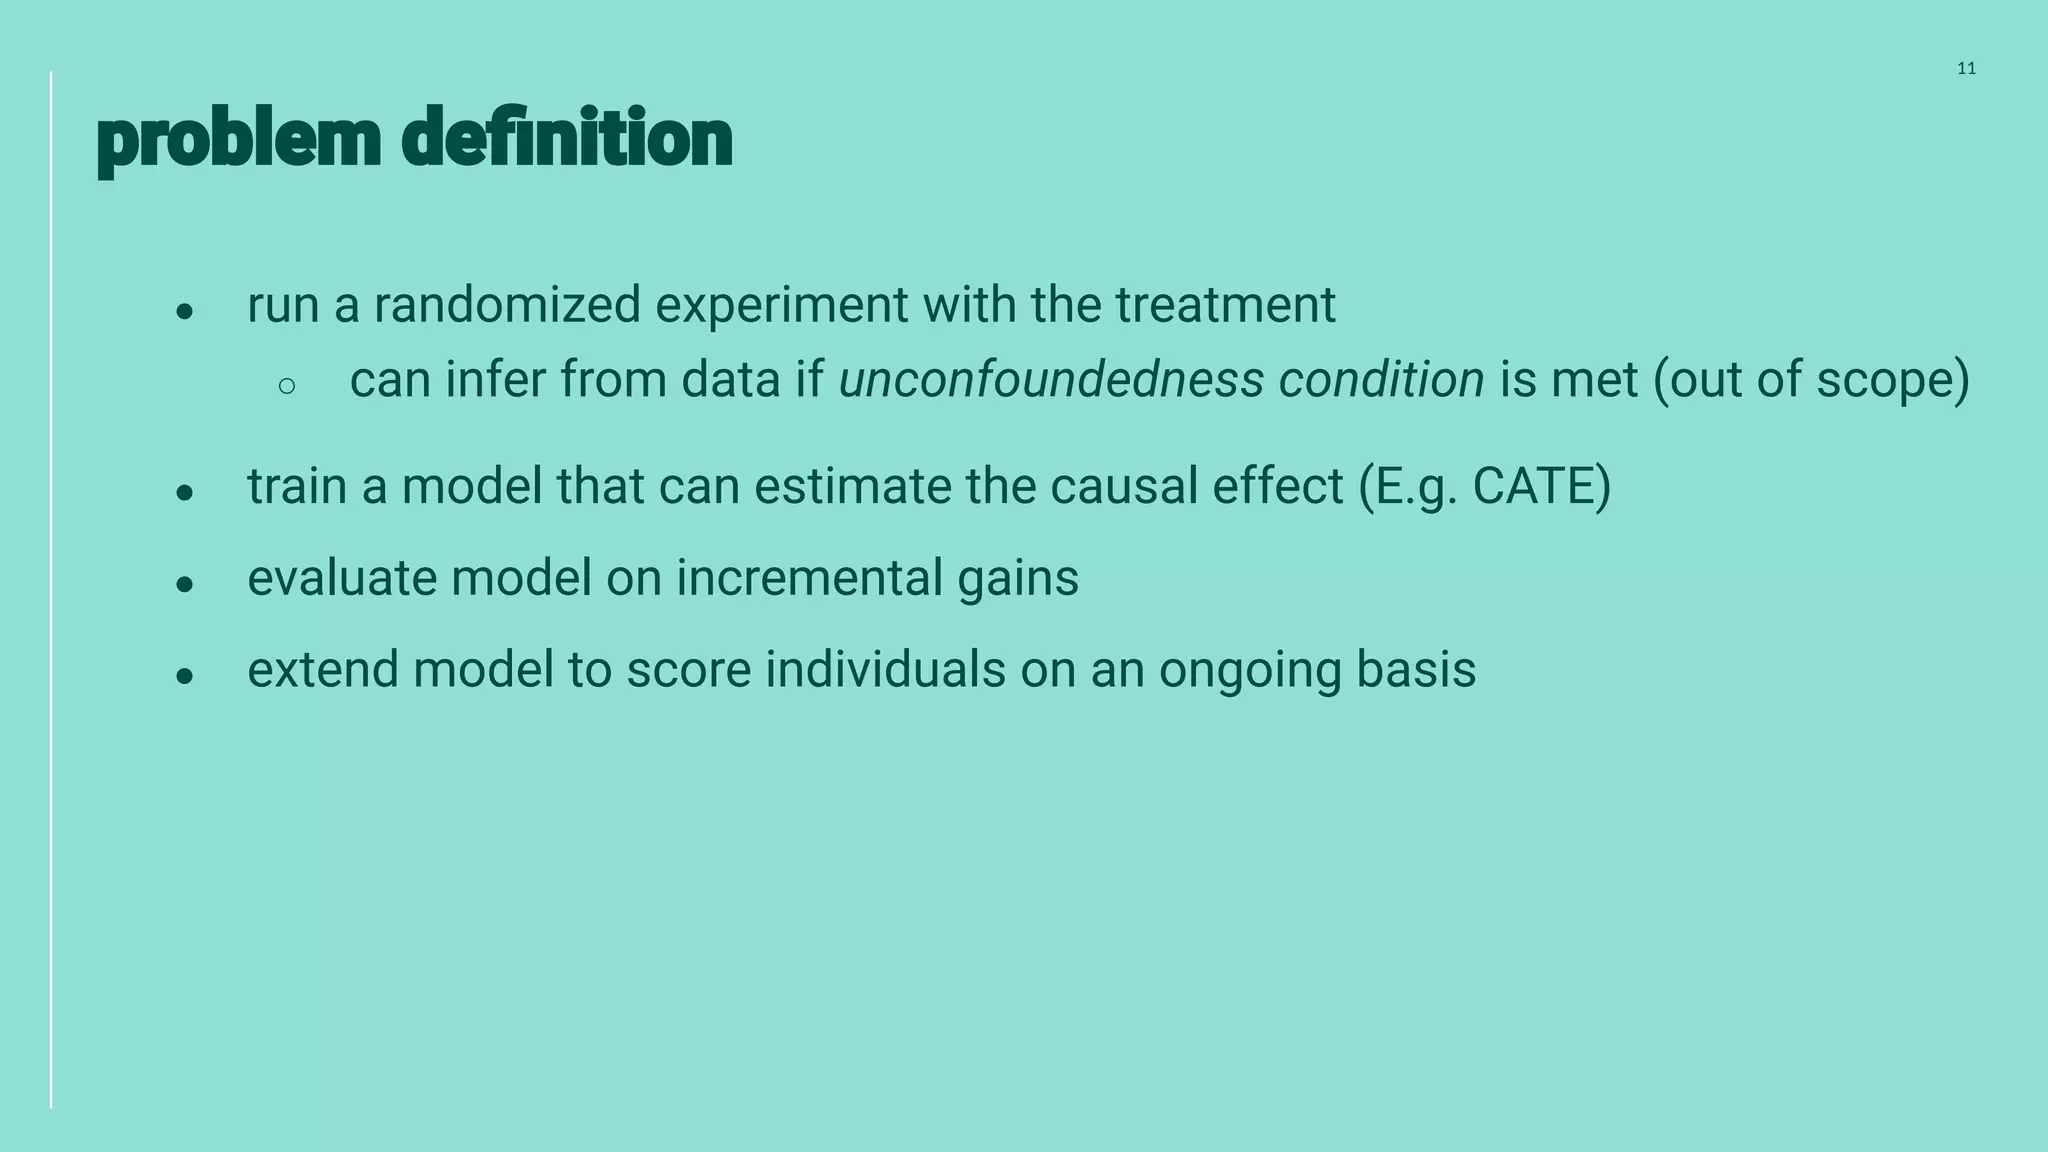
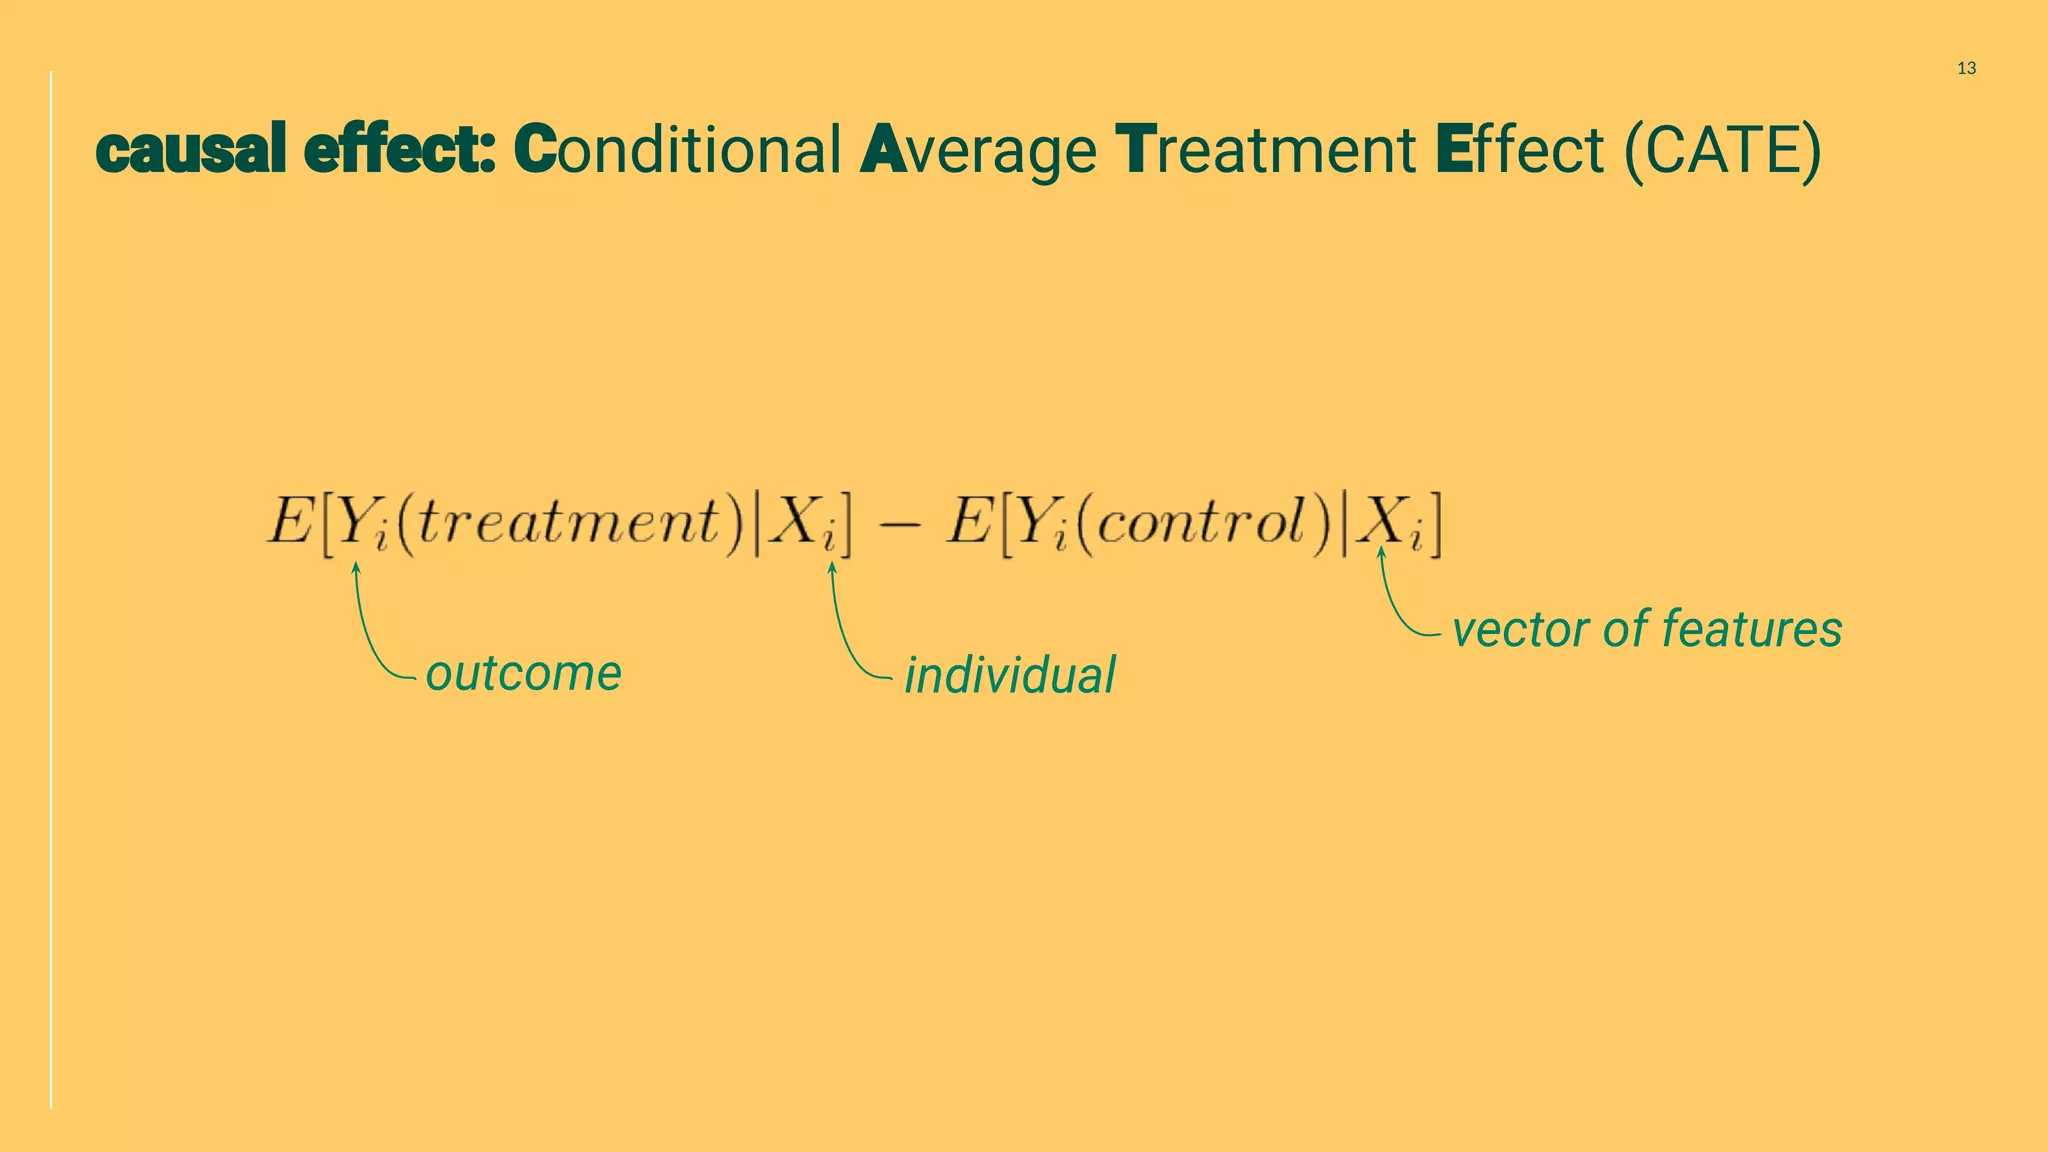
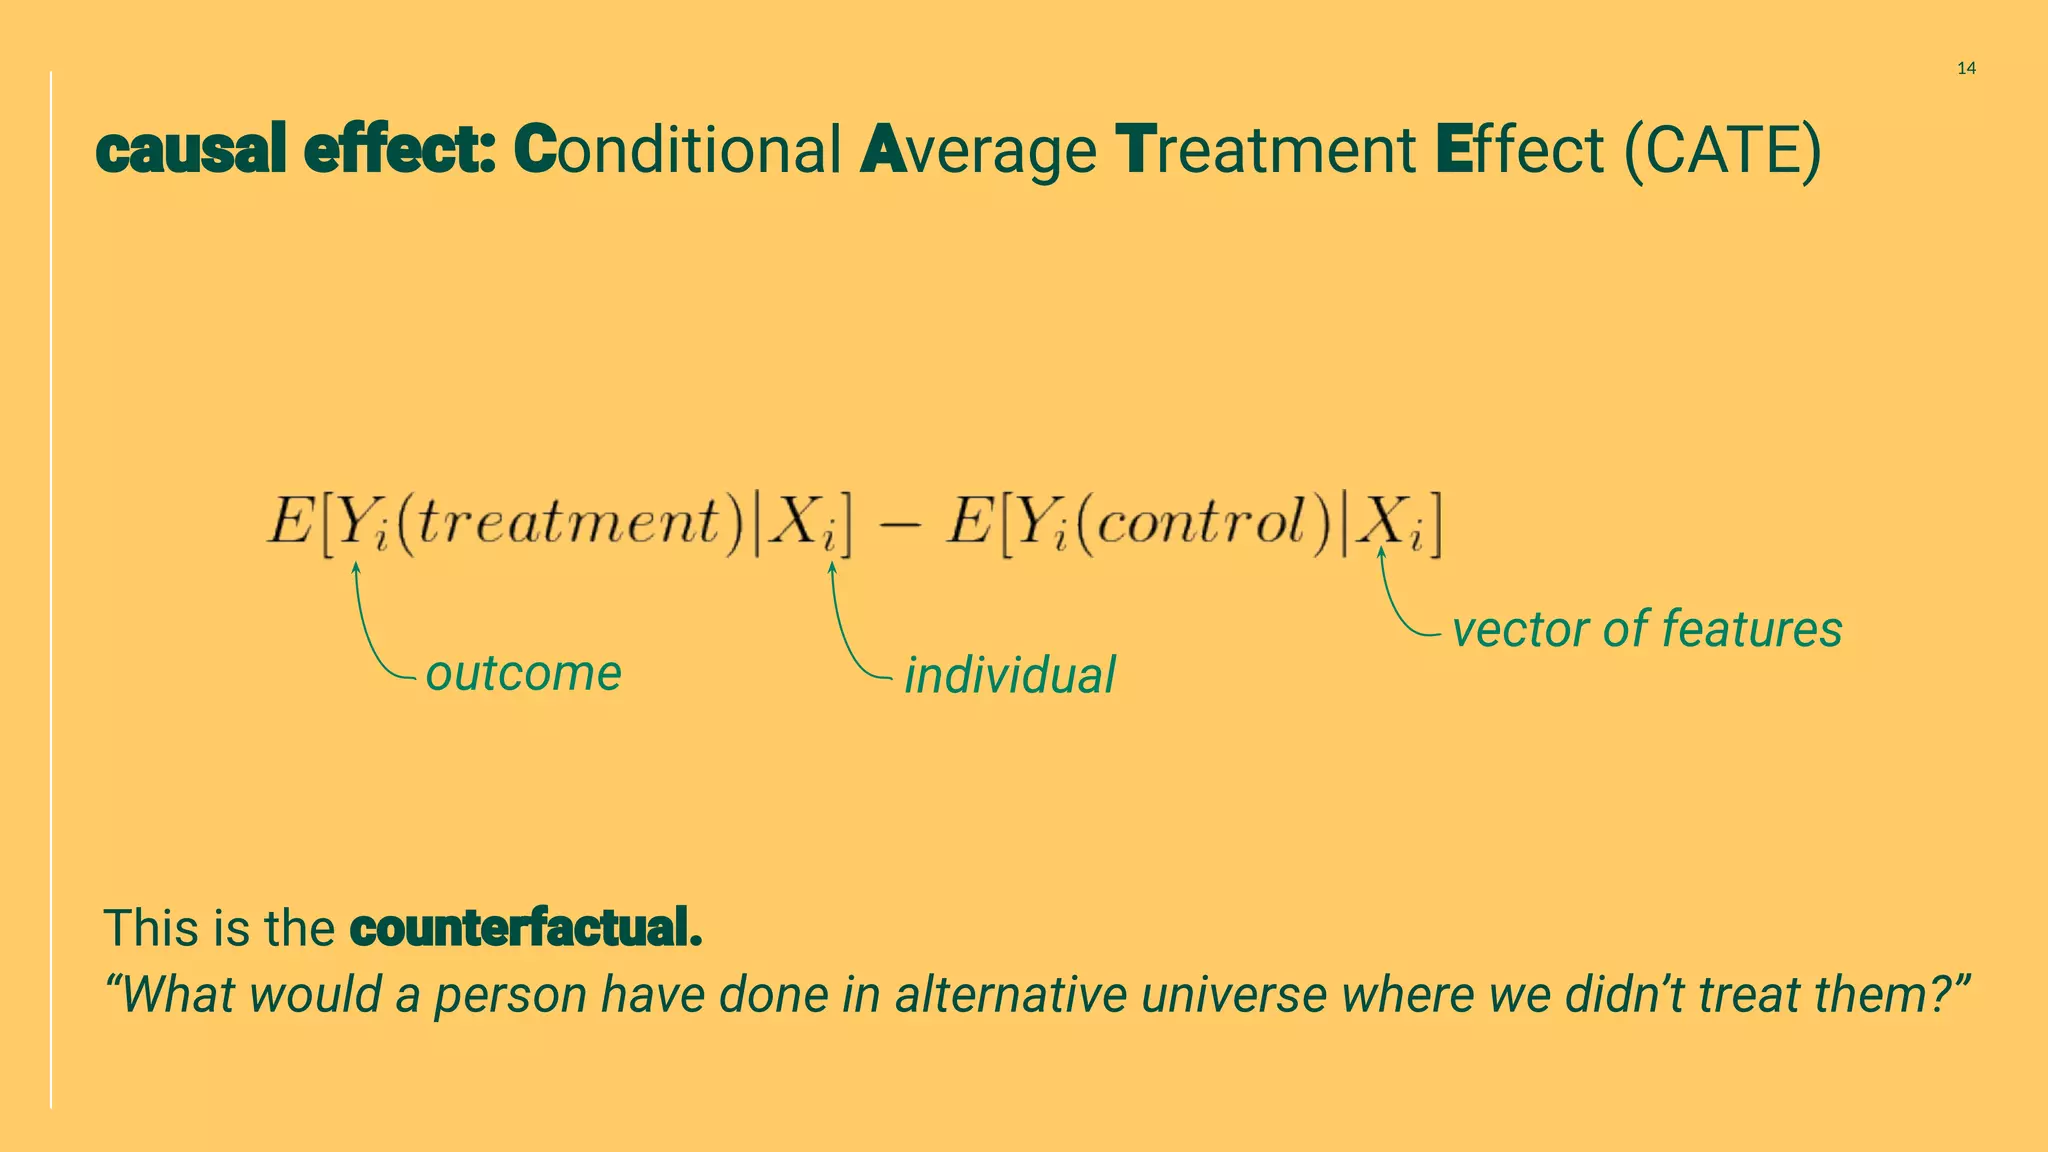
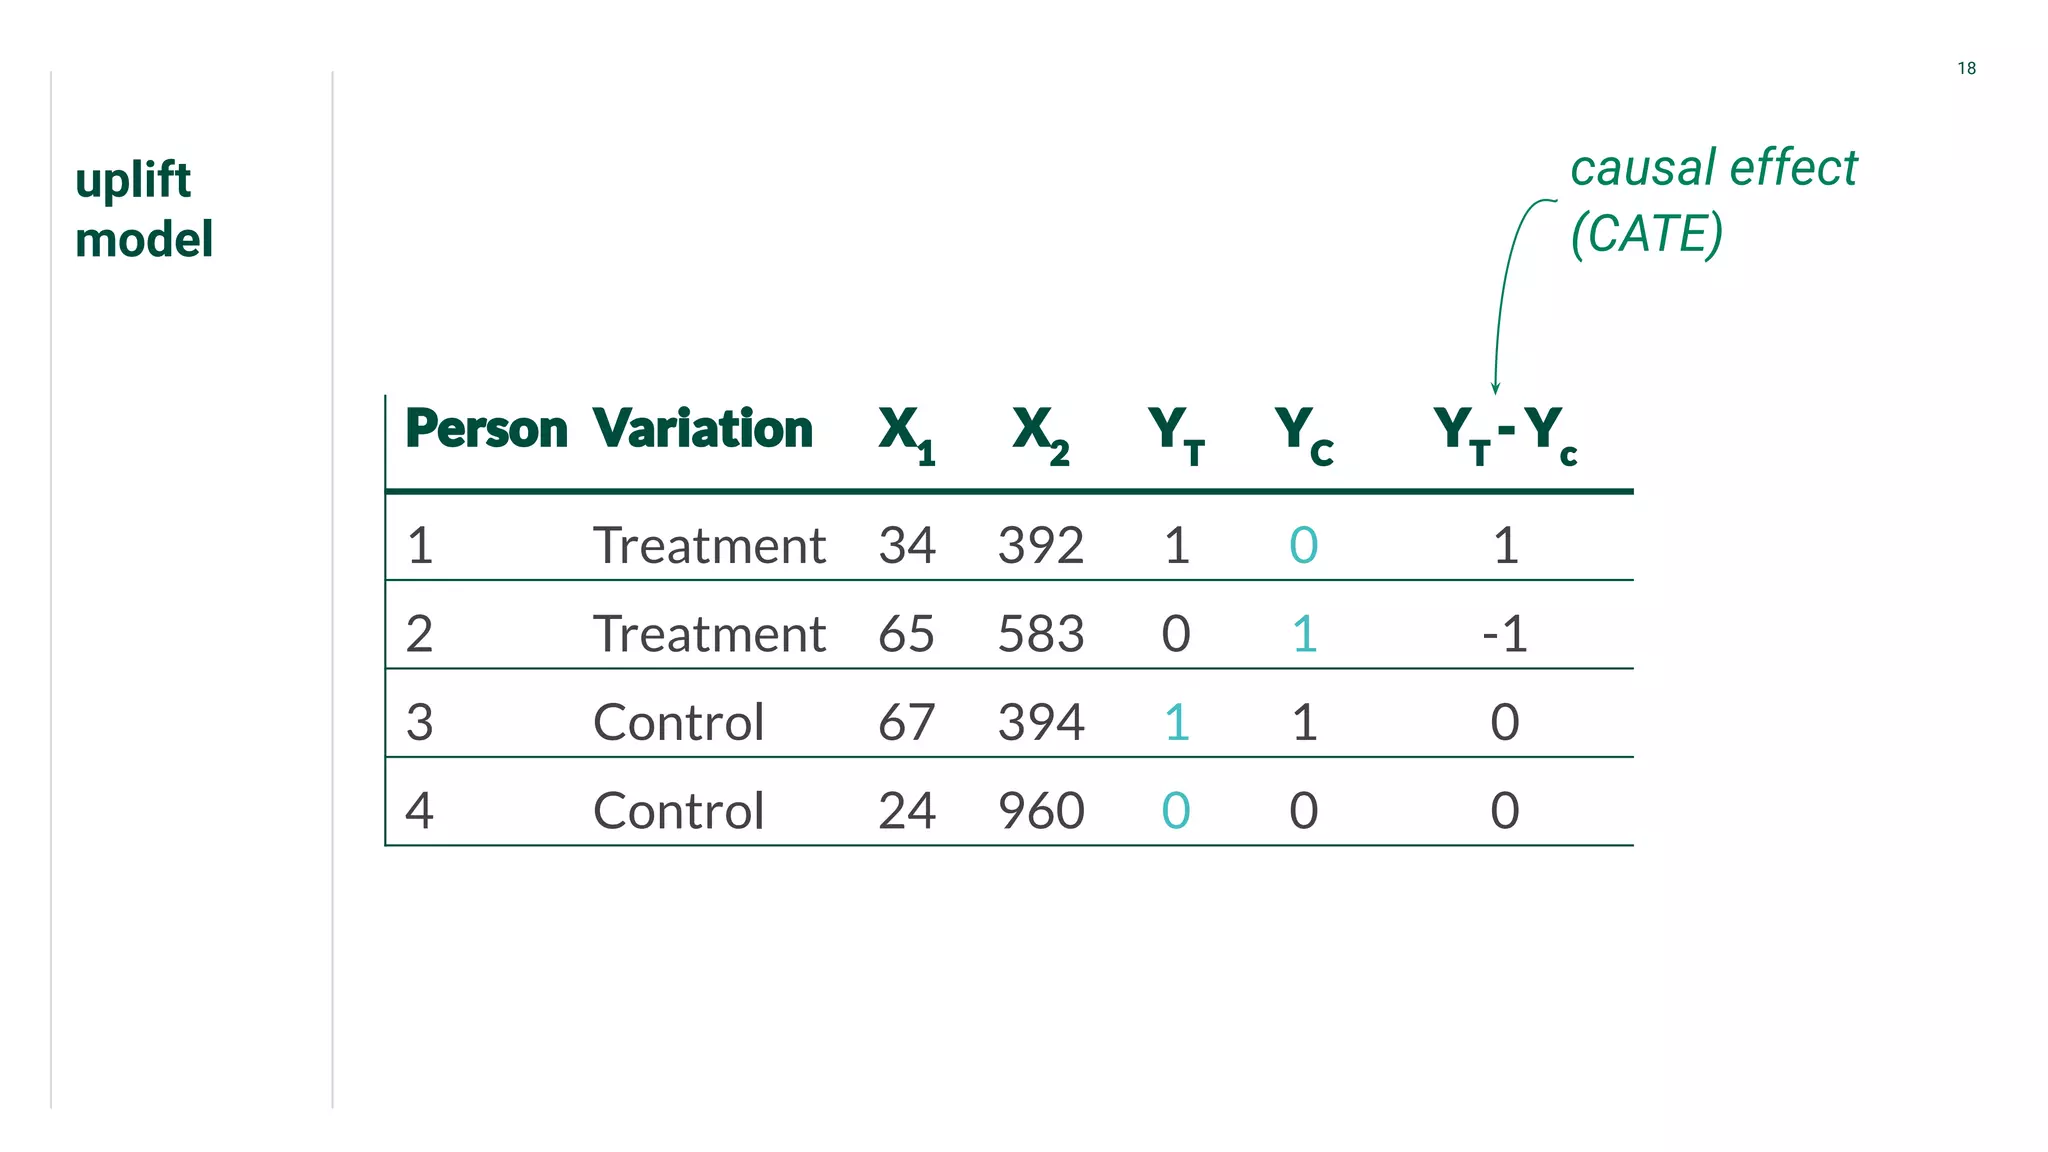
Introduction to CATE focusing on individual outcomes in alternative scenarios regarding treatments.
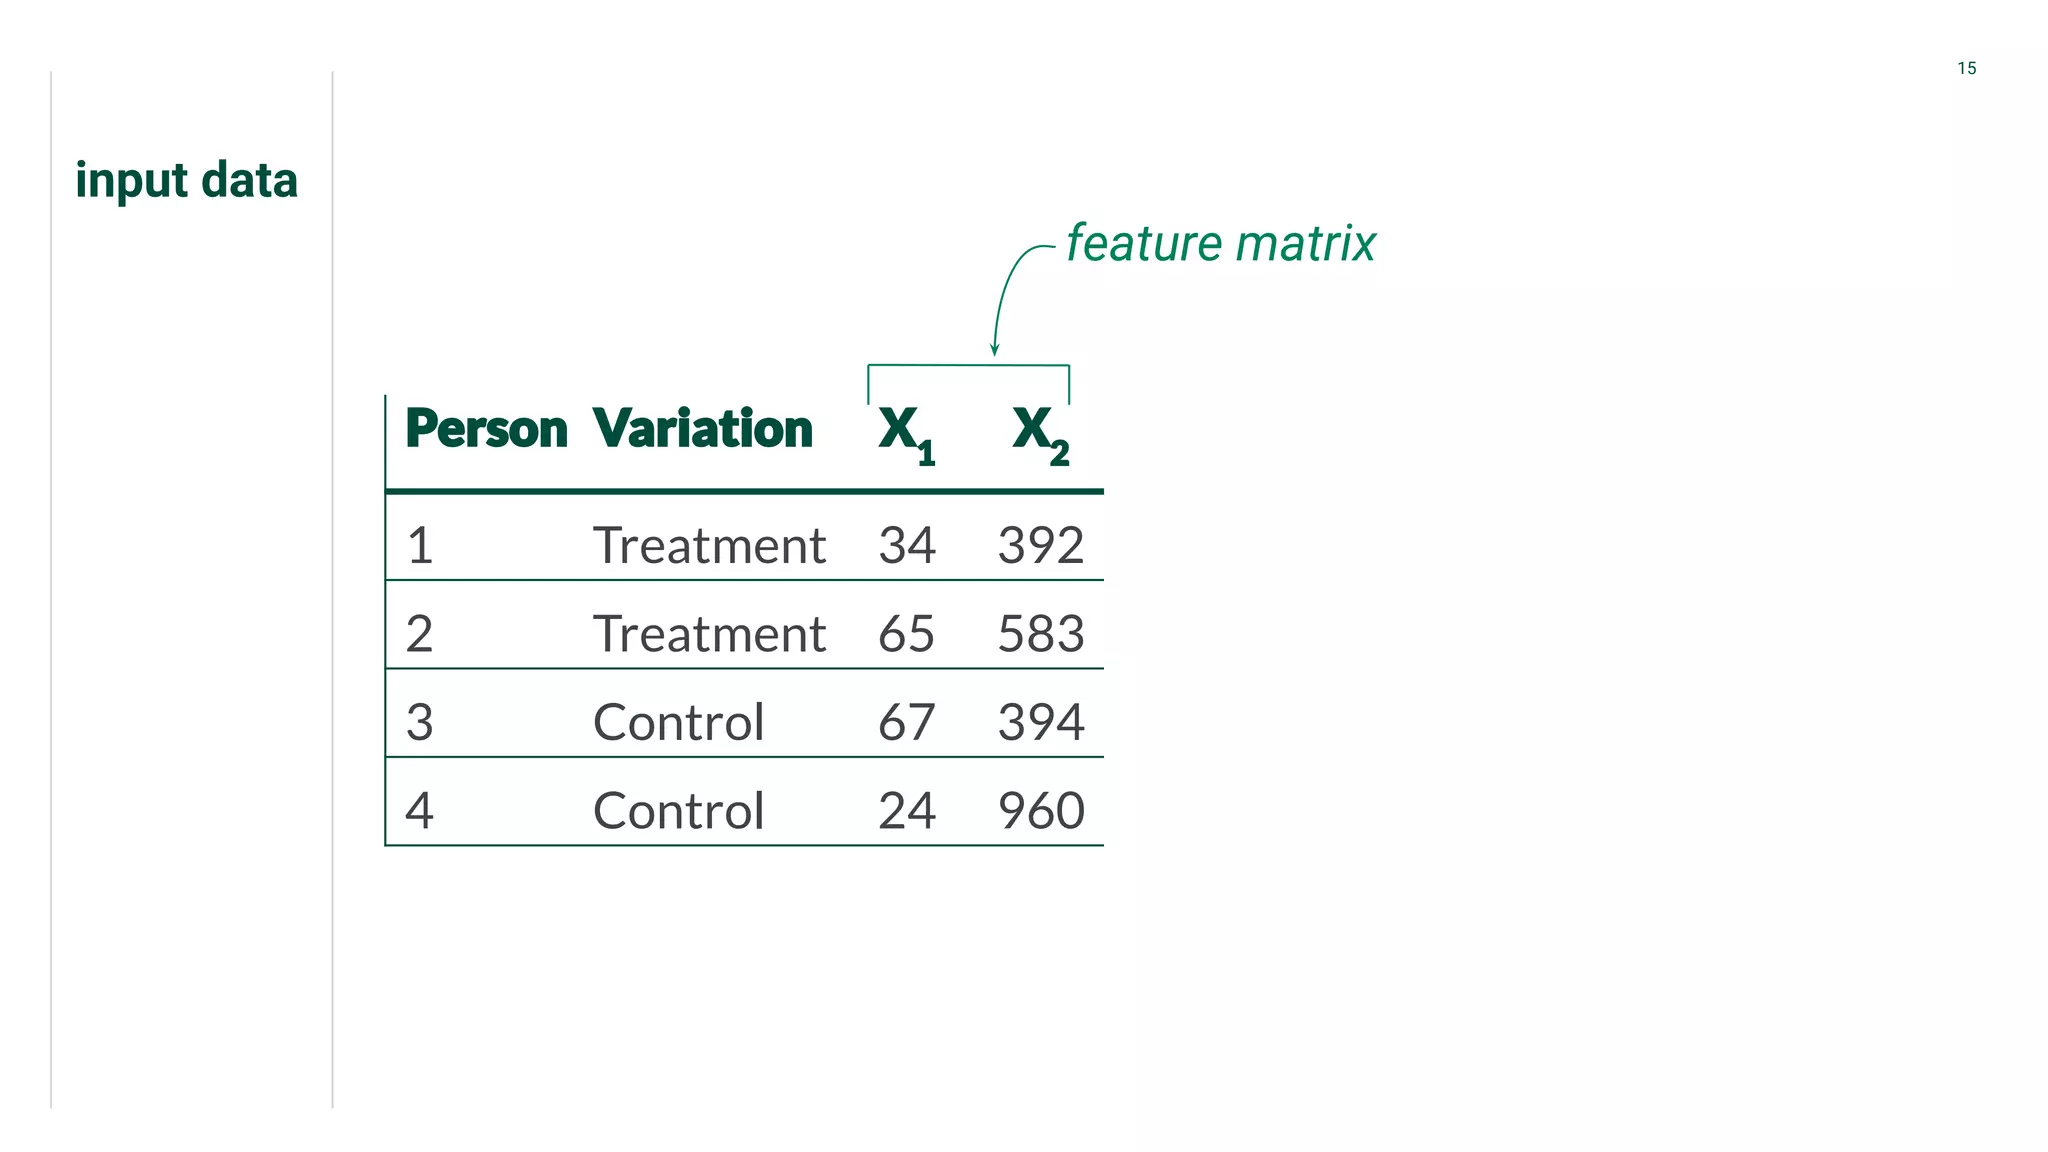
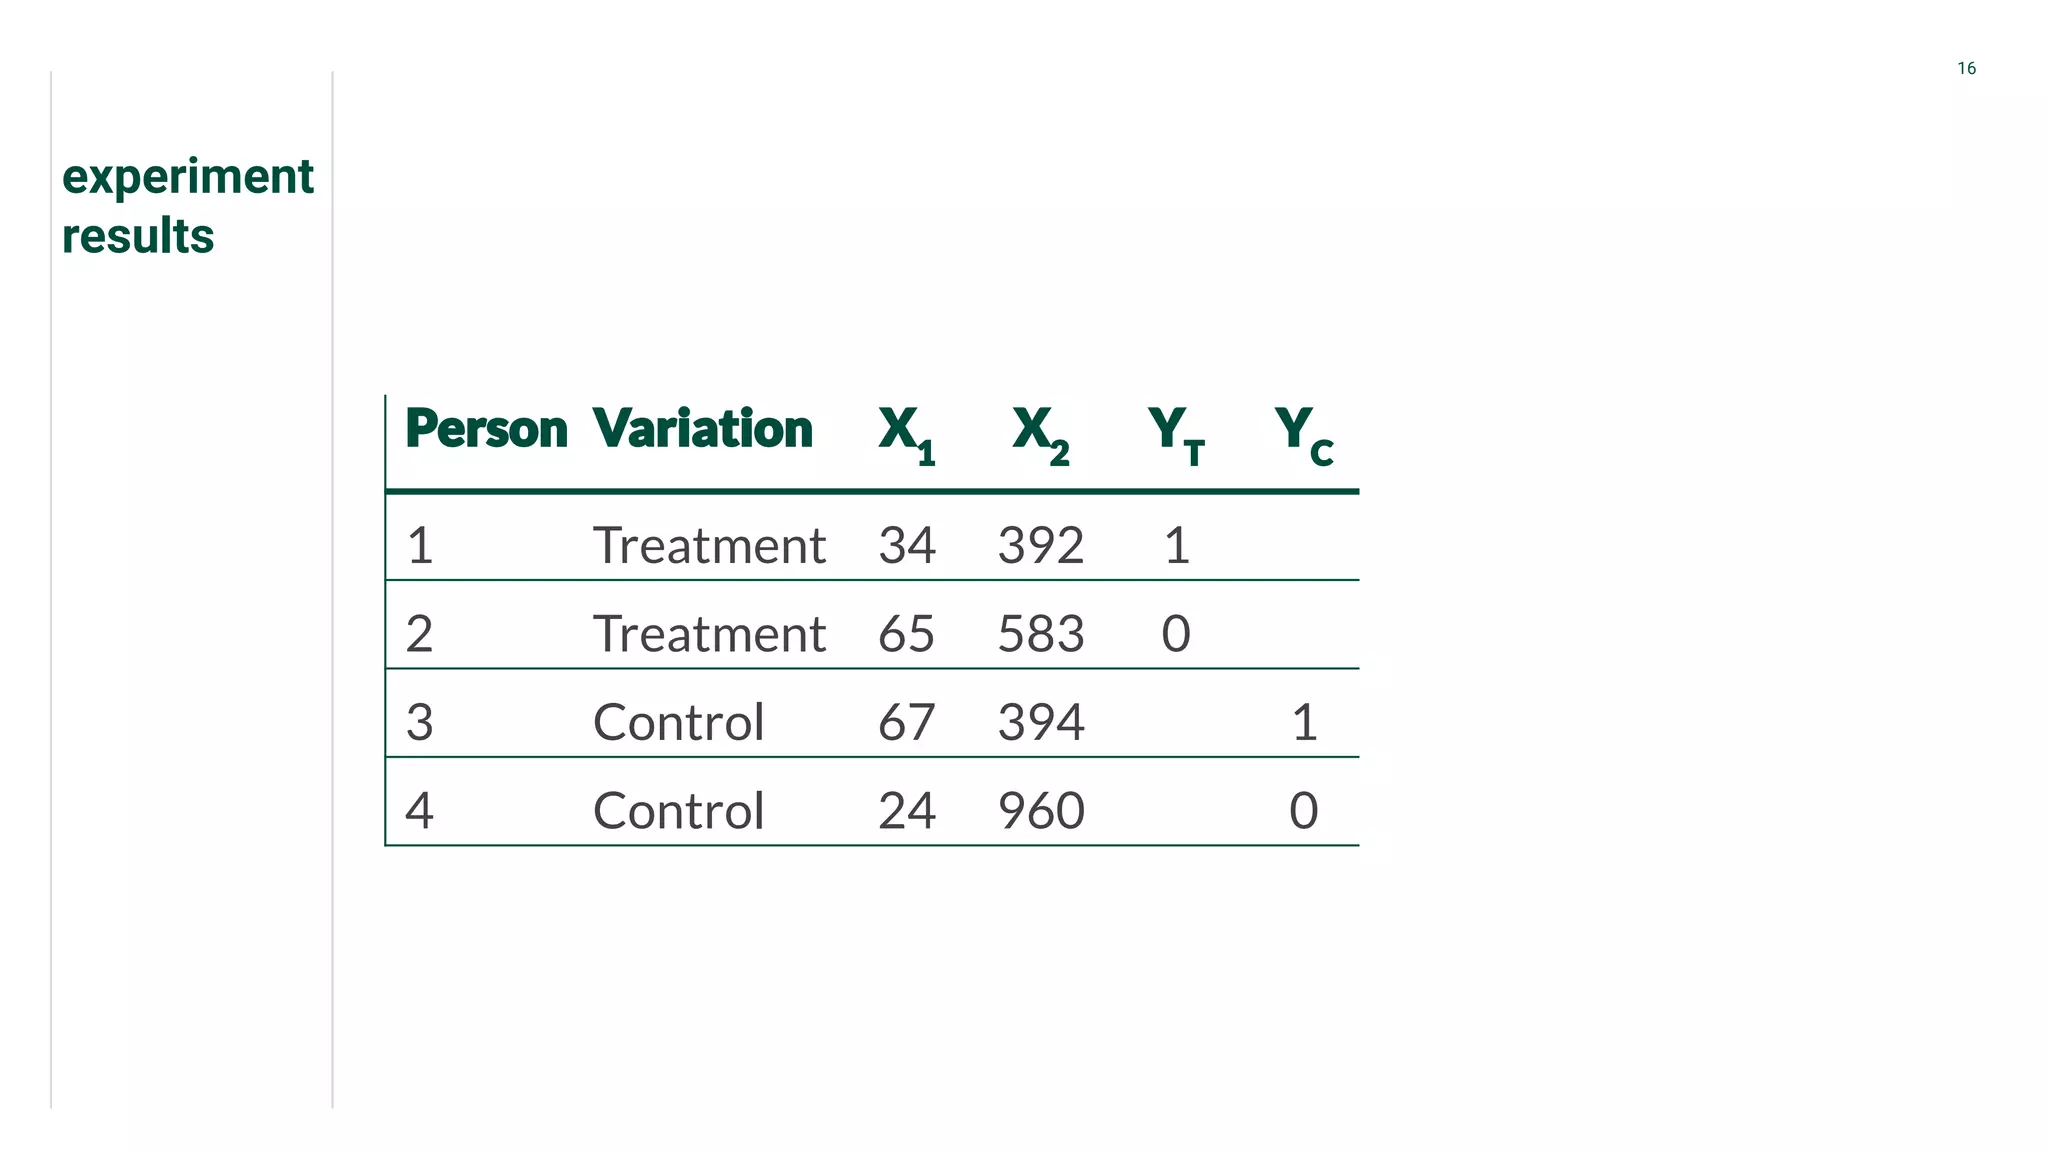
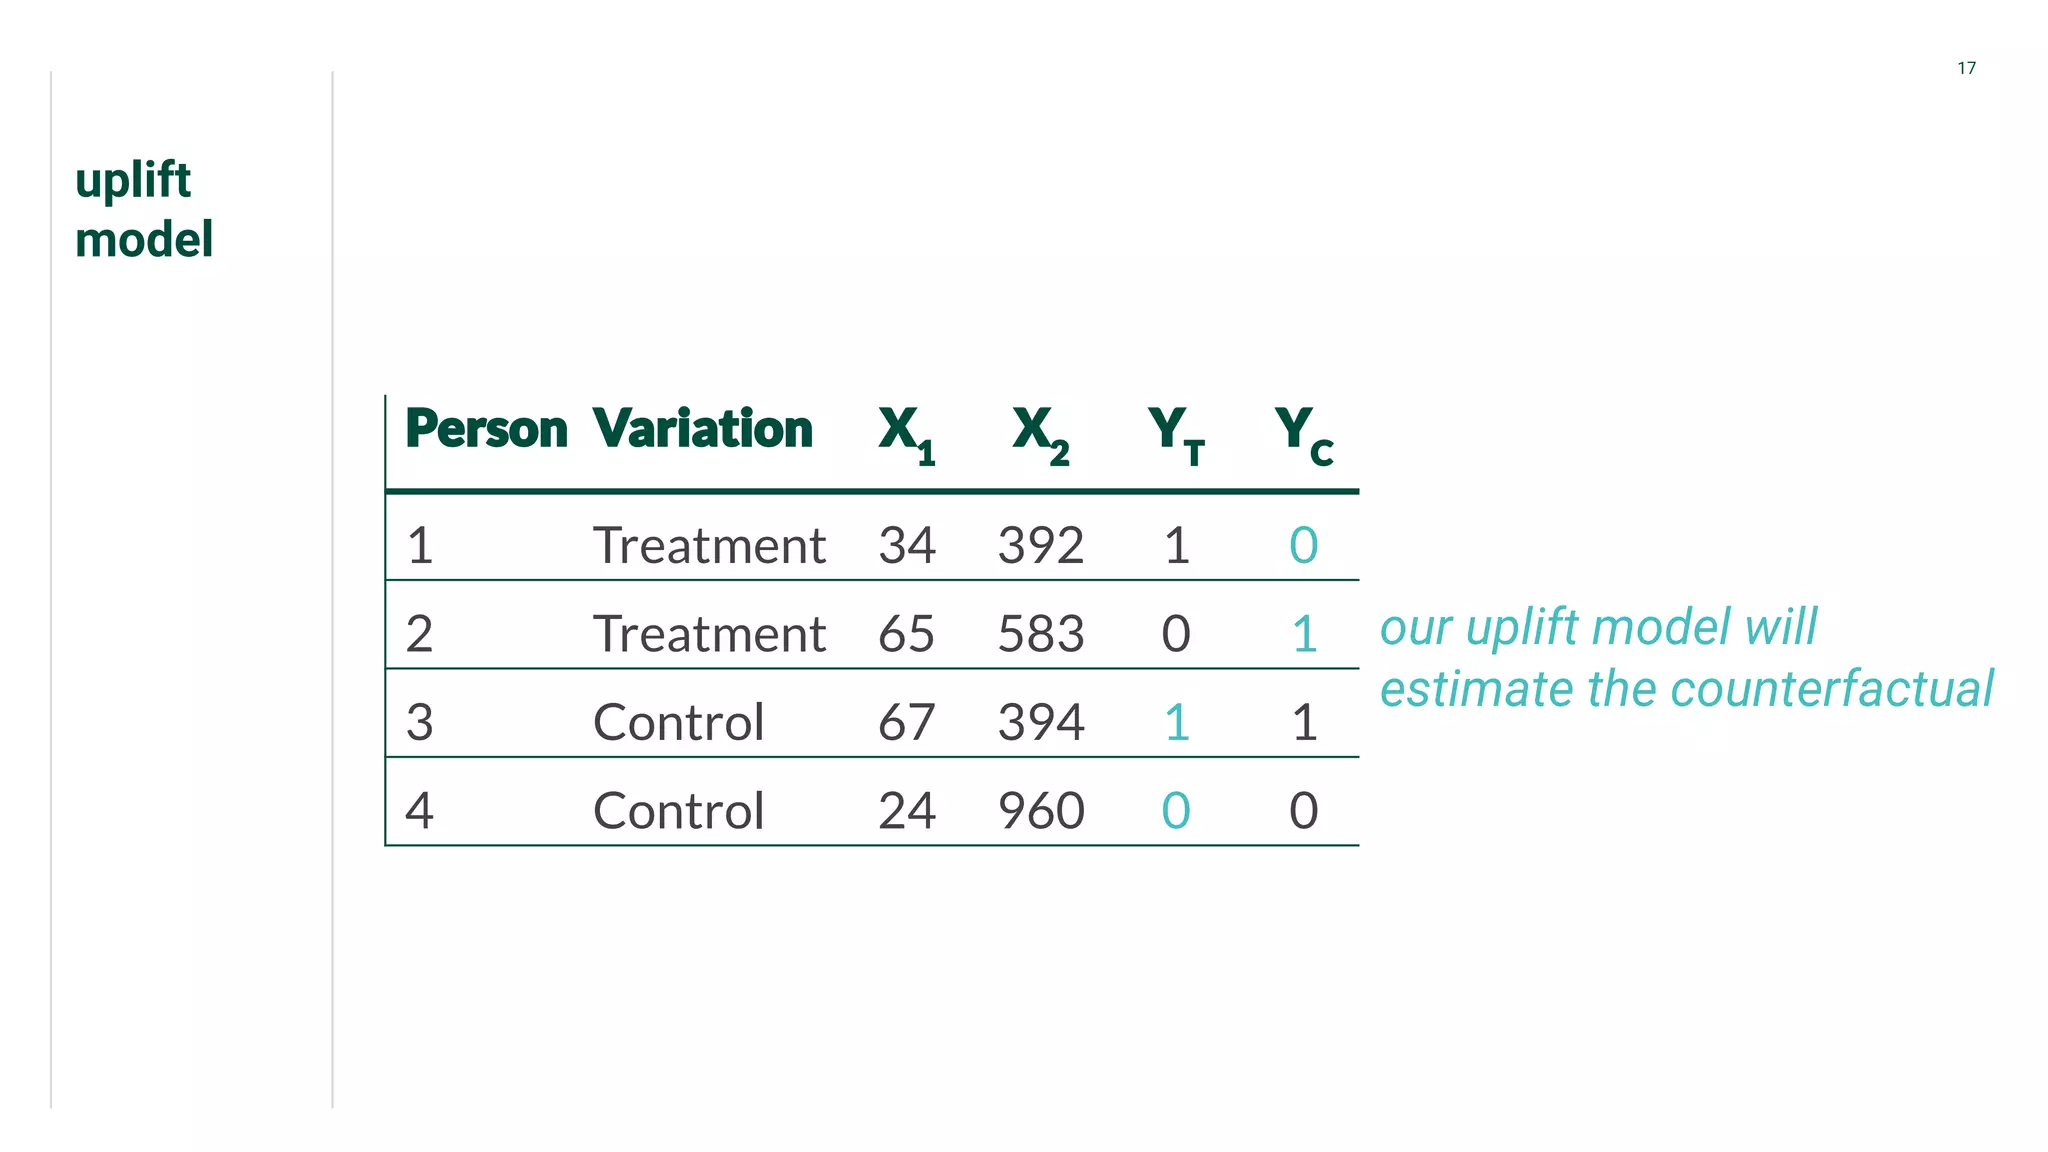
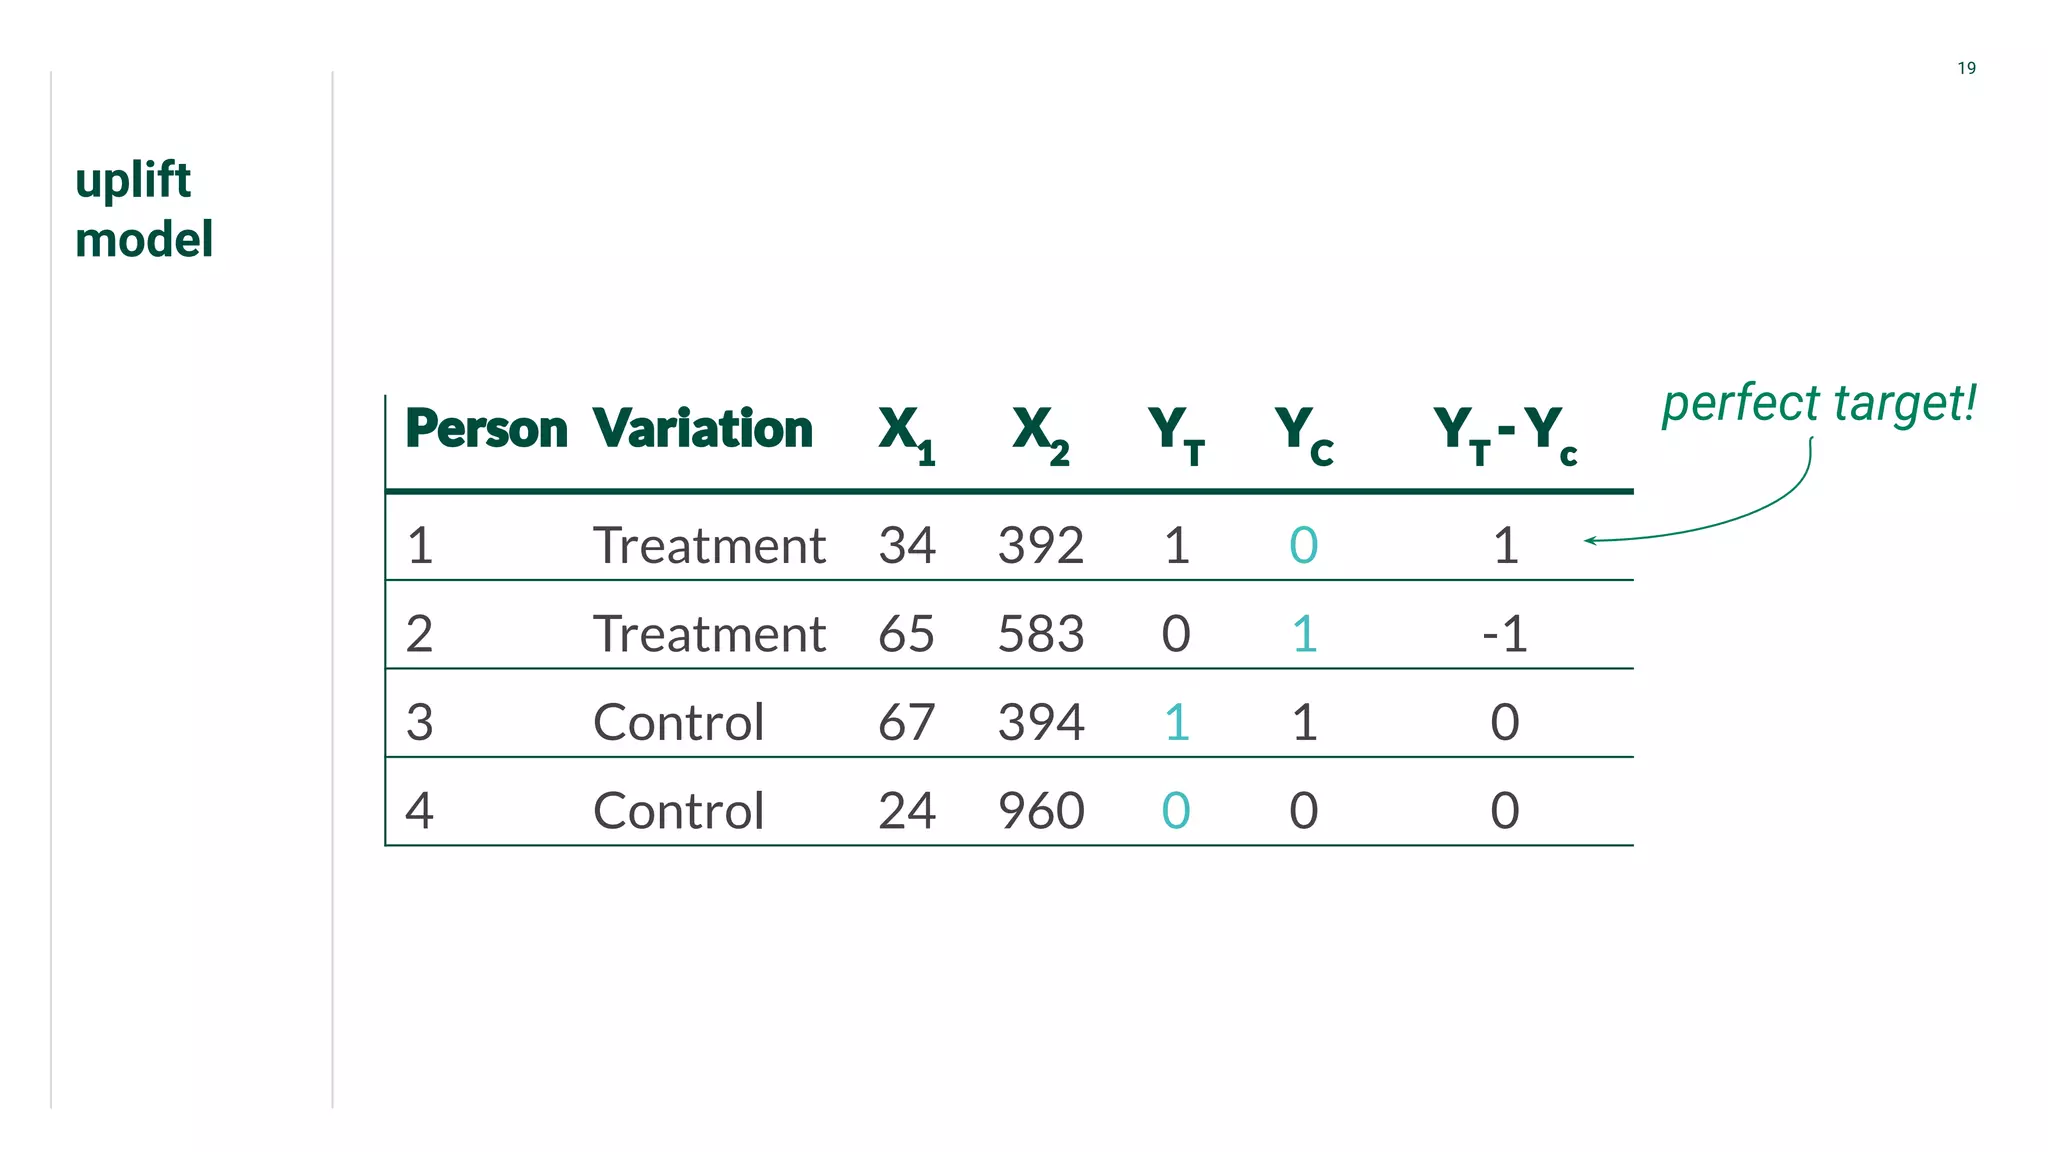
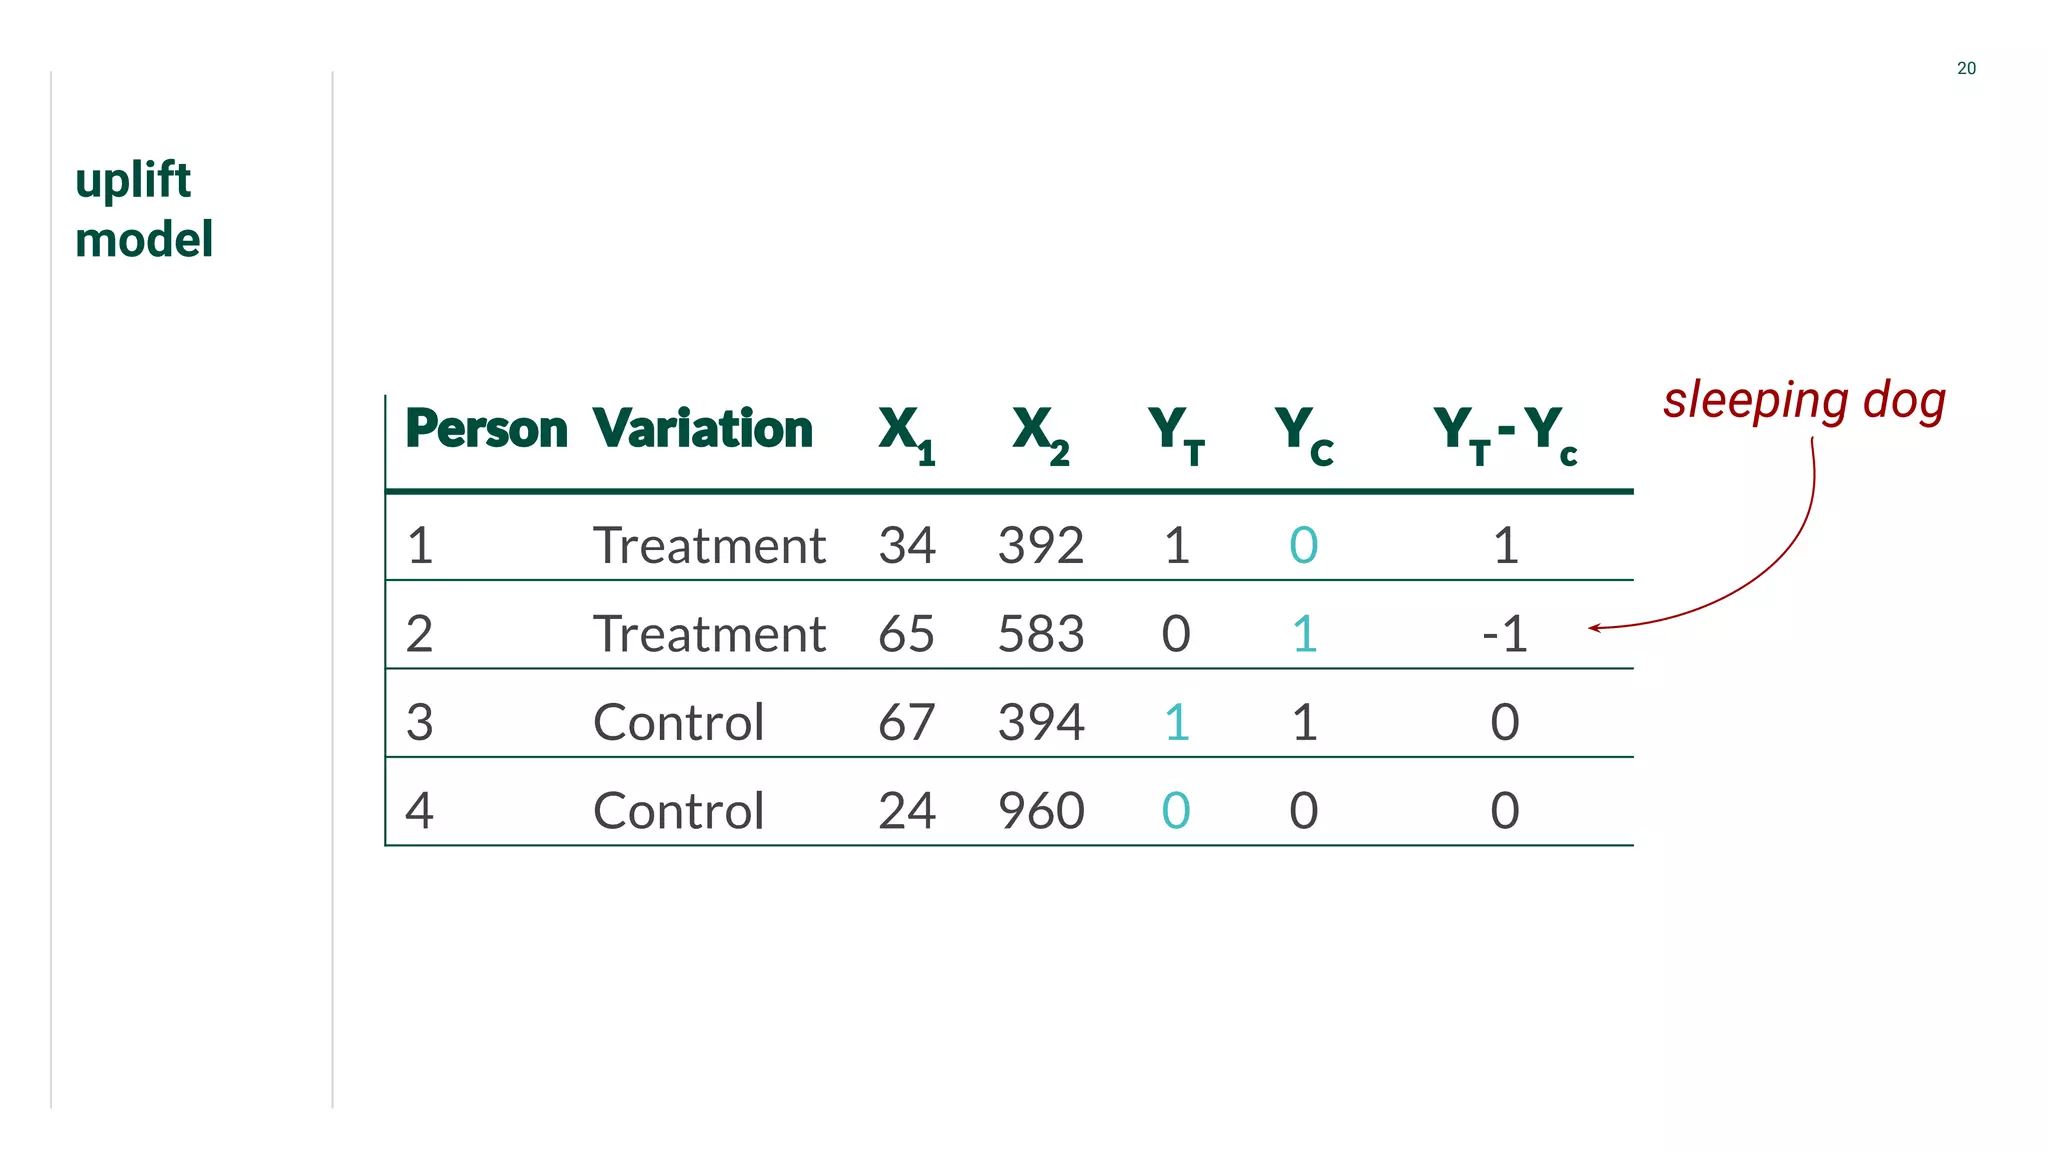
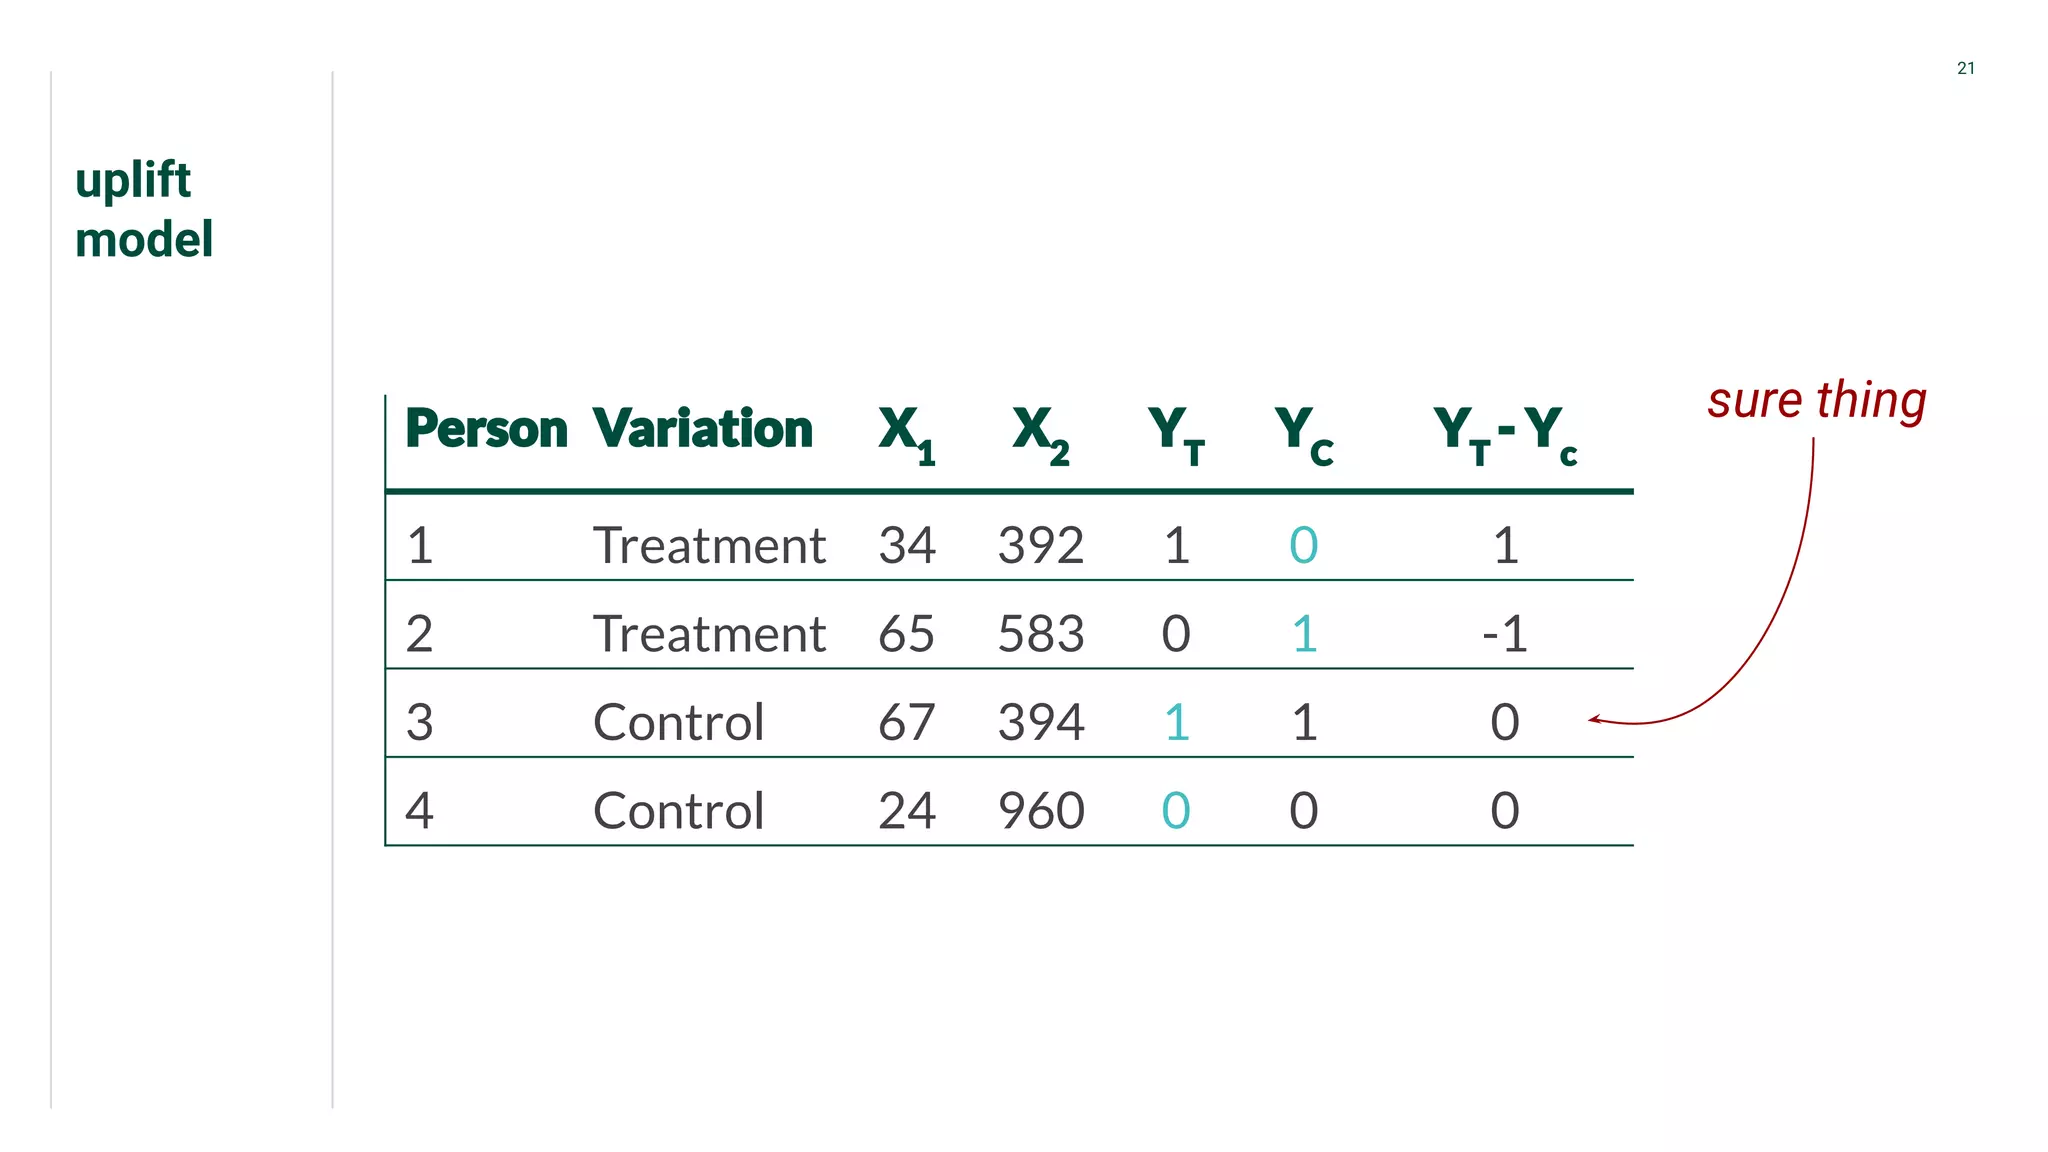
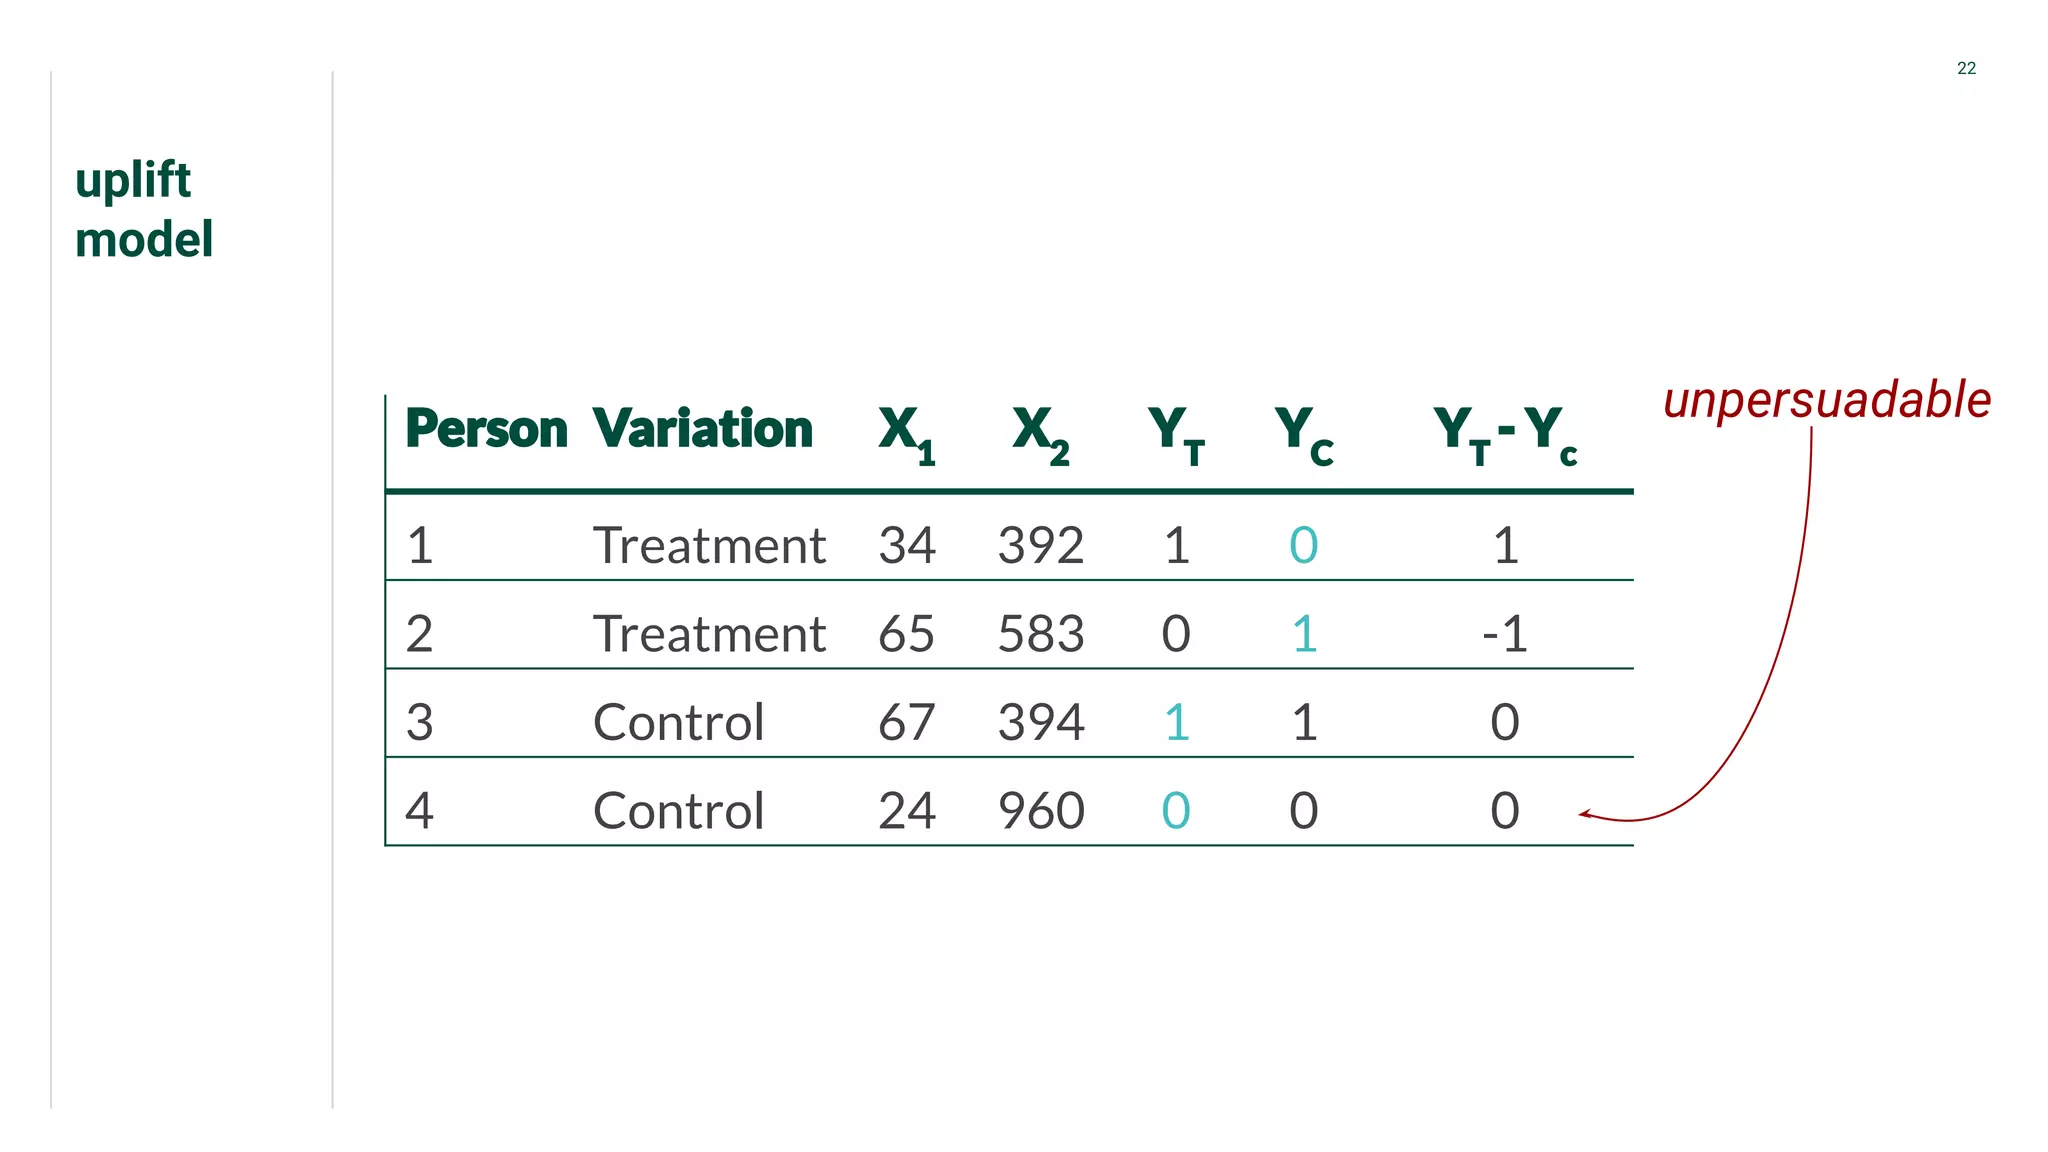
Presents data from treatment and control groups, demonstrating how uplift modeling estimates counterfactual impacts.
Discussion of variations of uplift models such as 'sure thing' and 'unpersuadable.'
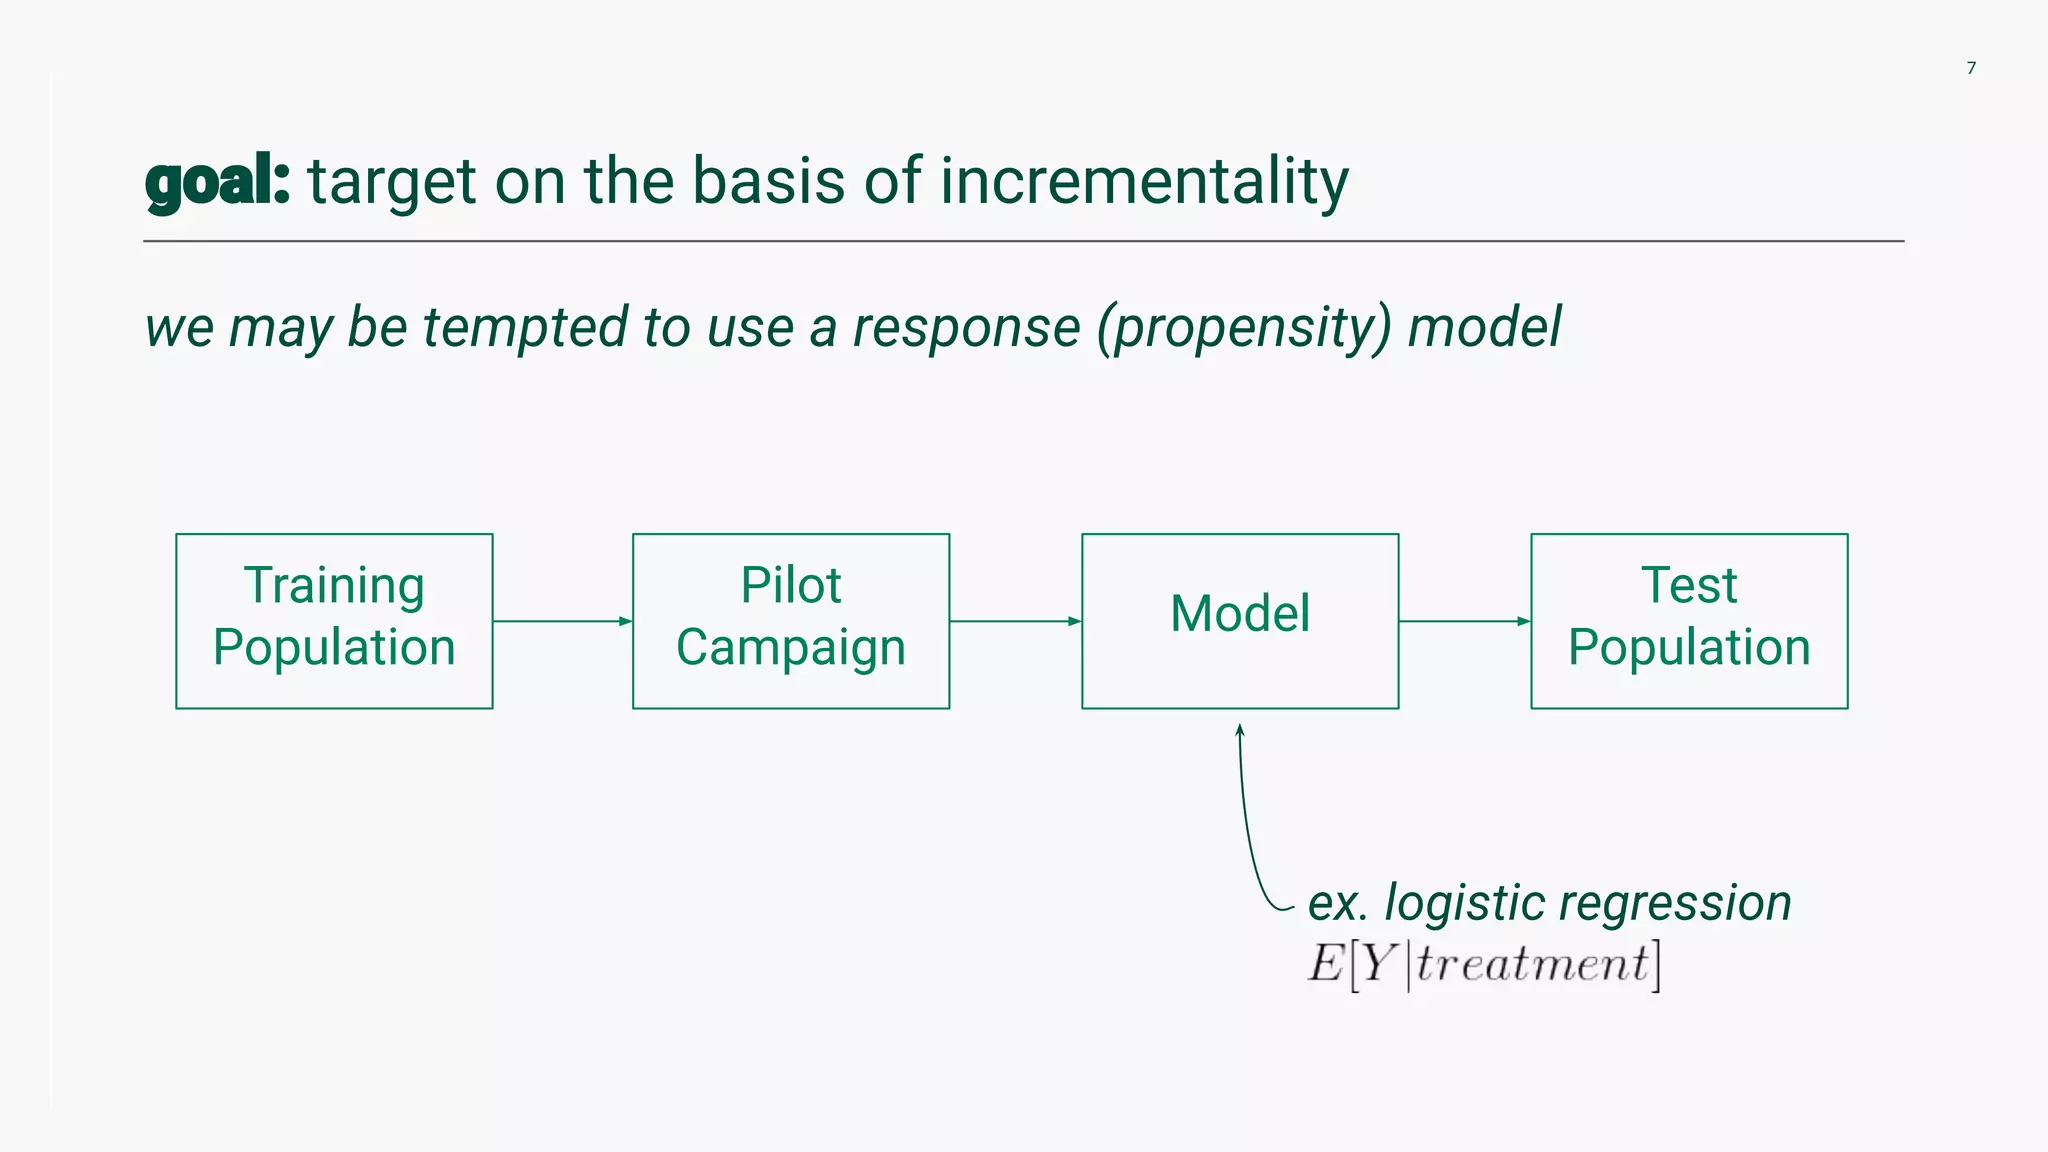
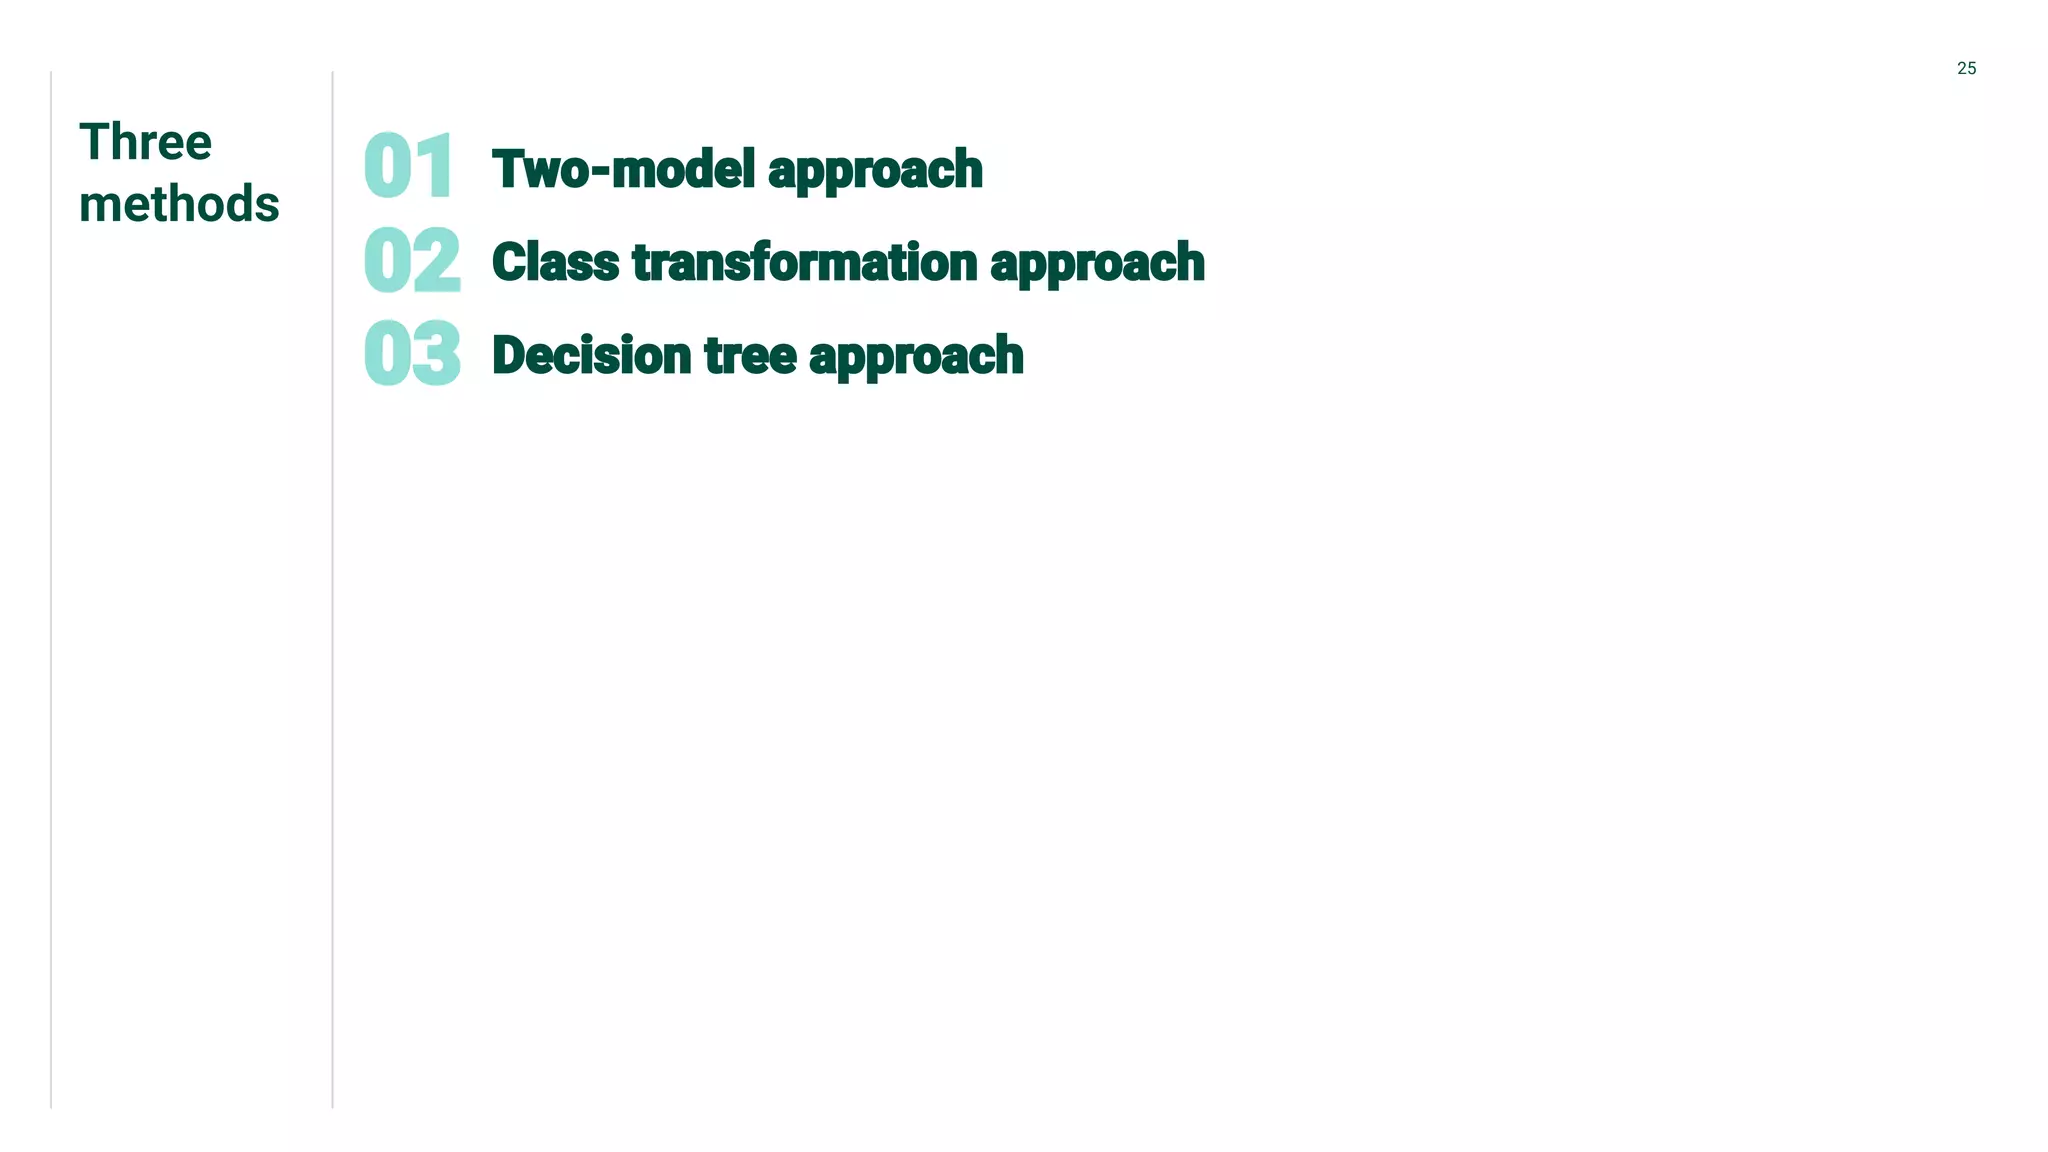
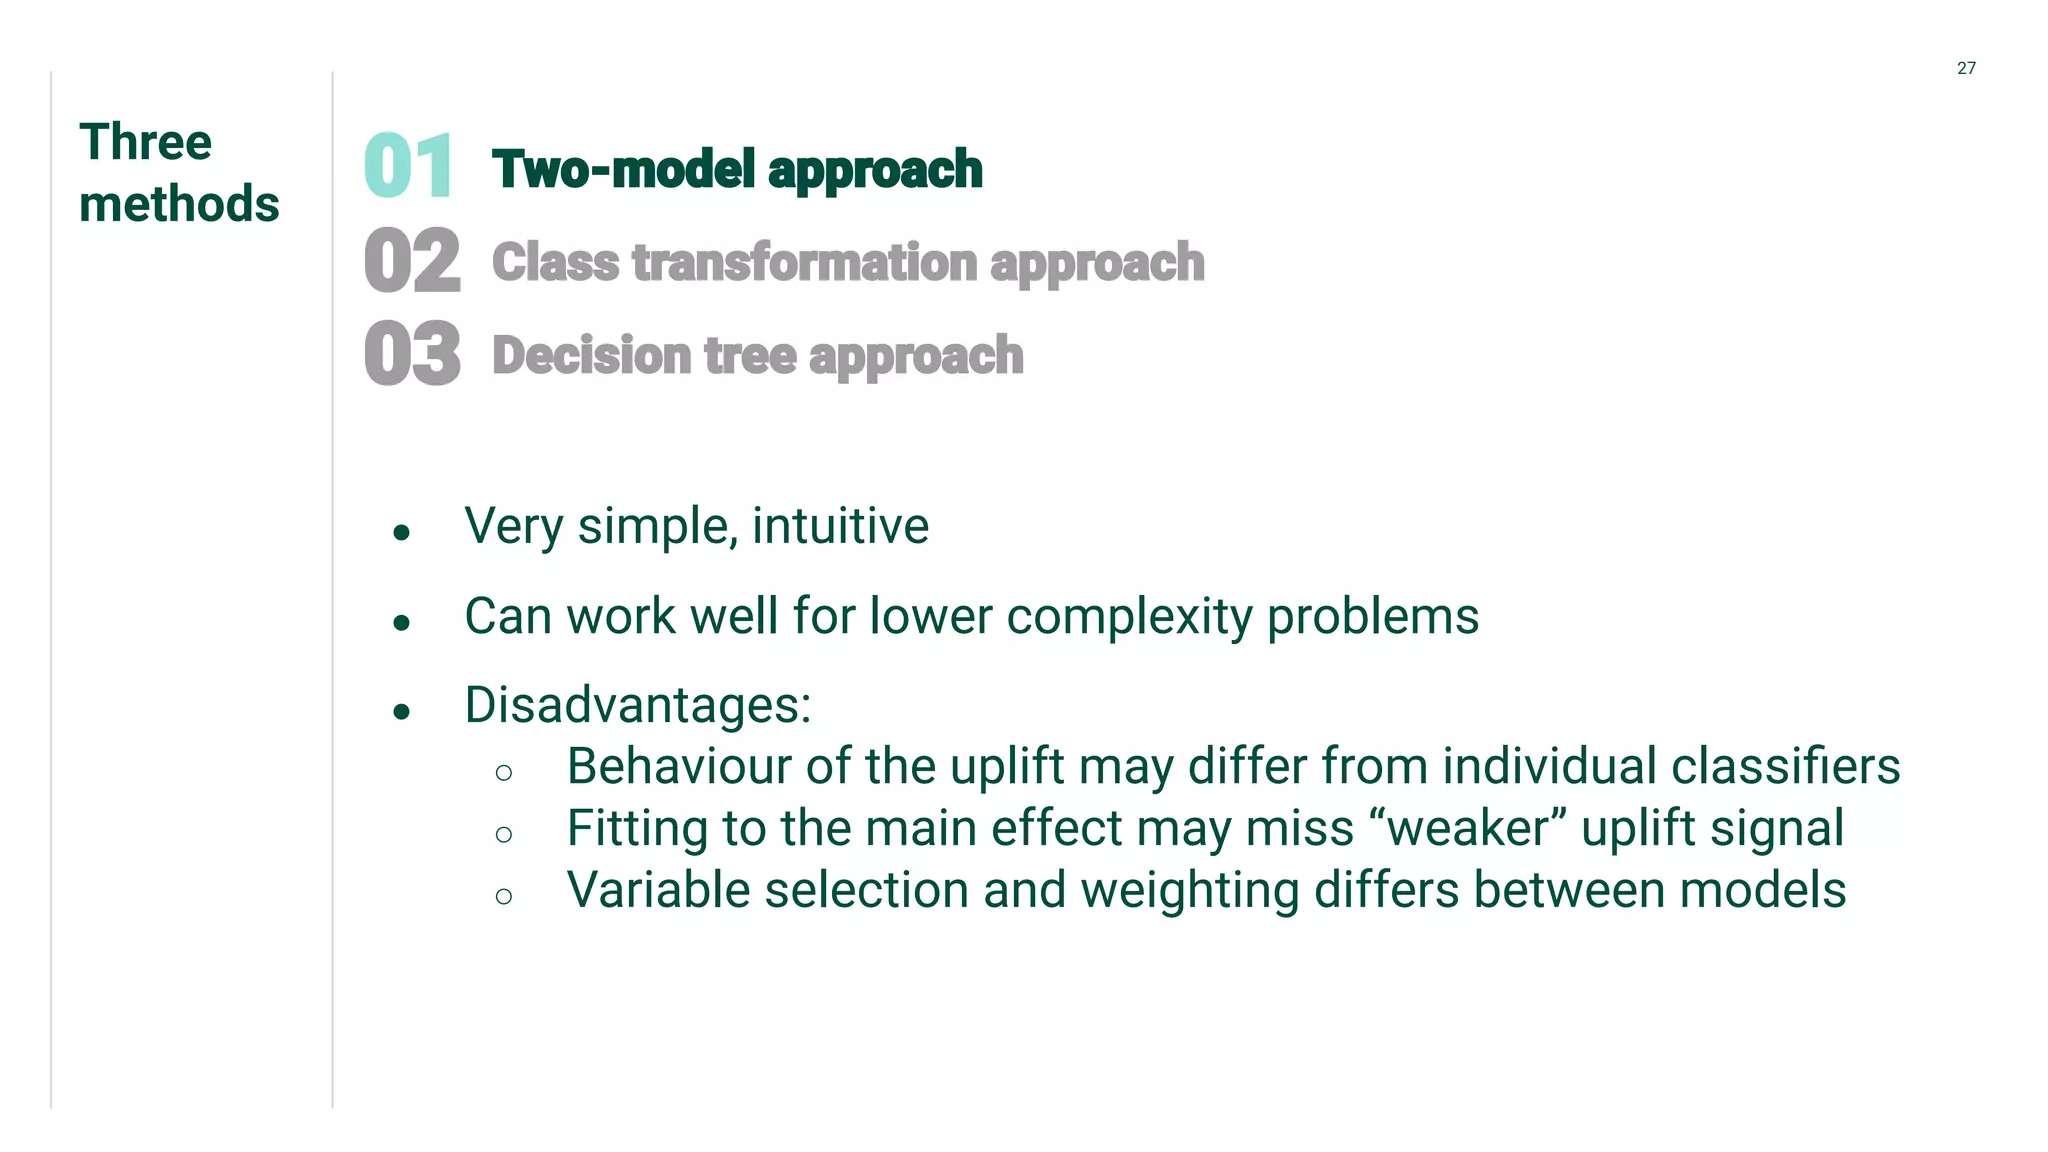
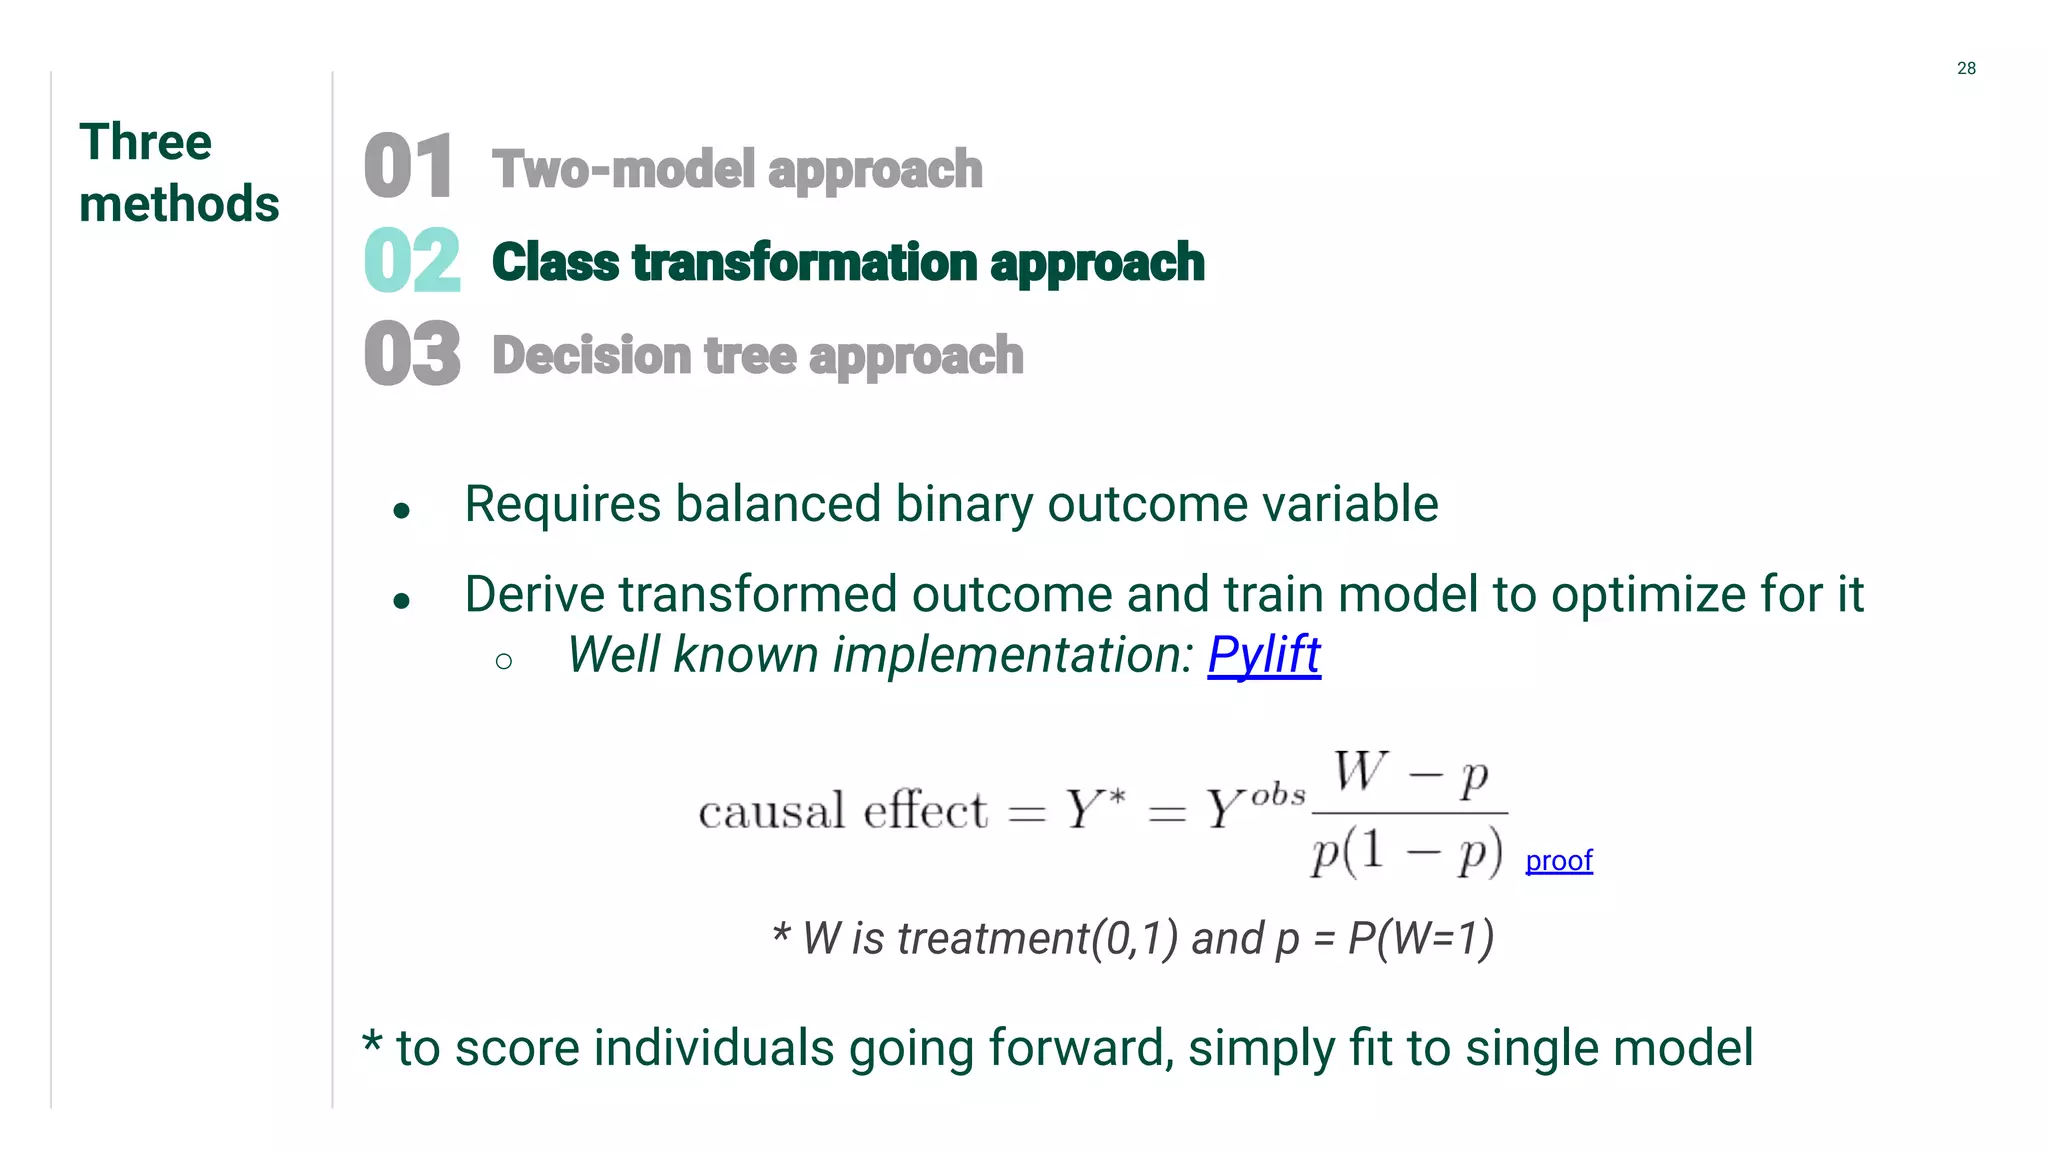
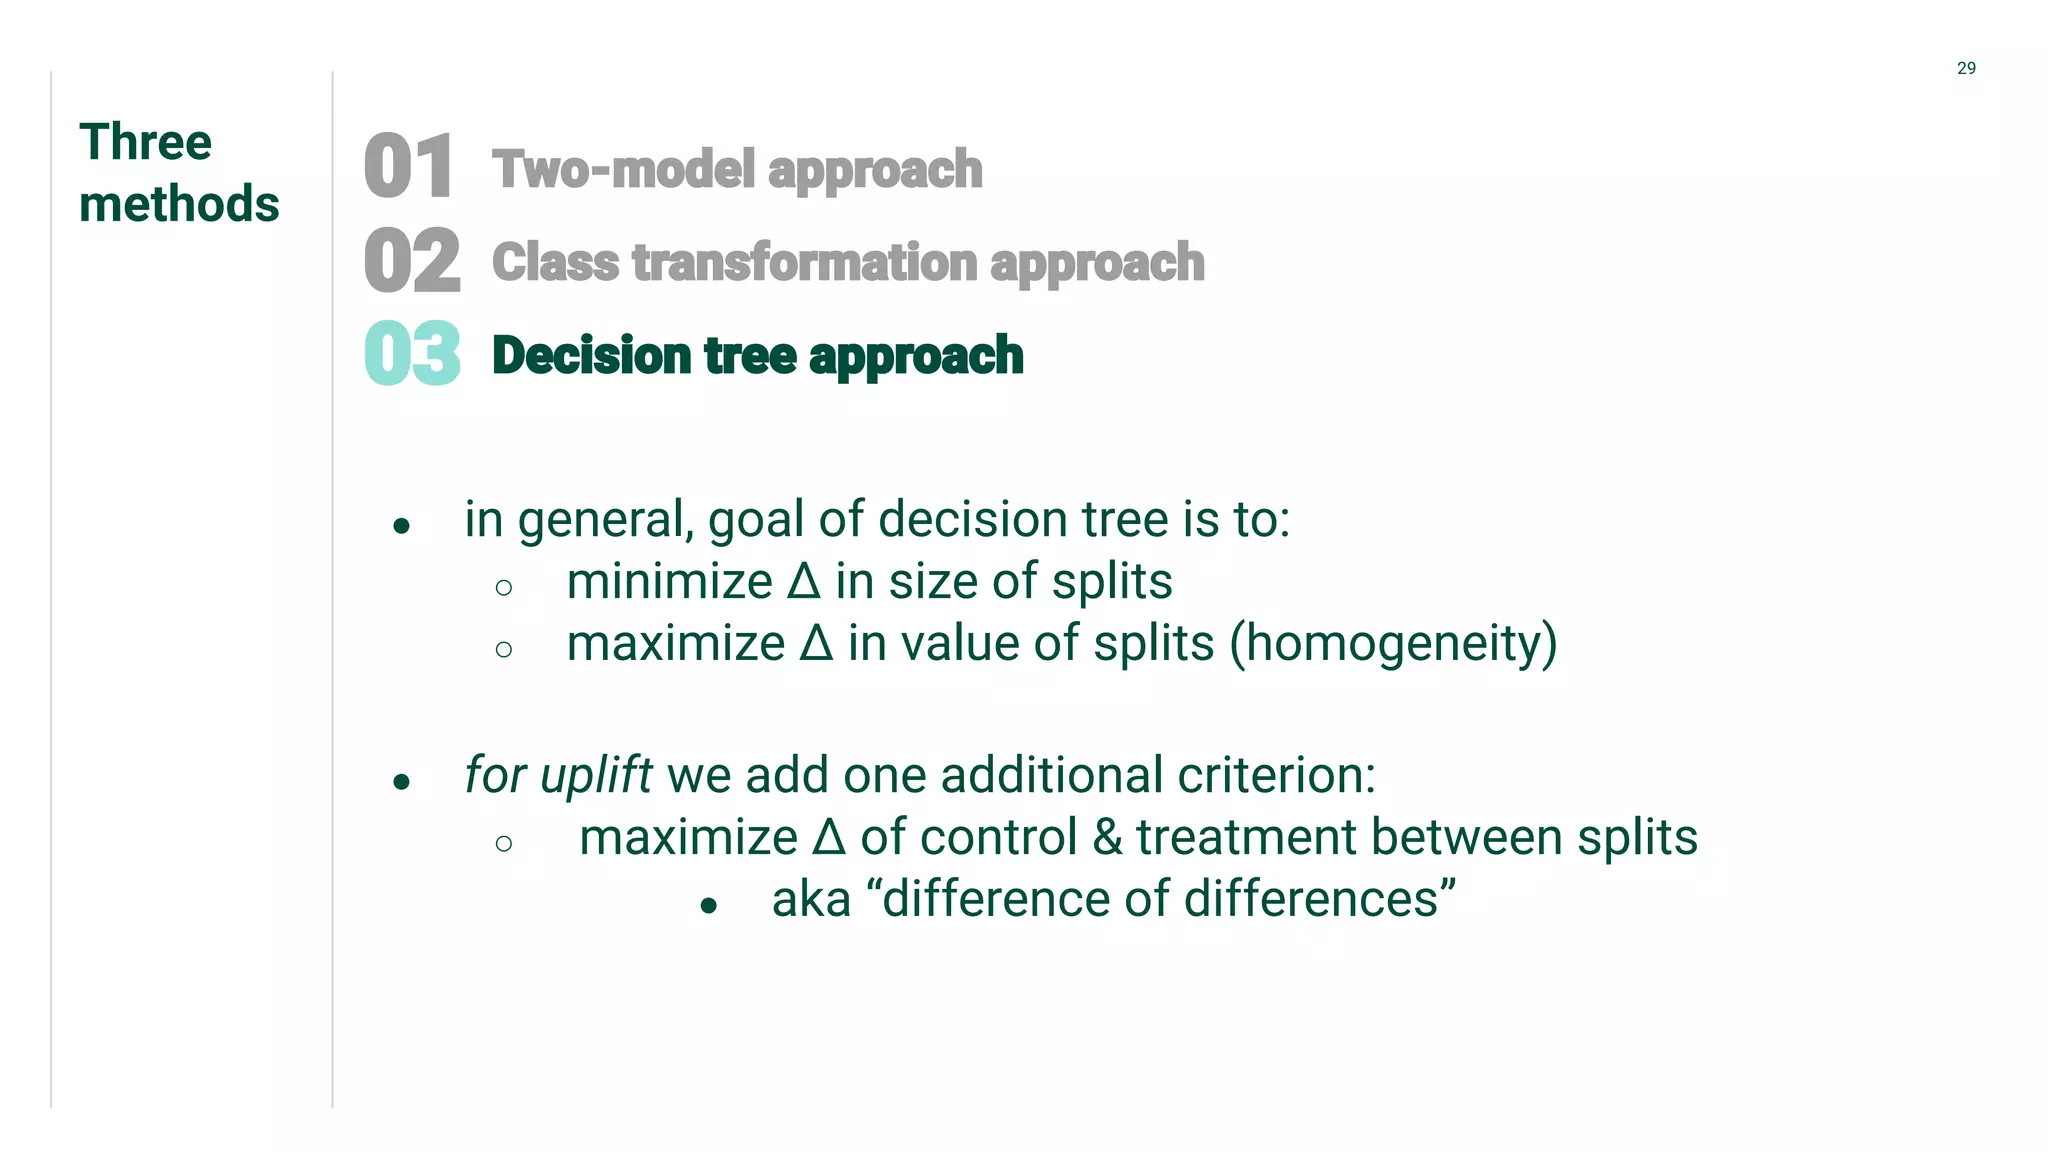
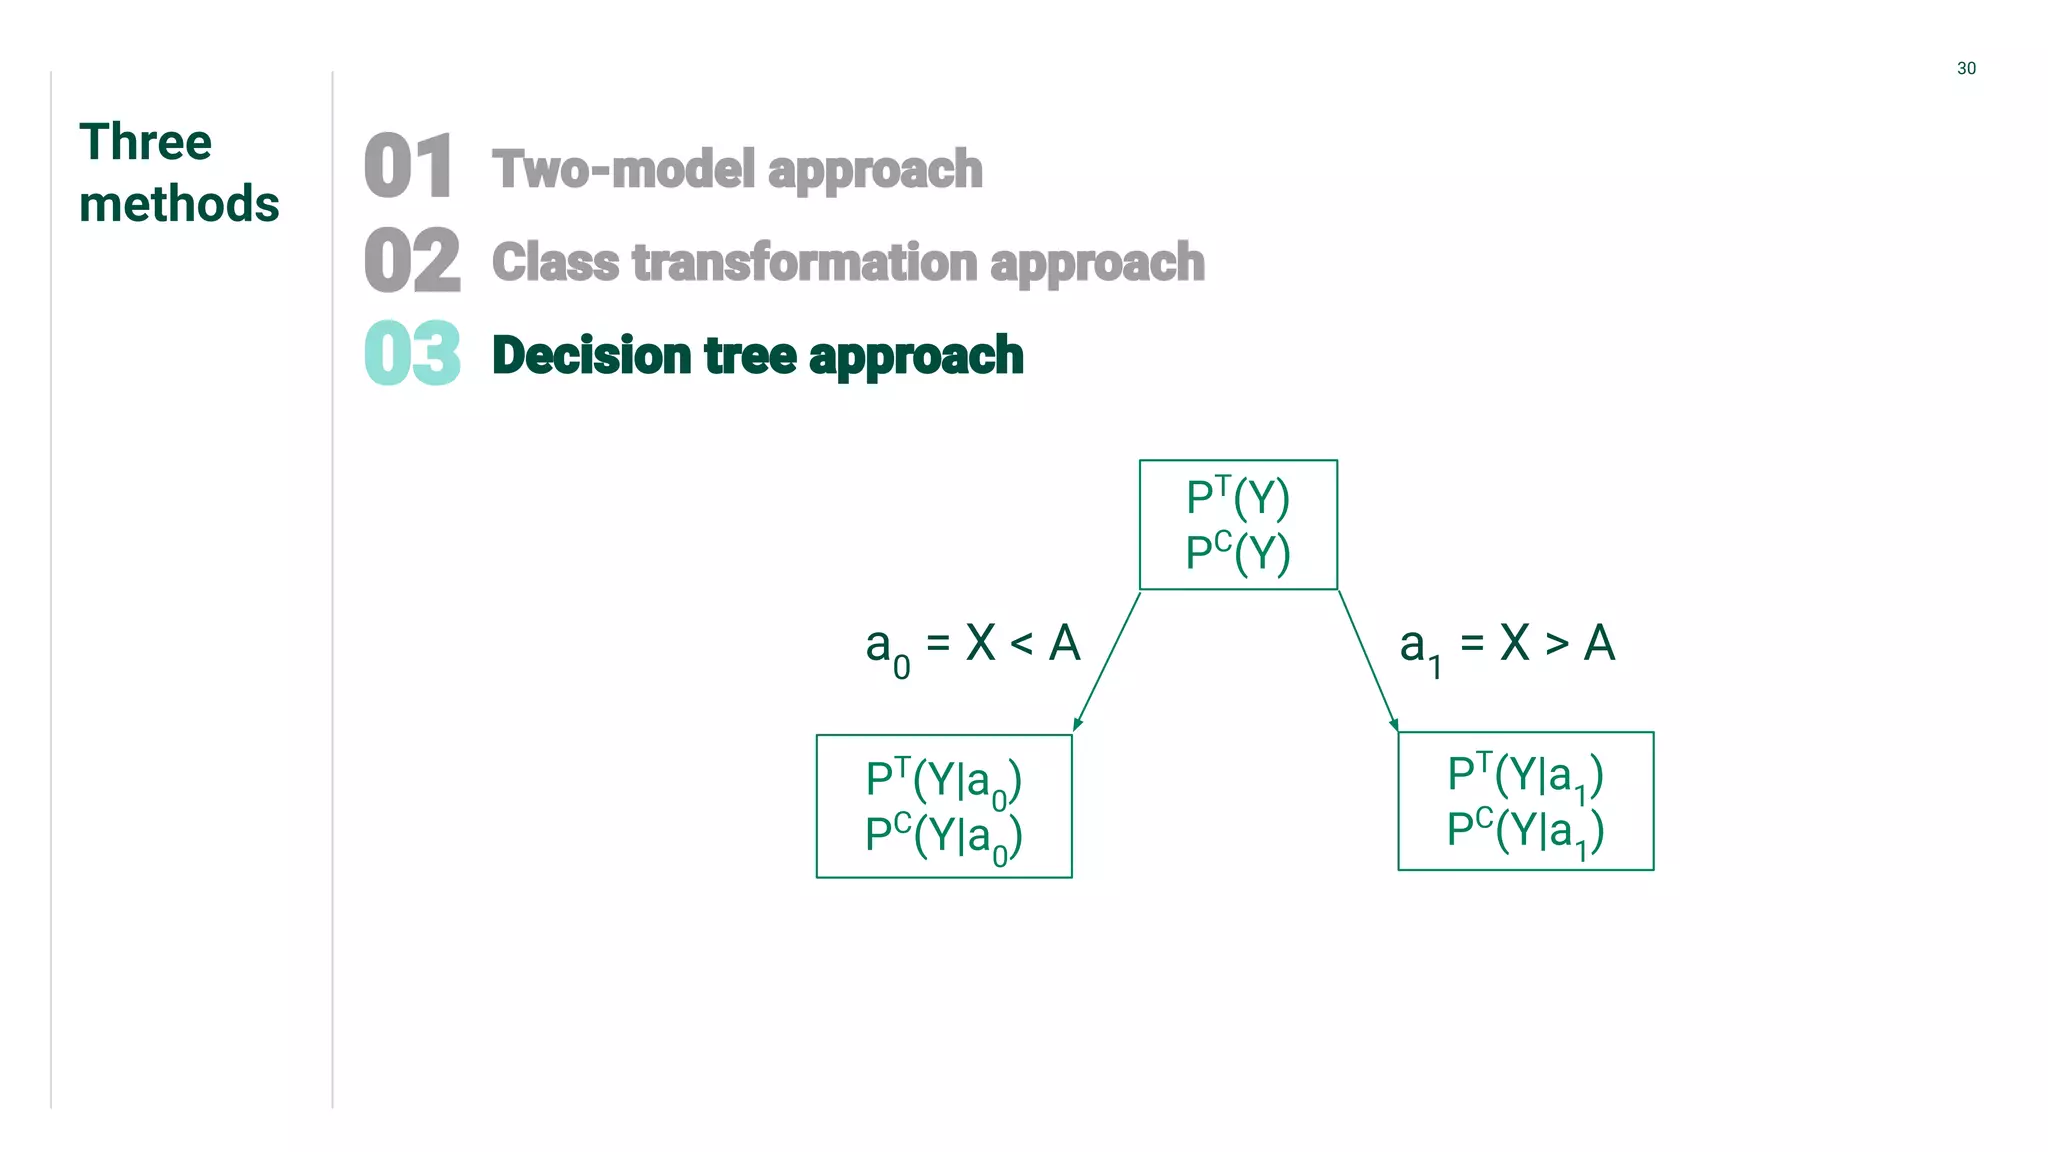
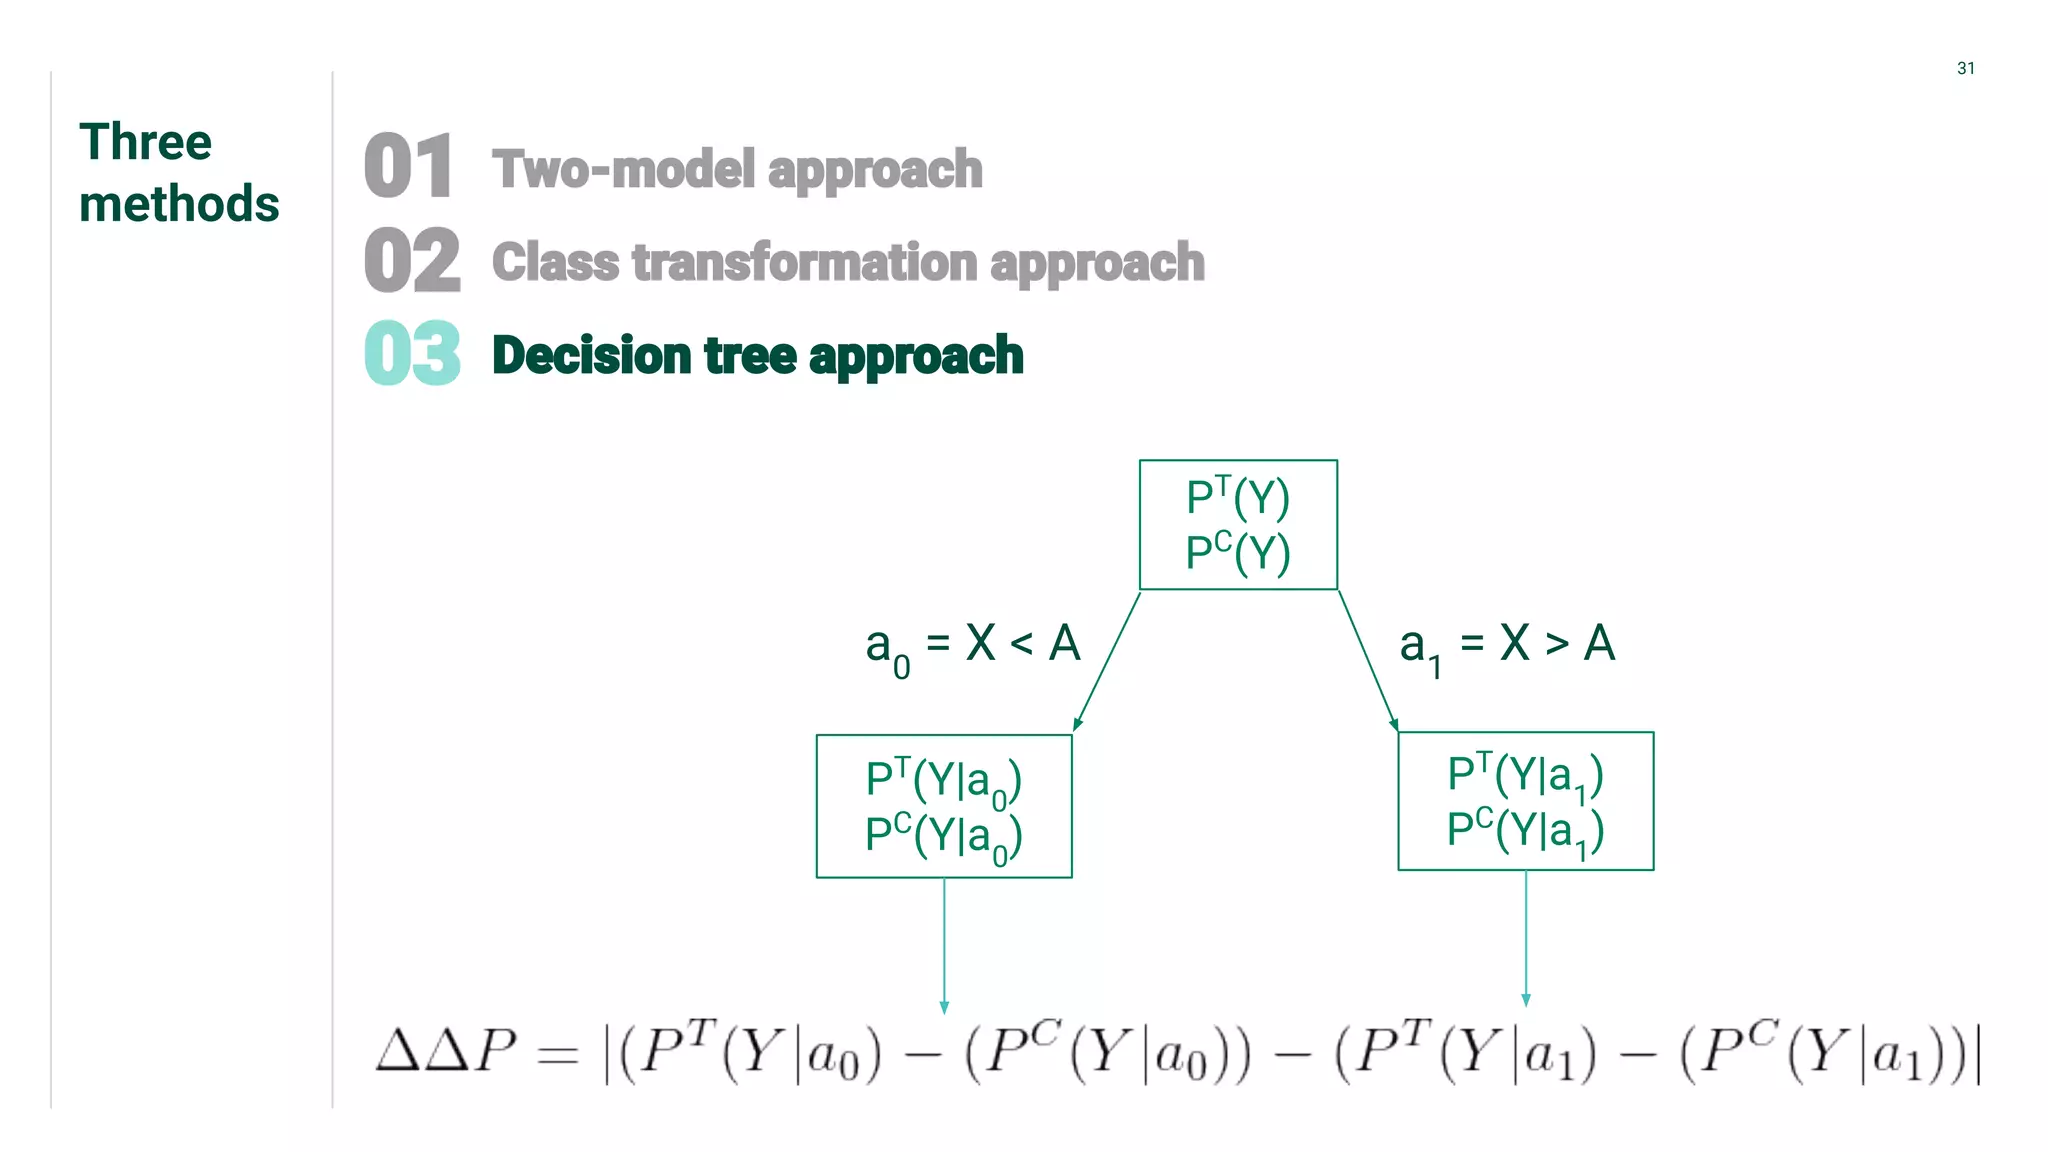
Three different methods for uplift modeling, emphasizing the use of E[Yi(treatment)|Xi] and balancing outcomes.
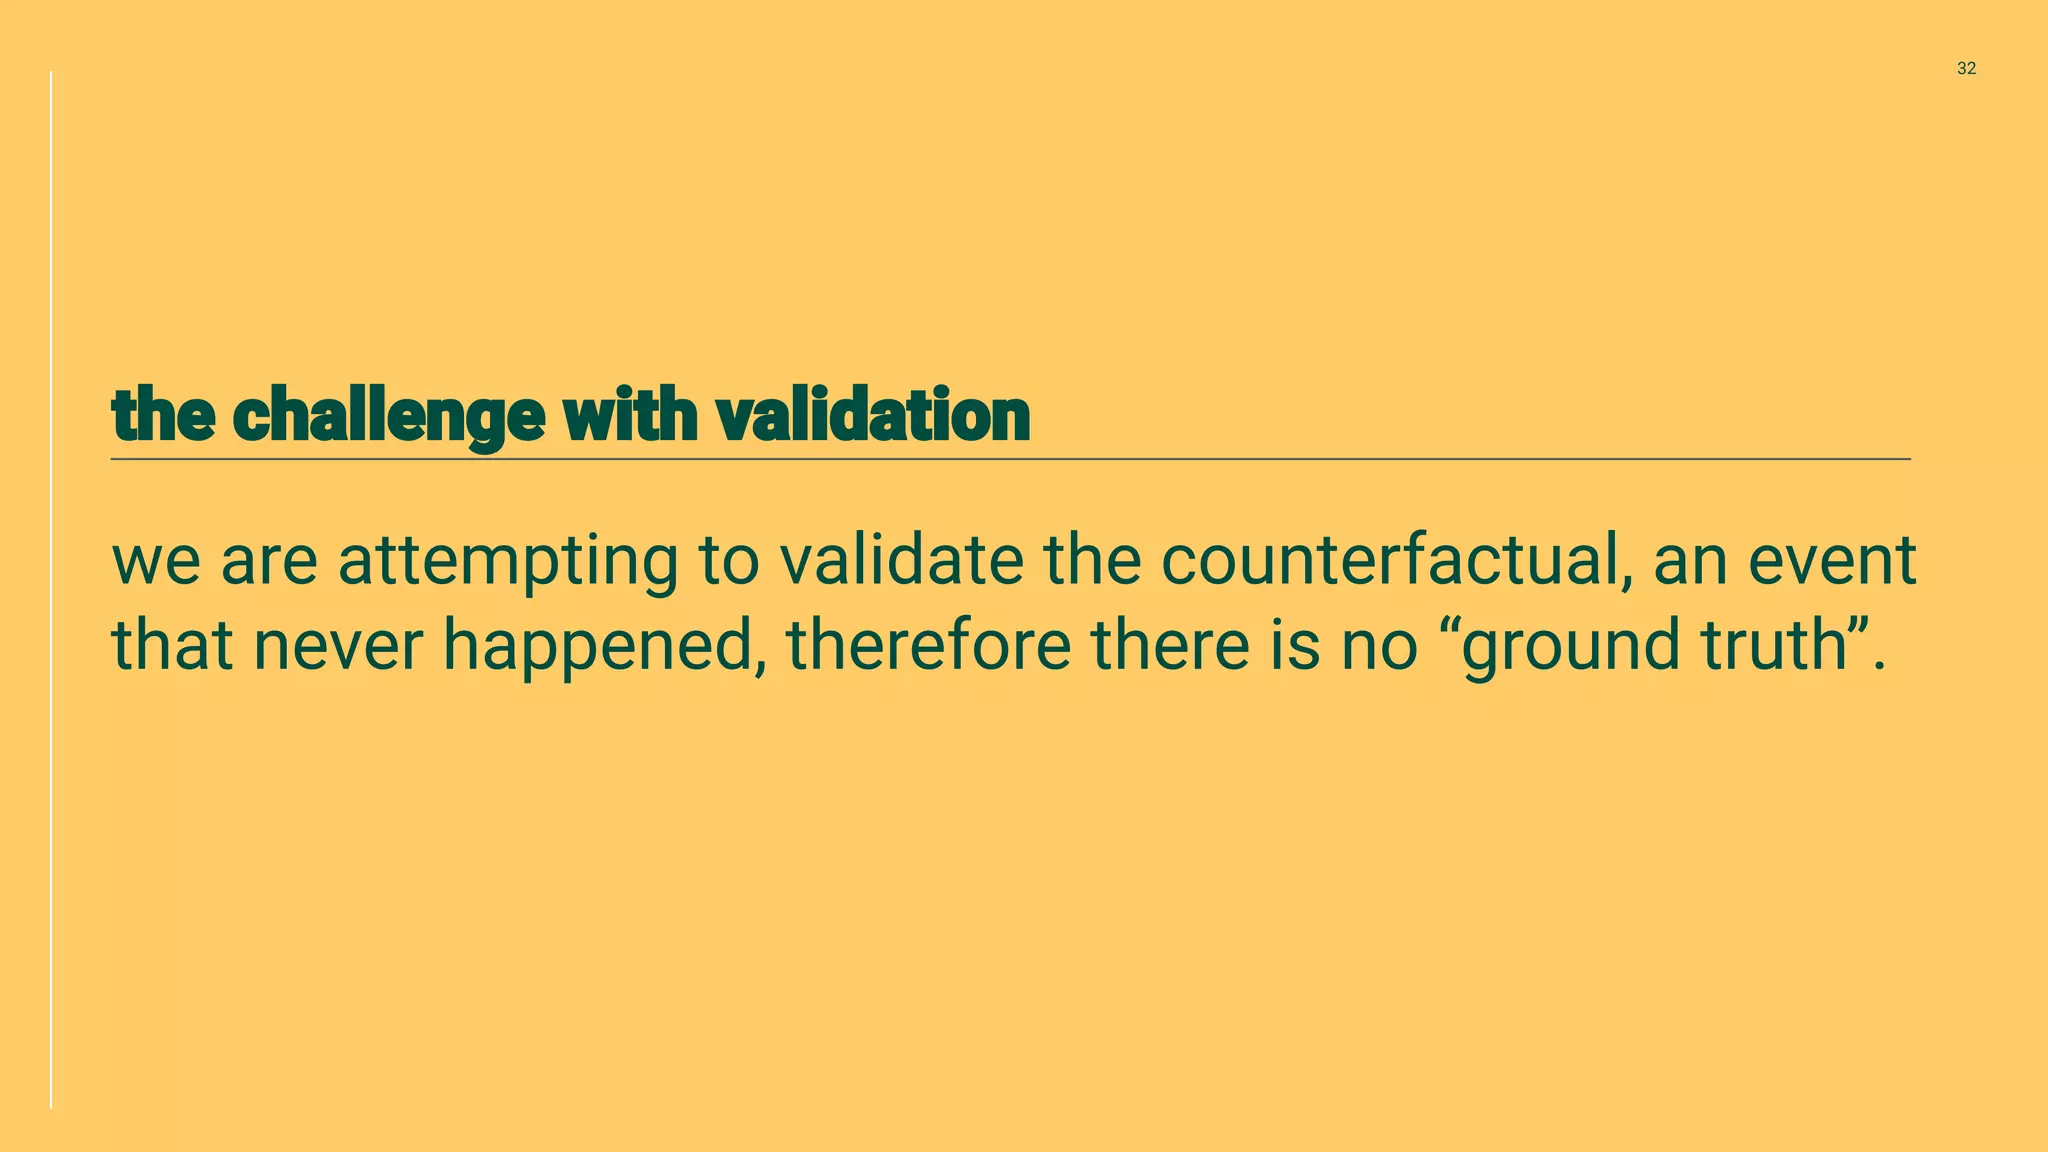
Techniques for validating counterfactuals and plotting uplift curves to compare methodologies.
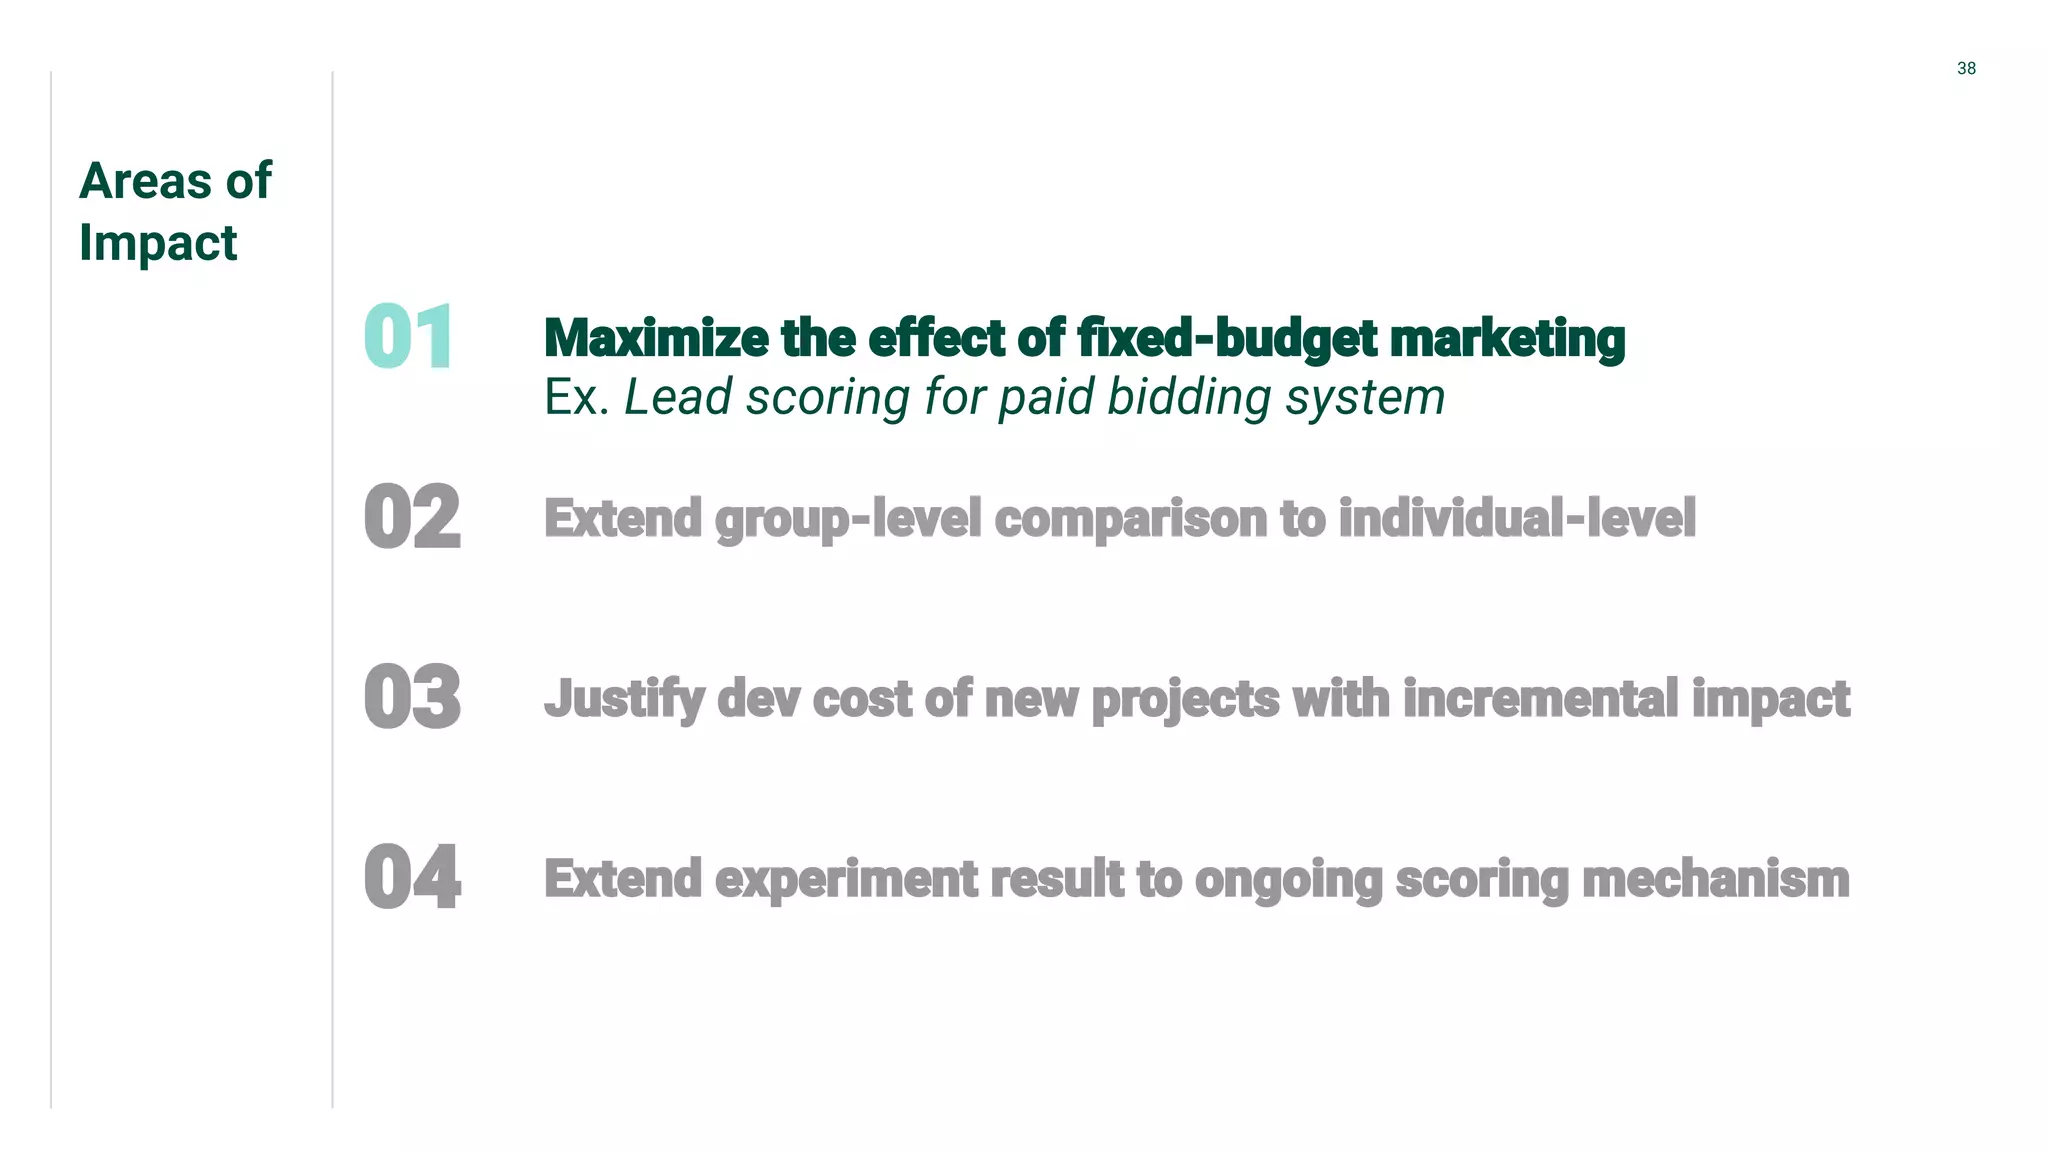
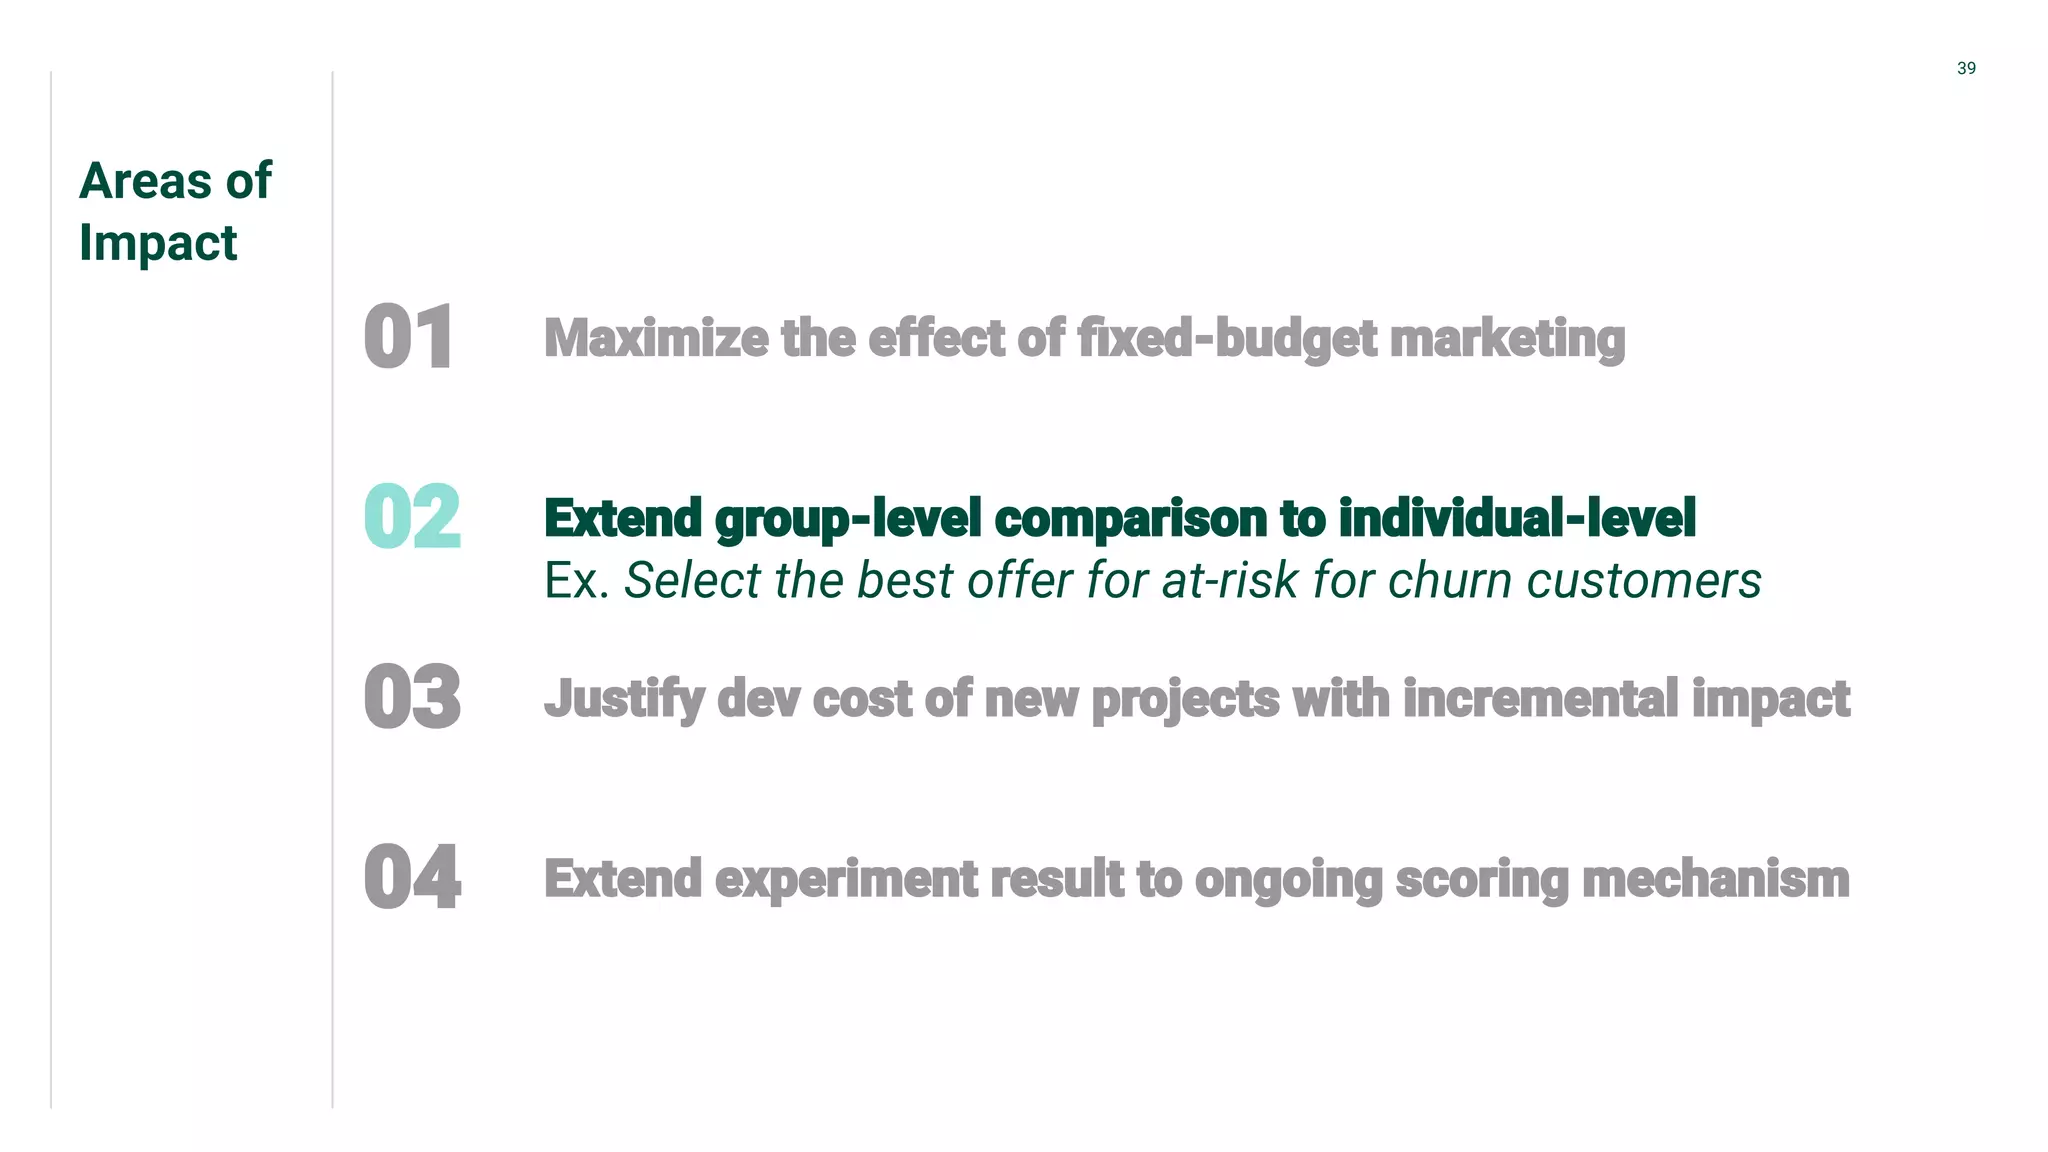
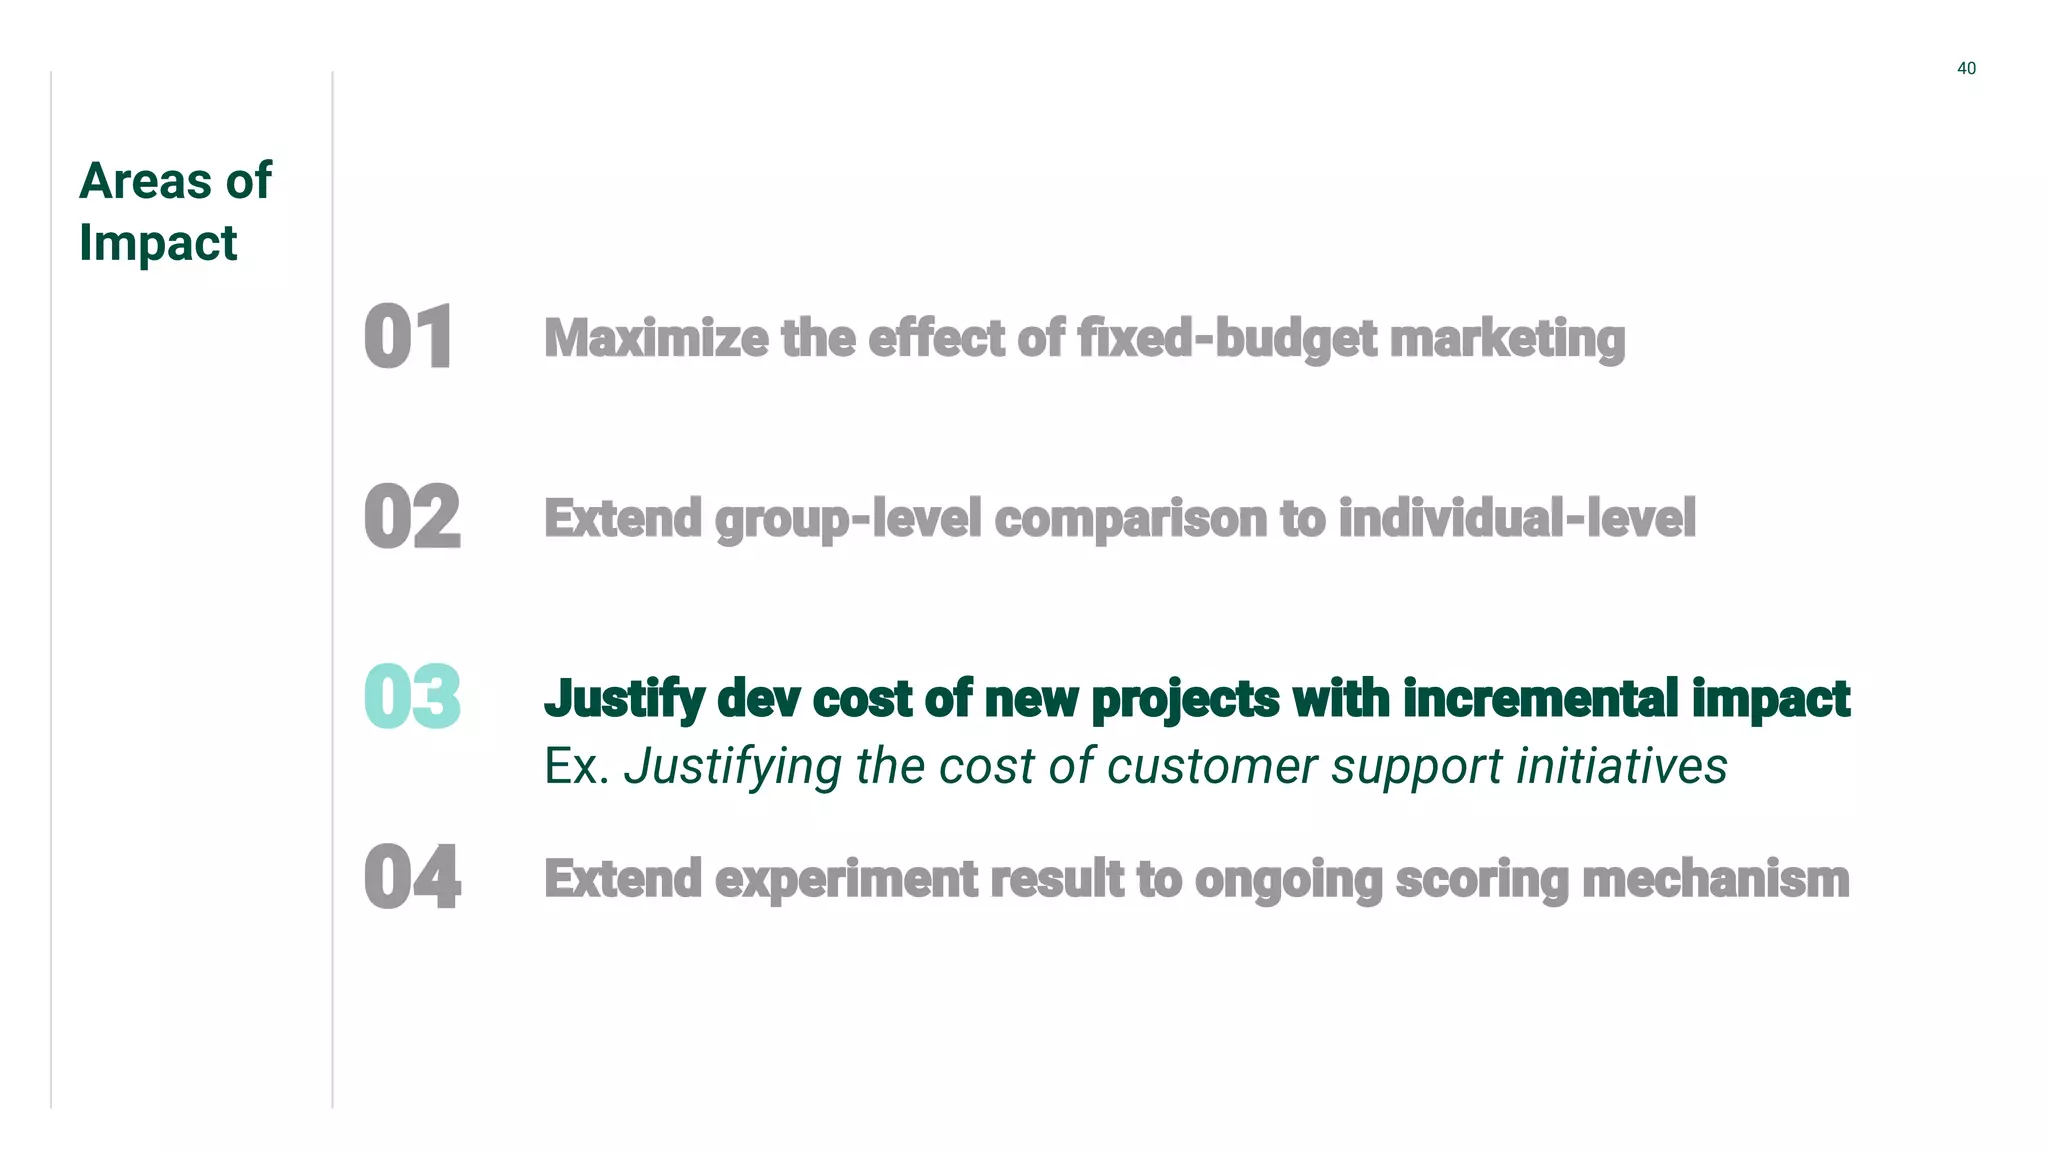
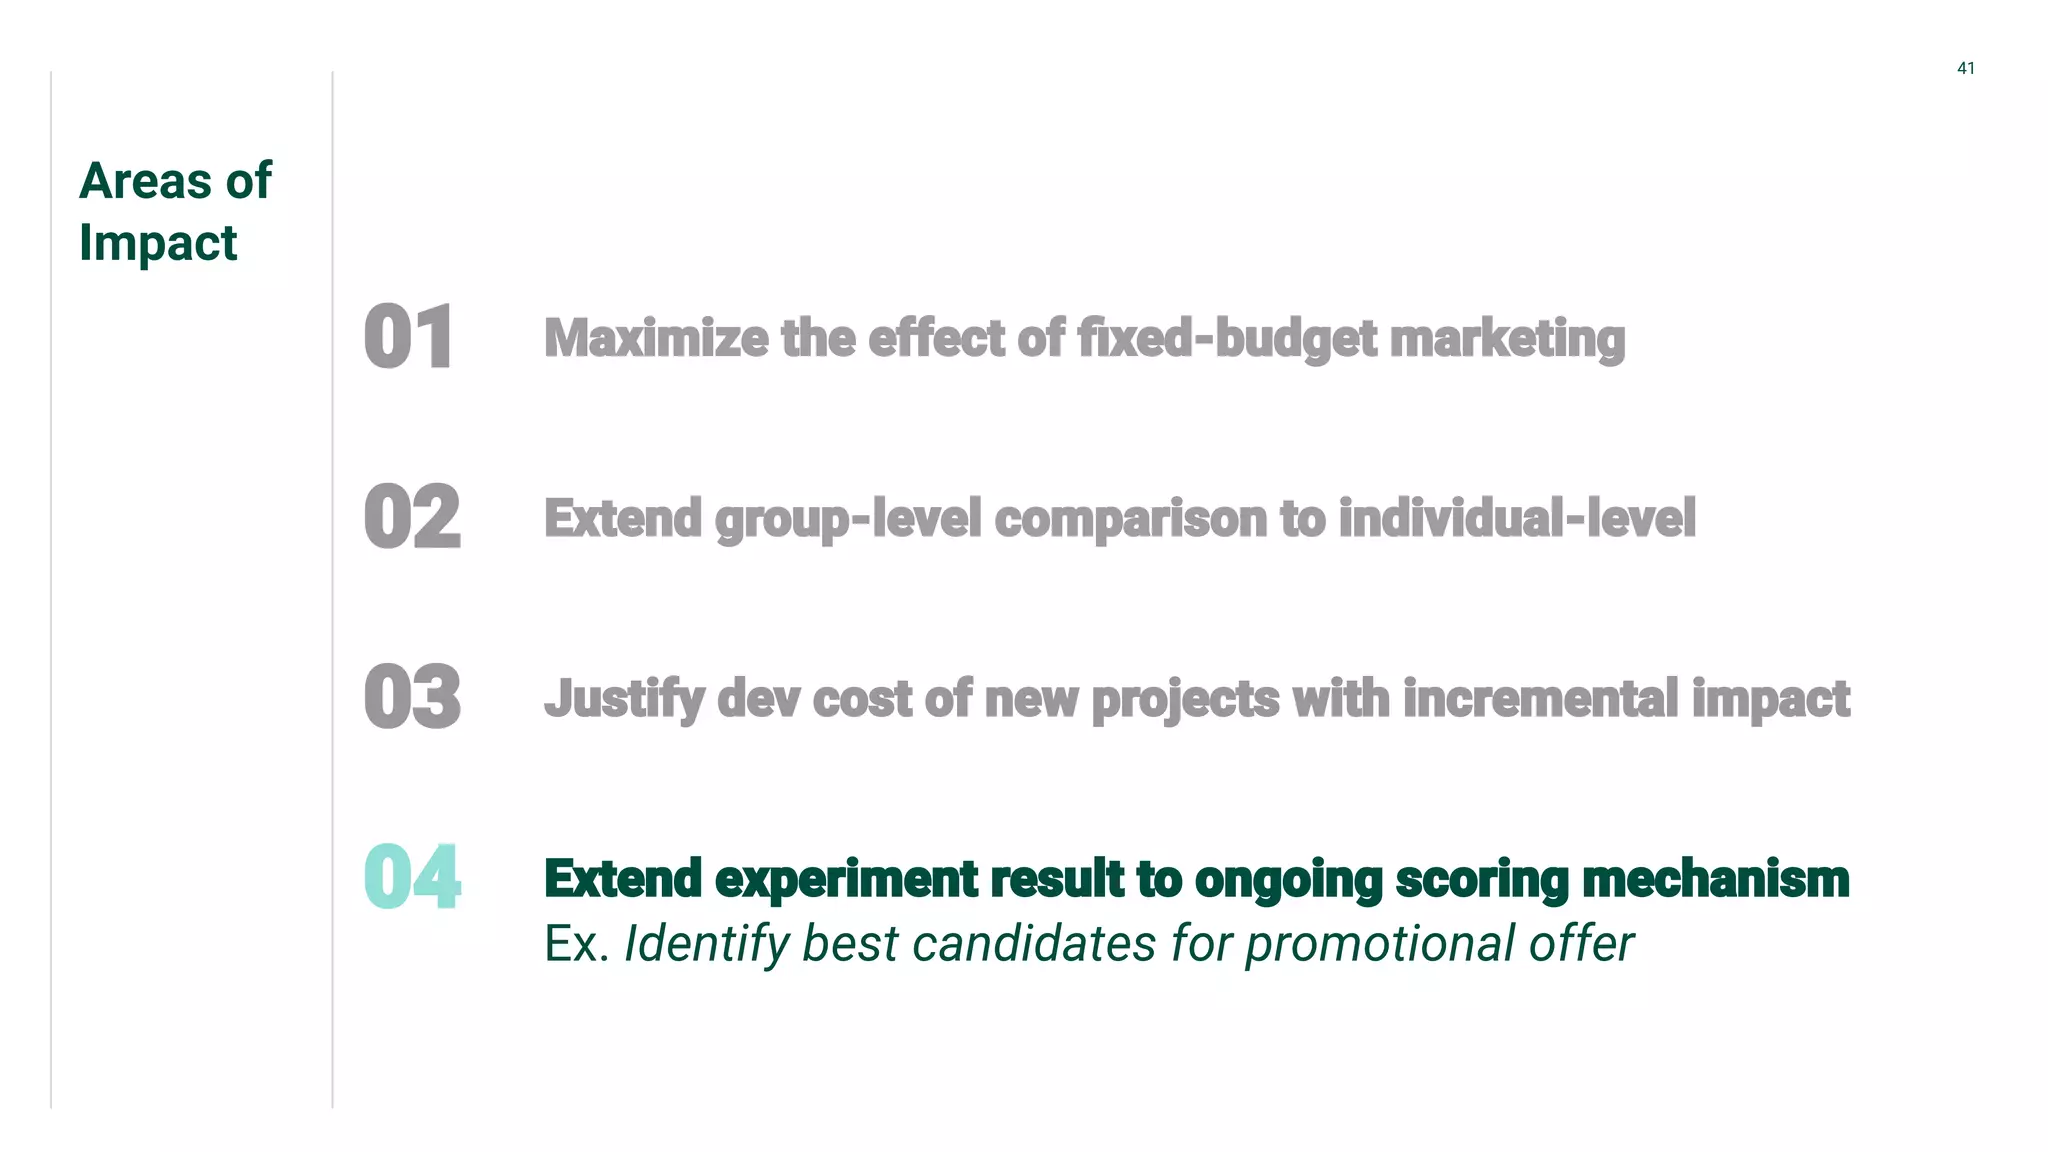
Various real-world applications of uplift modeling in lead scoring, retention strategies, and support justification.
Citations of key literature and methodologies related to uplift modeling research.


![[DSC Europe 25] Debmalya Biswas - Agentification: the art of transforming man...](https://cdn.slidesharecdn.com/ss_thumbnails/r5azlggvtqiaiiusrqdr-4-251212103249-5a12c89b-thumbnail.jpg?width=640&height=640&fit=bounds)
![[DSC Europe 25] Katherine Forrest - AI NOW: Understanding the Velocity of Cha...](https://cdn.slidesharecdn.com/ss_thumbnails/wvvbruqfrci0sfq9xwgb-4-251212104007-e5ad1987-thumbnail.jpg?width=640&height=640&fit=bounds)
![[DSC Europe 25] Bassam Maharmeh - Artificial Intelligence: Opportunities and ...](https://cdn.slidesharecdn.com/ss_thumbnails/thhfmr2fqpawzj7hsjpg-5-251211083048-2c23204f-thumbnail.jpg?width=640&height=640&fit=bounds)
![[DSC Europe 25] Jovan Bogicevic - Legacy to AI-Driven Defense: Transforming D...](https://cdn.slidesharecdn.com/ss_thumbnails/rsarluadt563hntyfc8q-3-251211083849-3e7bc4c0-thumbnail.jpg?width=640&height=640&fit=bounds)


![[DSC Europe 25] Aleksandra Dragicevic - AI-Boosted Research in Healthcare: Fr...](https://cdn.slidesharecdn.com/ss_thumbnails/iqwngszurf2r7pi1lnnj-4-aleksandra-dragicevic-ad-dsc-europe-conference-20-251208151905-37c3238a-thumbnail.jpg?width=640&height=640&fit=bounds)


![[DSC Europe 25] Dobrica Cosic - Savings by the Second: How Dynamic Pricing an...](https://cdn.slidesharecdn.com/ss_thumbnails/znp09f3smtqz3w2sq6wn-1-dobrica-cosic-savings-by-the-second-how-dynamic-pricing-and-smart-data-are-bu-251208151905-26e6f41e-thumbnail.jpg?width=640&height=640&fit=bounds)

![[DSC Europe 25] Milan Zdravkovic - The road less traveled in District Heating...](https://cdn.slidesharecdn.com/ss_thumbnails/nfaboniqwsz4ucyctnmy-2-milan-zdravkovic-dsc2025-the-road-less-traveled-in-district-heating-operation-251208151905-f56388a5-thumbnail.jpg?width=640&height=640&fit=bounds)
![[DSC Europe 25] Sara Polak - The Archaeology of Innovation: AI as the Next Cr...](https://cdn.slidesharecdn.com/ss_thumbnails/7ecbscdnt8mlcuqbd2ln-2-sara-polak-ai-creative-industries-251208152533-aa1fcf54-thumbnail.jpg?width=640&height=640&fit=bounds)

![[DSC Europe 25] Nikola Rajovic - Hardware Technologies Under the Hood: RISC-V...](https://cdn.slidesharecdn.com/ss_thumbnails/o2gptrmtoyqndgoshwgq-dsc2025-tenstorrent-rajovic-251205090438-814685f5-thumbnail.jpg?width=640&height=640&fit=bounds)