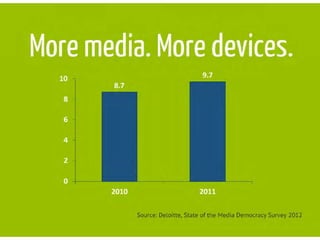
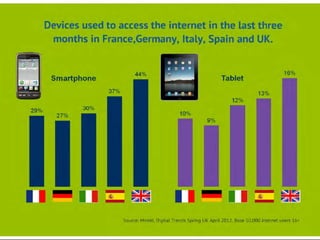
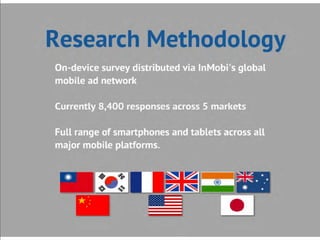
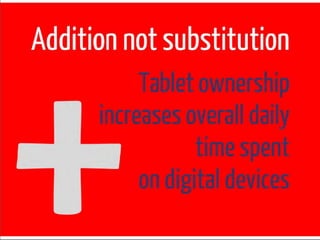
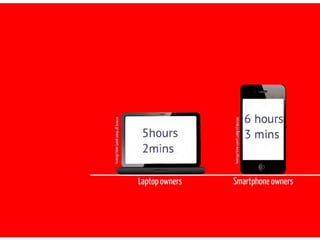
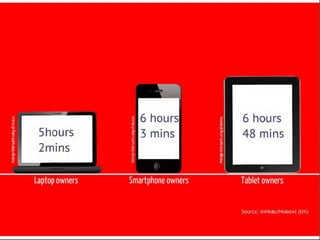
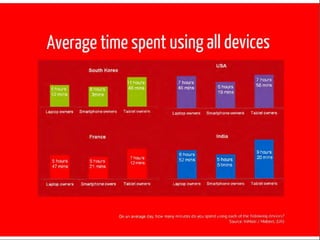
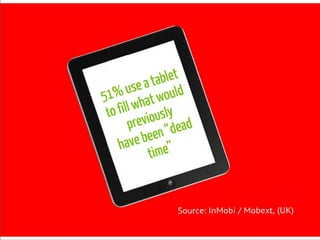
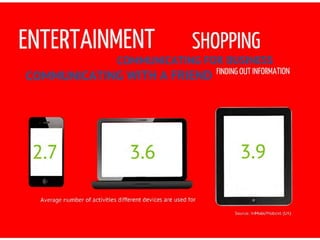
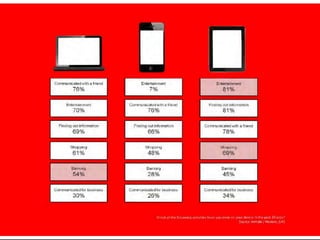
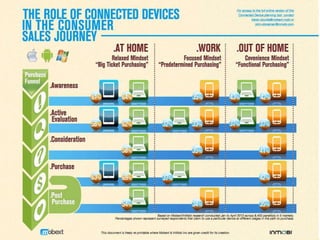
kieran.bourke@mobext.com
pilar.barrio@socialyse.co.uk
Context


Methodology


 Findings
Context
Growth of in-home devices to access media


         10                               9.7
                    8.7
          8

          6

          4

          2

          0
                   2010                  2011


                                Source:Deloitte, State of the Media Democracy Survey 2012
Device growth fuelled by tablets in the UK


                                 5
    Millions of Tablet owners


                                       72%
                                4.5    growth in only 7 months to Jan 12

                                 4          12% of the UK
                                       population are now
                                        owners of tablet
                                3.5         devices


                                 3


                                2.5
                                      Jun     Jul   Aug     Sep   Oct    Nov     Dec     Jan


                                                                   Source: comScore Mobilens July 2011- Jan 12, eMarketer
The UK is leading the way in technology adoption
Devices used to access the internet in the last three months in France,
Germany, Italy, Spain and UK.


                                   44%                                                               16%
        Smartphone                                                        Tablet
                         37%                                                              13%
                                                                              12%
  29%            30%
         27%                                           10%
                                                                    9%


                         Source: Mintel: Digital Trends Spring UK, April 2012, Base 10,000 internet users 16+
...and UK growth looks set to continue


                     Almost a third of non tablet
                   owners are likely to purchase one
                        in the next 6 months

                     65% of tablet owners agree that
                   tablets will be very common in the
                                   future


                                                        Source: InMobi / Mobext – UK
Methodology
Methodology
Research Objectives

• To conduct the first global on
  device study of consumer use
  of tablets, smartphones and
  laptops
• To understand the difference
  in usage and behaviour
  across the 3 devices
• To identify the role that tablets
  play in the path to purchase
Research Methodology


• On-device survey distributed via InMobi's global mobile ad
  network
• Currently 8,400 responses across 5 markets
• Full range of smartphones and tablets across all major
  mobile OS platforms.
Findings
Key Insights

1. This is a love story
44% would not want to be separated
         from their tablet

   42% say the their tablet has
   revolutionised the way they
communicate with friends/colleagues

 49% share their tablets with family
            members


                                       Source: InMobi / Mobext, (UK)
Tablet use peaks between 6pm and midnight – and is
mainly used at home


                                            Source: InMobi / Mobext - UK
Key Insights

1. This is a love story
2. Addition not substitution - tablet owners spend more time with digital
   devices
Key Insights

1. This is a love story
2. Addition not substitution - tablet owners spend more time with digital
   devices
Key Insights

1. This is a love story
2. Addition not substitution - tablet owners spend more time with digital
   devices
Key Insights

1. This is a love story
2. Addition not substitution - tablet owners spend more time with digital
   devices
Tablet ownership increases overall daily time spent
on digital devices


                 Average time spent using all devices


                                                   6 hours
                             6 hours               48 mins
                              3 mins
       5 hours
        2 mins


     Laptop owners      Smartphone owners       Tablet owners


                                                        Source: InMobi / Mobext (UK)
And this pattern is replicated across markets


                                          Average time spent using all devices
                      France                                                        South Korea
                                                                                                       11 hours
                                           7 hours
                                                                  8 hours           8 hours             46 mins
  5 hours             5 hours              12 mins
                                                                  42 mins            3mins
  47 mins             21 mins


Laptop owners    Smartphone owers     Tablet owners             Laptop owners   Smartphone owners     Tablet owners


                                USA                                                 India

                                                     7 hours      6 hours                               9 hours
            7 hours
                                6 hours              58 mins      52 mins           5 hours             20 mins
            46 mins
                                19 mins                                             51mins


                                                                Laptop owners   Smartphone owners     Tablet owners
        Laptop owners    Smartphone owners      Tablet owners


                                                                                                    Source: InMobi / Mobext
51% use a tablet to fill
what would previously
have been “dead time”


                            Source: InMobi / Mobext. UK
Key Insights

1. This is a love story
2. Addition not substitution - tablet owners spend more time with digital
   devices
3. Tablets are used in equal measure for entertainment and life admin
UK shows the highest levels of dual screening across the
   globe


                                                                     South
                  Watching TV whilst using device   France   India   Korea   UK      US      Av
                  Laptop/Desktop                    46.7%    36.4%   23.4%   57.0%   50.7%   42.9%
                  Smartphone                        34.6%    33.8%   25.1%   47.9%   41.2%   36.5%
                  Tablet                            47.3%    41.0%   33.1%   72.0%   58.5%   50.4%


Source: Inmobi / Mobext
Tablets used for a wide variety of activities


         Average number of activities different devices are used for


       2.7                                3.6
                                                                      3.9


             Communicated with a friend                Banking

        Communicated for business purposes      Finding out information

                     Shopping                       Entertainment


                                                                     Source: InMobi / Mobext, (UK)
Tablets are used in equal measure for both functional
and entertainment


   Communicated with a                                     Entertainment
                                 Entertainment
        friend                                                 81%
                                     79%
         76%
                             Communicated with a       Finding out information
       Entertainment
                                  friend                        81%
           70%
                                   76%
                                                       Communicated with a
   Finding out information   Finding out information        friend
            69%                       66%                    78%
         Shopping                  Shopping                  Shopping
           61%                       48%                       69%

          Banking                   Banking                   Banking
           54%                       28%                       45%
     Communicated for          Communicated for          Communicated for
        business                  business                  business
          30%                       26%                       34%


                                                              Source: InMobi / Mobext (UK)
Key Insights

1. This is a love story
2. Addition not substitution - tablet owners spend more time with digital
   devices
3. Tablets are used in equal measure for entertainment and life admin
4. Media content is easy to access and tablets are having an impact on
   offline print readership
5. Whilst tablet usage is high across all markets, the UK leads the way in
   dual screening and purchase
6. Tablets have a key role to play across the purchase funnel
So what does this mean for
brands?


CHILL-TERTAINMENT       CLOSE AND         SYNC IT
Targeting consumers     PERSONAL          Nothing works in
when they are relaxed   Building deeper   isolation
                        connections
INDEX values summary (UK Only)
By LOCATION                                          Purchase Funnel


                                                                                         Post Purchase
                              Awareness   Consideration   Active Evaluation   Purchase
                                                                                          Experience
    INDEX

    Home

    LAPTOP / DESKTOP             144          132               141             158          122
    SMARTPHONE                   124          118               125             125          106
    TABLET                       168          123               161             174          117


    Work / College

    LAPTOP / DESKTOP             73            75                73              84           68
    SMARTPHONE                   86            86                81              82           82
    TABLET                       76            66                70              79           64


    OOH

    LAPTOP / DESKTOP             98            90                84              83           75
    SMARTPHONE                   104          100                92             103           86
    TABLET                       91            80                86              85           61


Source: Inmobi / Mobext, UK
‘Feel’ is tomorrow’s battleground for customer engagement
– Senseg.com
Thank you!

   Kieran Bourke, Managing Director, Mobext

04 2 00 mobext global tablet research final v2

  • 1.
  • 3.
  • 4.
  • 5.
    Growth of in-homedevices to access media 10 9.7 8.7 8 6 4 2 0 2010 2011 Source:Deloitte, State of the Media Democracy Survey 2012
  • 6.
    Growth of in-homedevices to access media 10 9.7 8.7 8 6 4 2 0 2010 2011 Source:Deloitte, State of the Media Democracy Survey 2012
  • 7.
    Device growth fuelledby tablets in the UK 5 Millions of Tablet owners 72% 4.5 growth in only 7 months to Jan 12 4 12% of the UK population are now owners of tablet 3.5 devices 3 2.5 Jun Jul Aug Sep Oct Nov Dec Jan Source: comScore Mobilens July 2011- Jan 12, eMarketer
  • 8.
    Device growth fuelledby tablets in the UK 5 Millions of Tablet owners 72% 4.5 growth in only 7 months to Jan 12 4 12% of the UK population are now owners of tablet 3.5 devices 3 2.5 Jun Jul Aug Sep Oct Nov Dec Jan Source: comScore Mobilens July 2011- Jan 12, eMarketer
  • 9.
    The UK isleading the way in technology adoption Devices used to access the internet in the last three months in France, Germany, Italy, Spain and UK. 44% 16% Smartphone Tablet 37% 13% 12% 29% 30% 27% 10% 9% Source: Mintel: Digital Trends Spring UK, April 2012, Base 10,000 internet users 16+
  • 10.
    The UK isleading the way in technology adoption Devices used to access the internet in the last three months in France, Germany, Italy, Spain and UK. 44% 16% Smartphone Tablet 37% 13% 12% 29% 30% 27% 10% 9% Source: Mintel: Digital Trends Spring UK, April 2012, Base 10,000 internet users 16+
  • 11.
    ...and UK growthlooks set to continue Almost a third of non tablet owners are likely to purchase one in the next 6 months 65% of tablet owners agree that tablets will be very common in the future Source: InMobi / Mobext – UK
  • 13.
  • 14.
  • 15.
    Research Objectives • Toconduct the first global on device study of consumer use of tablets, smartphones and laptops • To understand the difference in usage and behaviour across the 3 devices • To identify the role that tablets play in the path to purchase
  • 16.
    Research Methodology • On-devicesurvey distributed via InMobi's global mobile ad network • Currently 8,400 responses across 5 markets • Full range of smartphones and tablets across all major mobile OS platforms.
  • 17.
  • 18.
    Key Insights 1. Thisis a love story
  • 19.
    44% would notwant to be separated from their tablet 42% say the their tablet has revolutionised the way they communicate with friends/colleagues 49% share their tablets with family members Source: InMobi / Mobext, (UK)
  • 20.
    Tablet use peaksbetween 6pm and midnight – and is mainly used at home Source: InMobi / Mobext - UK
  • 21.
    Key Insights 1. Thisis a love story 2. Addition not substitution - tablet owners spend more time with digital devices
  • 22.
    Key Insights 1. Thisis a love story 2. Addition not substitution - tablet owners spend more time with digital devices
  • 23.
    Key Insights 1. Thisis a love story 2. Addition not substitution - tablet owners spend more time with digital devices
  • 24.
    Key Insights 1. Thisis a love story 2. Addition not substitution - tablet owners spend more time with digital devices
  • 25.
    Tablet ownership increasesoverall daily time spent on digital devices Average time spent using all devices 6 hours 6 hours 48 mins 3 mins 5 hours 2 mins Laptop owners Smartphone owners Tablet owners Source: InMobi / Mobext (UK)
  • 26.
    And this patternis replicated across markets Average time spent using all devices France South Korea 11 hours 7 hours 8 hours 8 hours 46 mins 5 hours 5 hours 12 mins 42 mins 3mins 47 mins 21 mins Laptop owners Smartphone owers Tablet owners Laptop owners Smartphone owners Tablet owners USA India 7 hours 6 hours 9 hours 7 hours 6 hours 58 mins 52 mins 5 hours 20 mins 46 mins 19 mins 51mins Laptop owners Smartphone owners Tablet owners Laptop owners Smartphone owners Tablet owners Source: InMobi / Mobext
  • 27.
    51% use atablet to fill what would previously have been “dead time” Source: InMobi / Mobext. UK
  • 28.
    Key Insights 1. Thisis a love story 2. Addition not substitution - tablet owners spend more time with digital devices 3. Tablets are used in equal measure for entertainment and life admin
  • 29.
    UK shows thehighest levels of dual screening across the globe South Watching TV whilst using device France India Korea UK US Av Laptop/Desktop 46.7% 36.4% 23.4% 57.0% 50.7% 42.9% Smartphone 34.6% 33.8% 25.1% 47.9% 41.2% 36.5% Tablet 47.3% 41.0% 33.1% 72.0% 58.5% 50.4% Source: Inmobi / Mobext
  • 30.
    Tablets used fora wide variety of activities Average number of activities different devices are used for 2.7 3.6 3.9 Communicated with a friend Banking Communicated for business purposes Finding out information Shopping Entertainment Source: InMobi / Mobext, (UK)
  • 31.
    Tablets are usedin equal measure for both functional and entertainment Communicated with a Entertainment Entertainment friend 81% 79% 76% Communicated with a Finding out information Entertainment friend 81% 70% 76% Communicated with a Finding out information Finding out information friend 69% 66% 78% Shopping Shopping Shopping 61% 48% 69% Banking Banking Banking 54% 28% 45% Communicated for Communicated for Communicated for business business business 30% 26% 34% Source: InMobi / Mobext (UK)
  • 32.
    Key Insights 1. Thisis a love story 2. Addition not substitution - tablet owners spend more time with digital devices 3. Tablets are used in equal measure for entertainment and life admin 4. Media content is easy to access and tablets are having an impact on offline print readership 5. Whilst tablet usage is high across all markets, the UK leads the way in dual screening and purchase 6. Tablets have a key role to play across the purchase funnel
  • 33.
    So what doesthis mean for brands? CHILL-TERTAINMENT CLOSE AND SYNC IT Targeting consumers PERSONAL Nothing works in when they are relaxed Building deeper isolation connections
  • 34.
    INDEX values summary(UK Only) By LOCATION Purchase Funnel Post Purchase Awareness Consideration Active Evaluation Purchase Experience INDEX Home LAPTOP / DESKTOP 144 132 141 158 122 SMARTPHONE 124 118 125 125 106 TABLET 168 123 161 174 117 Work / College LAPTOP / DESKTOP 73 75 73 84 68 SMARTPHONE 86 86 81 82 82 TABLET 76 66 70 79 64 OOH LAPTOP / DESKTOP 98 90 84 83 75 SMARTPHONE 104 100 92 103 86 TABLET 91 80 86 85 61 Source: Inmobi / Mobext, UK
  • 35.
    ‘Feel’ is tomorrow’sbattleground for customer engagement – Senseg.com
  • 36.
    Thank you! Kieran Bourke, Managing Director, Mobext