The document discusses several key topics relating to population:
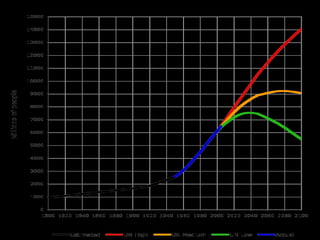
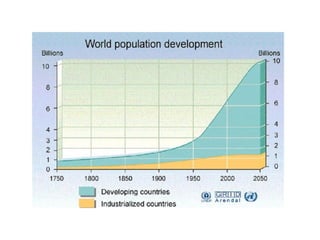
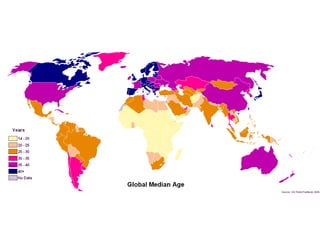
- World population has grown from 1 billion to over 7 billion in the last 200 years. Demography statistically studies human populations and helps understand population change.
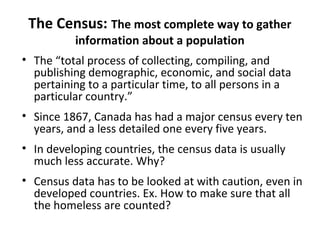
- Censuses gather important demographic, economic and social data about populations every 5-10 years in developed countries, though data is less accurate in developing nations.
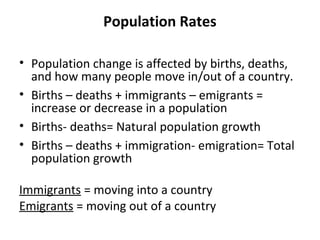
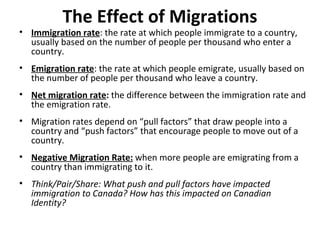
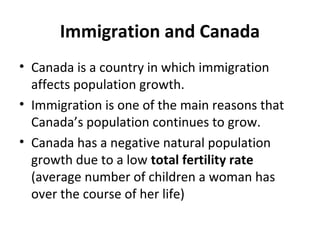
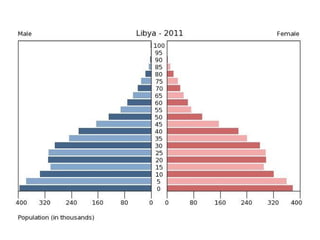
- Population change is influenced by births, deaths, and migration. Immigration is a major driver of population growth in Canada due to low fertility rates.
GEOGRAPHY YEAR 10: DEVELOPMENT. CONTRASTS IN DEVELOPMENT. George Dumitrache
GEOGRAPHY YEAR 10: CONTRASTS IN DEVELOPMENT. It contains: economic development, human development, development indicators, health indicators, industry indicators, education indicators.
GEOGRAPHY YEAR 10: DEVELOPMENT. CONTRASTS IN DEVELOPMENT. George Dumitrache
GEOGRAPHY YEAR 10: CONTRASTS IN DEVELOPMENT. It contains: economic development, human development, development indicators, health indicators, industry indicators, education indicators.
More recently another measure, the Human Development Index (HDI), which combines an economic measure, national income, with other measures, indices for life expectancy and education has become prominent. This criterion would define developed countries as those with a very high (HDI) rating. A developing country, also called a less developed country is a nation with a less developed industrial base, and a low Human Development Index (HDI) relative to developed countries.
Developing countries are, in general, countries that have not achieved a significant degree of industrialization relative to their populations, and have, in most cases, a medium to low standard of living. There is a strong association between low income and high population growth. The World Bank classifies all low- and middle-income countries as developing but notes, "The use of the term is convenient; it is not intended to imply that all economies in the group are experiencing similar development or that other economies have reached a preferred or final stage of development. Classification by income does not necessarily reflect development status. gender equity refers to the economic, social, political, and cultural attributes and opportunities associated with being male or female.
I’m a young Pakistani Blogger, Academic Writer, Freelancer, Quaidian & MPhil Scholar, Quote Lover, Co-Founder at Essar Student Fund & Blueprism Academia, belonging from Mehdiabad, Skardu, Gilgit Baltistan, Pakistan.
I am an academic writer & freelancer! I can work on Research Paper, Thesis Writing, Academic Research, Research Project, Proposals, Assignments, Business Plans, and Case study research.
Expertise:
Management Sciences, Business Management, Marketing, HRM, Banking, Business Marketing, Corporate Finance, International Business Management
For Order Online:
Whatsapp: +923452502478
Portfolio Link: https://blueprismacademia.wordpress.com/
Email: arguni.hasnain@gmail.com
Follow Me:
Linkedin: arguni_hasnain
Instagram : arguni.hasnain
Facebook: arguni.hasnain
These comprehensive slides on demography provide a deep understanding of the science of population dynamics. Covering essential concepts, methodologies, and key demographic indicators, these notes offer insights into the study of population growth, distribution, and composition. Explore topics such as fertility, mortality, migration, and population projections, as well as their implications for society and policy. With this resource, you'll gain a strong foundation in demography, making it an invaluable reference for students, researchers, and anyone interested in the dynamics of human populations.
JMeter webinar - integration with InfluxDB and GrafanaRTTS
Watch this recorded webinar about real-time monitoring of application performance. See how to integrate Apache JMeter, the open-source leader in performance testing, with InfluxDB, the open-source time-series database, and Grafana, the open-source analytics and visualization application.
In this webinar, we will review the benefits of leveraging InfluxDB and Grafana when executing load tests and demonstrate how these tools are used to visualize performance metrics.
Length: 30 minutes
Session Overview
-------------------------------------------
During this webinar, we will cover the following topics while demonstrating the integrations of JMeter, InfluxDB and Grafana:
- What out-of-the-box solutions are available for real-time monitoring JMeter tests?
- What are the benefits of integrating InfluxDB and Grafana into the load testing stack?
- Which features are provided by Grafana?
- Demonstration of InfluxDB and Grafana using a practice web application
To view the webinar recording, go to:
https://www.rttsweb.com/jmeter-integration-webinar
Generating a custom Ruby SDK for your web service or Rails API using Smithyg2nightmarescribd
Have you ever wanted a Ruby client API to communicate with your web service? Smithy is a protocol-agnostic language for defining services and SDKs. Smithy Ruby is an implementation of Smithy that generates a Ruby SDK using a Smithy model. In this talk, we will explore Smithy and Smithy Ruby to learn how to generate custom feature-rich SDKs that can communicate with any web service, such as a Rails JSON API.
Securing your Kubernetes cluster_ a step-by-step guide to success !KatiaHIMEUR1
Today, after several years of existence, an extremely active community and an ultra-dynamic ecosystem, Kubernetes has established itself as the de facto standard in container orchestration. Thanks to a wide range of managed services, it has never been so easy to set up a ready-to-use Kubernetes cluster.
However, this ease of use means that the subject of security in Kubernetes is often left for later, or even neglected. This exposes companies to significant risks.
In this talk, I'll show you step-by-step how to secure your Kubernetes cluster for greater peace of mind and reliability.
Smart TV Buyer Insights Survey 2024 by 91mobiles.pdf91mobiles
91mobiles recently conducted a Smart TV Buyer Insights Survey in which we asked over 3,000 respondents about the TV they own, aspects they look at on a new TV, and their TV buying preferences.
UiPath Test Automation using UiPath Test Suite series, part 4DianaGray10
Welcome to UiPath Test Automation using UiPath Test Suite series part 4. In this session, we will cover Test Manager overview along with SAP heatmap.
The UiPath Test Manager overview with SAP heatmap webinar offers a concise yet comprehensive exploration of the role of a Test Manager within SAP environments, coupled with the utilization of heatmaps for effective testing strategies.
Participants will gain insights into the responsibilities, challenges, and best practices associated with test management in SAP projects. Additionally, the webinar delves into the significance of heatmaps as a visual aid for identifying testing priorities, areas of risk, and resource allocation within SAP landscapes. Through this session, attendees can expect to enhance their understanding of test management principles while learning practical approaches to optimize testing processes in SAP environments using heatmap visualization techniques
What will you get from this session?
1. Insights into SAP testing best practices
2. Heatmap utilization for testing
3. Optimization of testing processes
4. Demo
Topics covered:
Execution from the test manager
Orchestrator execution result
Defect reporting
SAP heatmap example with demo
Speaker:
Deepak Rai, Automation Practice Lead, Boundaryless Group and UiPath MVP
DevOps and Testing slides at DASA ConnectKari Kakkonen
My and Rik Marselis slides at 30.5.2024 DASA Connect conference. We discuss about what is testing, then what is agile testing and finally what is Testing in DevOps. Finally we had lovely workshop with the participants trying to find out different ways to think about quality and testing in different parts of the DevOps infinity loop.
GraphRAG is All You need? LLM & Knowledge GraphGuy Korland
Guy Korland, CEO and Co-founder of FalkorDB, will review two articles on the integration of language models with knowledge graphs.
1. Unifying Large Language Models and Knowledge Graphs: A Roadmap.
https://arxiv.org/abs/2306.08302
2. Microsoft Research's GraphRAG paper and a review paper on various uses of knowledge graphs:
https://www.microsoft.com/en-us/research/blog/graphrag-unlocking-llm-discovery-on-narrative-private-data/
Software Delivery At the Speed of AI: Inflectra Invests In AI-Powered QualityInflectra
In this insightful webinar, Inflectra explores how artificial intelligence (AI) is transforming software development and testing. Discover how AI-powered tools are revolutionizing every stage of the software development lifecycle (SDLC), from design and prototyping to testing, deployment, and monitoring.
Learn about:
• The Future of Testing: How AI is shifting testing towards verification, analysis, and higher-level skills, while reducing repetitive tasks.
• Test Automation: How AI-powered test case generation, optimization, and self-healing tests are making testing more efficient and effective.
• Visual Testing: Explore the emerging capabilities of AI in visual testing and how it's set to revolutionize UI verification.
• Inflectra's AI Solutions: See demonstrations of Inflectra's cutting-edge AI tools like the ChatGPT plugin and Azure Open AI platform, designed to streamline your testing process.
Whether you're a developer, tester, or QA professional, this webinar will give you valuable insights into how AI is shaping the future of software delivery.
Slack (or Teams) Automation for Bonterra Impact Management (fka Social Soluti...Jeffrey Haguewood
Sidekick Solutions uses Bonterra Impact Management (fka Social Solutions Apricot) and automation solutions to integrate data for business workflows.
We believe integration and automation are essential to user experience and the promise of efficient work through technology. Automation is the critical ingredient to realizing that full vision. We develop integration products and services for Bonterra Case Management software to support the deployment of automations for a variety of use cases.
This video focuses on the notifications, alerts, and approval requests using Slack for Bonterra Impact Management. The solutions covered in this webinar can also be deployed for Microsoft Teams.
Interested in deploying notification automations for Bonterra Impact Management? Contact us at sales@sidekicksolutionsllc.com to discuss next steps.
State of ICS and IoT Cyber Threat Landscape Report 2024 previewPrayukth K V
The IoT and OT threat landscape report has been prepared by the Threat Research Team at Sectrio using data from Sectrio, cyber threat intelligence farming facilities spread across over 85 cities around the world. In addition, Sectrio also runs AI-based advanced threat and payload engagement facilities that serve as sinks to attract and engage sophisticated threat actors, and newer malware including new variants and latent threats that are at an earlier stage of development.
The latest edition of the OT/ICS and IoT security Threat Landscape Report 2024 also covers:
State of global ICS asset and network exposure
Sectoral targets and attacks as well as the cost of ransom
Global APT activity, AI usage, actor and tactic profiles, and implications
Rise in volumes of AI-powered cyberattacks
Major cyber events in 2024
Malware and malicious payload trends
Cyberattack types and targets
Vulnerability exploit attempts on CVEs
Attacks on counties – USA
Expansion of bot farms – how, where, and why
In-depth analysis of the cyber threat landscape across North America, South America, Europe, APAC, and the Middle East
Why are attacks on smart factories rising?
Cyber risk predictions
Axis of attacks – Europe
Systemic attacks in the Middle East
Download the full report from here:
https://sectrio.com/resources/ot-threat-landscape-reports/sectrio-releases-ot-ics-and-iot-security-threat-landscape-report-2024/
2. World Population:
7+ billion and counting
• Around 200 years ago, the world had a population of
around 1 billion people. Today, there are more than
7+ billion people on the planet.
3.
4. Demography
• Demography: the statistical study of human
populations.
• Demography helps us to understand the causes
and consequences of population change.
• Population change in your community, in Canada,
and all over the world is important and ongoing
concern to agencies such as government and
business.
• Why do you think that population growth is
important for these agencies?
5. The Census: The most complete way to gather
information about a population
• The “total process of collecting, compiling, and
publishing demographic, economic, and social data
pertaining to a particular time, to all persons in a
particular country.”
• Since 1867, Canada has had a major census every ten
years, and a less detailed one every five years.
• In developing countries, the census data is usually
much less accurate. Why?
• Census data has to be looked at with caution, even in
developed countries. Ex. How to make sure that all
the homeless are counted?
6. Population Rates
• Population change is affected by births, deaths,
and how many people move in/out of a country.
• Births – deaths + immigrants – emigrants =
increase or decrease in a population
• Births- deaths= Natural population growth
• Births – deaths + immigration- emigration= Total
population growth
Immigrants = moving into a country
Emigrants = moving out of a country
7. The Effect of Migrations
• Immigration rate: the rate at which people immigrate to a country,
usually based on the number of people per thousand who enter a
country.
• Emigration rate: the rate at which people emigrate, usually based on
the number of people per thousand who leave a country.
• Net migration rate: the difference between the immigration rate and
the emigration rate.
• Migration rates depend on “pull factors” that draw people into a
country and “push factors” that encourage people to move out of a
country.
• Negative Migration Rate: when more people are emigrating from a
country than immigrating to it.
• Think/Pair/Share: What push and pull factors have impacted
immigration to Canada? How has this impacted on Canadian
Identity?
8. Immigration and Canada
• Canada is a country in which immigration
affects population growth.
• Immigration is one of the main reasons that
Canada’s population continues to grow.
• Canada has a negative natural population
growth due to a low total fertility rate
(average number of children a woman has
over the course of her life)
9. China’s “One Child Policy”
• Nearly 1/5 of the world lives in China. Even though growth rates are
below the world average, China adds nearly 20 million children to its
population each year. That is over half of the population of Canada!
Being dependent on agriculture, and only having 15% of their land
suitable for cultivation, 20 million more mouths to feed is a huge
amount.
• In 1980, the Chinese government launched a new policy of one child
per family. Cash rewards, free medical care, and improved
educational and housing opportunities were given to those families
who only had one child. People who did not cooperate were fined for
each child they had after their first born, and lost many privileges. In
some cases, if the first child was a girl (sons were valued as labourers
and expected to look after their parents in old age) or born with a
disability, a family was allowed to have another.
• Think/Pair/Share: Should the government have the authority to
dictate how many children people have? What is the solution to the
Global population problem? What are the possible drawbacks of a
“one child” policy?
10.
11. Comparing births and deaths across
populations
• Since the countries of the world have very different
populations, it is important not to simply look at the
number of births and deaths because it is not very
useful. This is why demographers measure birth
rates and death rates.
• The crude birth rate and the crude death rate are
expressed in a number per thousand.
13. The Rule of Seventy
• Doubling time is the period of years in which it takes
for a country to double its population (at its current
birth rate).
• It is approximately equal to seventy divided by the
growth rate (%) per year.
• The Malthusian growth model, sometimes called the
simple exponential growth model, is essentially a
model of exponential population growth.
• Named after the Reverend Thomas Malthus, who
wrote An Essay on the Principle of Population, early
book on human population.
14.
15. Population Distribution
• The way that people are spaced over the earth’s surface.
• Approximately 35% of the world’s land area is not good for
settlement. Where would this include?
• Ecumene: the permanently inhabited portion of the earth as
distinguished from the uninhabited or temporarily inhabited
area.
• The carrying capacity of a species in an environment is the
maximum population size of the species that the environment
can sustain indefinitely, given the food, habitat, water and
other necessities available in the environment.
• Did you know?
Over half of the world’s population lives on only 5% of the
land, and 90% of people live on 20% of the land!
18. Population Density
• Population Density: the number of people living per
unit of an area (e.g. per square kilometer)
• Reasons for Population Density:
• Job opportunities
• Housing
• Weather climates
• Economics
• Education
19. Nutritional Density
• Nutritional Density: a measure of how much
nutrition in calories can be produced from the
land.
• Ex. The Fraser Valley has rich soil but has a short
growing season, unlike somewhere like Southern
China, which has an ideal climate for agriculture.
While the Fraser Valley produces one crop per
year, China will produce three, resulting in far
more food per km² of farmland.
20. The Demographic Transition Model
• Shows change over a period of time in three
elements: birth rates, death rates and trends
in overall population numbers
• Assumes that in any country, high birth rates
and high death rates will gradually fall, as
developing countries pass through periods of
industrialization and urbanization.
21. There are five stages to the model:
• Stage 1: High birth and death rates means there is no longterm natural increase
• Stage 2: High birth rates and declining death rates produce
high rates of population growth
• Stage 3: Both birth rates and death rates decline and the rate
of natural increase begins to slow down.
• Stage 4: Low birth and death rates produce no long-term
natural increase.
• Stage 5: Really low birth rate and low death rate allows for
the decrease in population.
• Where is Canada in this model?
23. The Age Structure of Populations
• Dependency Ratio: the proportion of the
population that is being supported by the working
age group.
• Dependents are the people who are either too
young (under 15) or too old (over 65) to support
themselves.
• A high dependency ratio places a higher financial
burden on those who work, because they have
more people to support.
24. Think/Pair/Share:
•
•
What is the significance of the dependency
ratio? Why is it important for a country to know
this figure?
What type of problems could be created by an
aging population? What types of problems
might be associated with a large percentage of
very young people?
25. The Population Pyramid
• A population pyramid is a graph that shows the age and sex structure
of a population.
• Important because all countries have distinct population structures.
• Their shapes vary according to the % of people in each age group and
the distribution between men and women.
• A Population Pyramid shows the % of the total population in five year
age groups (known as cohorts) beginning with 0-4 years at the bottom,
and ending with the oldest age group at the top.
• The shape of a population pyramid is determined by the crude birth
rate, (number of live births per 1000 people in a given year). Its shape
can be affected by other factors as well (a lower life expectancy, war,
malnutrition, etc)
• A high crude birth rate translates into a relatively high number of
children, and creates a broad pyramid base. If a country has a low
crude birth rate and a large number of older people, the upper
sections of the pyramid are wider.
26. Population Pyramid Shapes
There are four types:
• Early Expanding (ex. Nigeria): very high birth rate, high death
rate, a lower life expectancy
• Expanding (ex. Venezuela): still high birth rate (but more
infants are surviving the first 5 years), lower death rate, a
longer life expectancy, population is growing slowly.
• Stable (ex. France): a lower birth rate, not as big of a slope.
Because of a lower death rate and longer life expectancy,
population typically stays the same, or grows slowly.
• Contracting (ex. Germany): very low birth rate, still a lower
death rate, population as a result is not increasing through
natural growth.