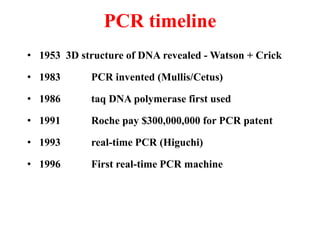
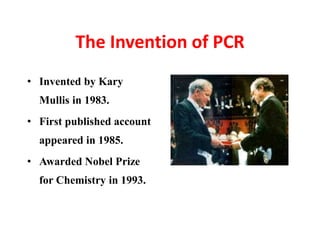
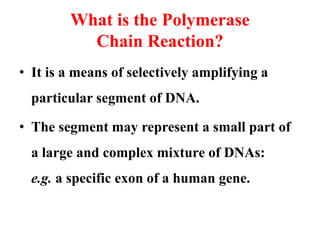
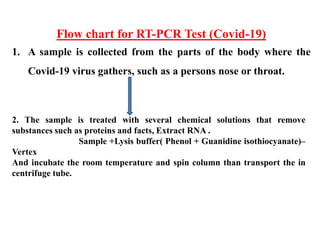
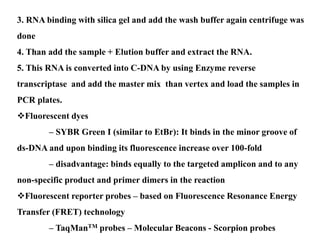
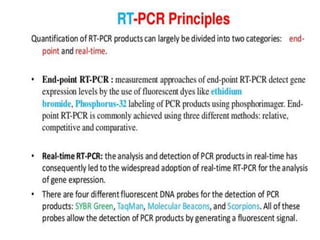
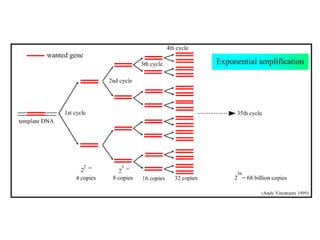
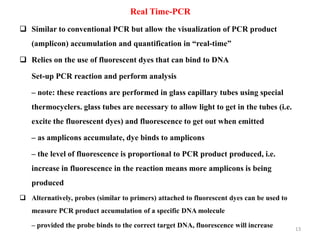
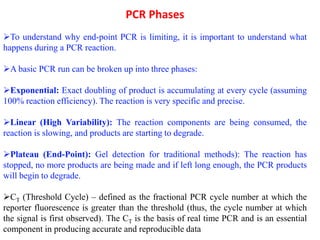
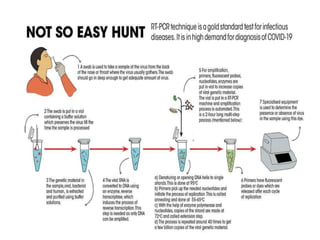
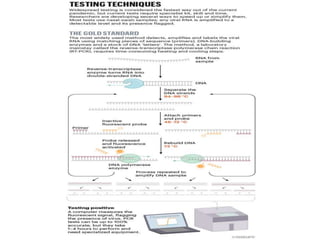
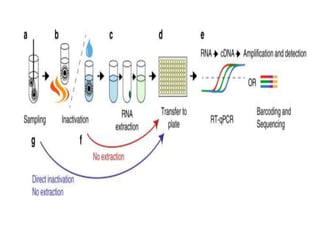
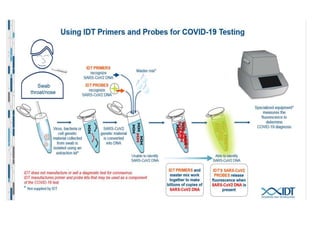
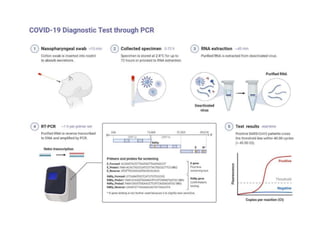
Polymerase Chain Reaction(PCR)
 According to microbiologists, RT-PCR revolutionized
the way clinical microbiology laboratories diagnose
many human microbial infection.
 For the detection of Covid-19 real time polymerase
chain reaction test, most commonly known as RT-PCR
test is being widely used.
 But this RT-PCR is not limited to detection of the
SARS-Cov-2.
 Nucleic acid test, the polymerase chain
reaction(PCR) method is considered as the “
gold standard” for the detection of some viruses
and is characterized by rapid detection, high
sensitivity and specificity .
 As such real-time reverse transcriptase –
PCR(RT-PCR) is of great interest today for the
detection of SARS-Cov-2.
PCR timeline
• 1953 3D structure of DNA revealed - Watson + Crick
• 1983 PCR invented (Mullis/Cetus)
• 1986 taq DNA polymerase first used
• 1991 Roche pay $300,000,000 for PCR patent
• 1993 real-time PCR (Higuchi)
• 1996 First real-time PCR machine
The Invention of PCR
• Invented by Kary
Mullis in 1983.
• First published account
appeared in 1985.
• Awarded Nobel Prize
for Chemistry in 1993.
What is the Polymerase
Chain Reaction?
• It is a means of selectively amplifying a
particular segment of DNA.
• The segment may represent a small part of
a large and complex mixture of DNAs:
e.g. a specific exon of a human gene.
Flow chart for RT-PCR Test (Covid-19)
1. A sample is collected from the parts of the body where the
Covid-19 virus gathers, such as a persons nose or throat.
2. The sample is treated with several chemical solutions that remove
substances such as proteins and facts, Extract RNA .
Sample +Lysis buffer( Phenol + Guanidine isothiocyanate)–
Vertex
And incubate the room temperature and spin column than transport the in
centrifuge tube.
3. RNA binding with silica gel and add the wash buffer again centrifuge was
done
4. Than add the sample + Elution buffer and extract the RNA.
5. This RNA is converted into C-DNA by using Enzyme reverse
transcriptase and add the master mix than vertex and load the samples in
PCR plates.
Fluorescent dyes
– SYBR Green I (similar to EtBr): It binds in the minor groove of
ds-DNA and upon binding its fluorescence increase over 100-fold
– disadvantage: binds equally to the targeted amplicon and to any
non-specific product and primer dimers in the reaction
Fluorescent reporter probes – based on Fluorescence Resonance Energy
Transfer (FRET) technology
– TaqManTM probes – Molecular Beacons - Scorpion probes
Typical PCR mix
PCR components Amount
Template DNA (5-200 ng)
1 mM dNTPs (200 µM final)
10 X PCR buffer
25 mM MgCl2 (1.5 mM final)
20 uM forward primer (20 pmoles final)
20 uM reverse primer (20 pmoles final)
5 units/µL Taq DNA polymerase (1.5 units)
Water
Final Volume
variable
10.0 µL
5.0 µL
3.0 µL
1.0 µL
1.0 µL
0.3 µL
Variable
50.0 µL
13
Real Time-PCR
 Similar to conventional PCR but allow the visualization of PCR product
(amplicon) accumulation and quantification in “real-time”
 Relies on the use of fluorescent dyes that can bind to DNA
Set-up PCR reaction and perform analysis
– note: these reactions are performed in glass capillary tubes using special
thermocyclers. glass tubes are necessary to allow light to get in the tubes (i.e.
excite the fluorescent dyes) and fluorescence to get out when emitted
– as amplicons accumulate, dye binds to amplicons
– the level of fluorescence is proportional to PCR product produced, i.e.
increase in fluorescence in the reaction means more amplicons is being
produced
 Alternatively, probes (similar to primers) attached to fluorescent dyes can be used to
measure PCR product accumulation of a specific DNA molecule
– provided the probe binds to the correct target DNA, fluorescence will increase
How many cycles?
• Increasing the cycle
number above ~35 has
little positive effect.
• The plateau occurs
when:
– The reagents are depleted
– The products re-anneal
– The polymerase is
damaged
• Unwanted products
accumulate.
15
RT-PCR Amplification Curves
Cycle number
Fluorescence
(R
N
)
Exponential phase
Plateau
Threshold
CT
Baseline
Sample
PCR Phases
To understand why end-point PCR is limiting, it is important to understand what
happens during a PCR reaction.
A basic PCR run can be broken up into three phases:
Exponential: Exact doubling of product is accumulating at every cycle (assuming
100% reaction efficiency). The reaction is very specific and precise.
Linear (High Variability): The reaction components are being consumed, the
reaction is slowing, and products are starting to degrade.
Plateau (End-Point): Gel detection for traditional methods): The reaction has
stopped, no more products are being made and if left long enough, the PCR products
will begin to degrade.
CT (Threshold Cycle) – defined as the fractional PCR cycle number at which the
reporter fluorescence is greater than the threshold (thus, the cycle number at which
the signal is first observed). The CT is the basis of real time PCR and is an essential
component in producing accurate and reproducible data
Polymerase Chain Reaction

Polymerase Chain Reaction

  • 1.
  • 2.
     According tomicrobiologists, RT-PCR revolutionized the way clinical microbiology laboratories diagnose many human microbial infection.  For the detection of Covid-19 real time polymerase chain reaction test, most commonly known as RT-PCR test is being widely used.  But this RT-PCR is not limited to detection of the SARS-Cov-2.
  • 3.
     Nucleic acidtest, the polymerase chain reaction(PCR) method is considered as the “ gold standard” for the detection of some viruses and is characterized by rapid detection, high sensitivity and specificity .  As such real-time reverse transcriptase – PCR(RT-PCR) is of great interest today for the detection of SARS-Cov-2.
  • 4.
    PCR timeline • 19533D structure of DNA revealed - Watson + Crick • 1983 PCR invented (Mullis/Cetus) • 1986 taq DNA polymerase first used • 1991 Roche pay $300,000,000 for PCR patent • 1993 real-time PCR (Higuchi) • 1996 First real-time PCR machine
  • 5.
    The Invention ofPCR • Invented by Kary Mullis in 1983. • First published account appeared in 1985. • Awarded Nobel Prize for Chemistry in 1993.
  • 6.
    What is thePolymerase Chain Reaction? • It is a means of selectively amplifying a particular segment of DNA. • The segment may represent a small part of a large and complex mixture of DNAs: e.g. a specific exon of a human gene.
  • 7.
    Flow chart forRT-PCR Test (Covid-19) 1. A sample is collected from the parts of the body where the Covid-19 virus gathers, such as a persons nose or throat. 2. The sample is treated with several chemical solutions that remove substances such as proteins and facts, Extract RNA . Sample +Lysis buffer( Phenol + Guanidine isothiocyanate)– Vertex And incubate the room temperature and spin column than transport the in centrifuge tube.
  • 8.
    3. RNA bindingwith silica gel and add the wash buffer again centrifuge was done 4. Than add the sample + Elution buffer and extract the RNA. 5. This RNA is converted into C-DNA by using Enzyme reverse transcriptase and add the master mix than vertex and load the samples in PCR plates. Fluorescent dyes – SYBR Green I (similar to EtBr): It binds in the minor groove of ds-DNA and upon binding its fluorescence increase over 100-fold – disadvantage: binds equally to the targeted amplicon and to any non-specific product and primer dimers in the reaction Fluorescent reporter probes – based on Fluorescence Resonance Energy Transfer (FRET) technology – TaqManTM probes – Molecular Beacons - Scorpion probes
  • 10.
    Typical PCR mix PCRcomponents Amount Template DNA (5-200 ng) 1 mM dNTPs (200 µM final) 10 X PCR buffer 25 mM MgCl2 (1.5 mM final) 20 uM forward primer (20 pmoles final) 20 uM reverse primer (20 pmoles final) 5 units/µL Taq DNA polymerase (1.5 units) Water Final Volume variable 10.0 µL 5.0 µL 3.0 µL 1.0 µL 1.0 µL 0.3 µL Variable 50.0 µL
  • 13.
    13 Real Time-PCR  Similarto conventional PCR but allow the visualization of PCR product (amplicon) accumulation and quantification in “real-time”  Relies on the use of fluorescent dyes that can bind to DNA Set-up PCR reaction and perform analysis – note: these reactions are performed in glass capillary tubes using special thermocyclers. glass tubes are necessary to allow light to get in the tubes (i.e. excite the fluorescent dyes) and fluorescence to get out when emitted – as amplicons accumulate, dye binds to amplicons – the level of fluorescence is proportional to PCR product produced, i.e. increase in fluorescence in the reaction means more amplicons is being produced  Alternatively, probes (similar to primers) attached to fluorescent dyes can be used to measure PCR product accumulation of a specific DNA molecule – provided the probe binds to the correct target DNA, fluorescence will increase
  • 14.
    How many cycles? •Increasing the cycle number above ~35 has little positive effect. • The plateau occurs when: – The reagents are depleted – The products re-anneal – The polymerase is damaged • Unwanted products accumulate.
  • 15.
    15 RT-PCR Amplification Curves Cyclenumber Fluorescence (R N ) Exponential phase Plateau Threshold CT Baseline Sample
  • 16.
    PCR Phases To understandwhy end-point PCR is limiting, it is important to understand what happens during a PCR reaction. A basic PCR run can be broken up into three phases: Exponential: Exact doubling of product is accumulating at every cycle (assuming 100% reaction efficiency). The reaction is very specific and precise. Linear (High Variability): The reaction components are being consumed, the reaction is slowing, and products are starting to degrade. Plateau (End-Point): Gel detection for traditional methods): The reaction has stopped, no more products are being made and if left long enough, the PCR products will begin to degrade. CT (Threshold Cycle) – defined as the fractional PCR cycle number at which the reporter fluorescence is greater than the threshold (thus, the cycle number at which the signal is first observed). The CT is the basis of real time PCR and is an essential component in producing accurate and reproducible data