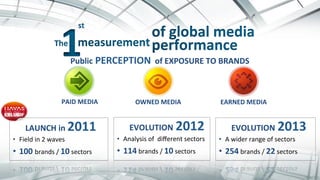
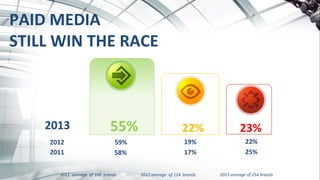
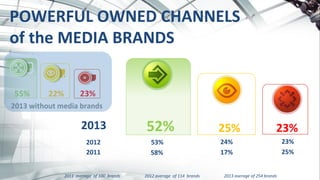
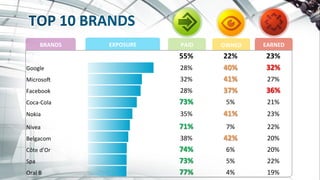
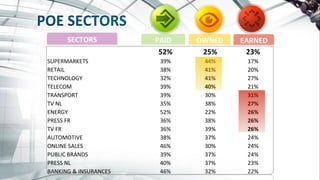
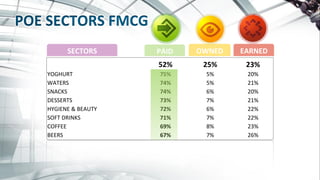
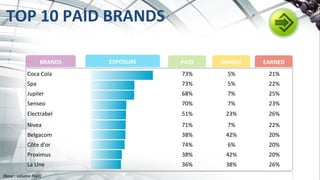
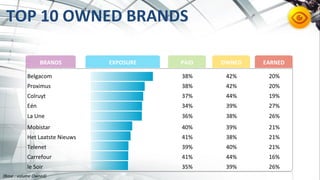
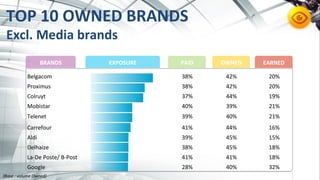
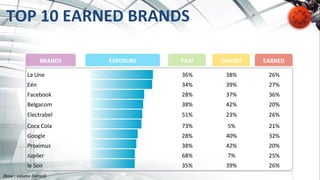
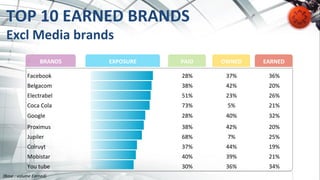
1	
  1
	
  
Public	
  PERCEPTION	
  	
  of	
  EXPOSURE	
  TO	
  BRANDS	
  
PAID	
  MEDIA	
   EARNED	
  MEDIA	
  OWNED	
  MEDIA	
  
EVOLUTION	
  2012	
  
•  Analysis	
  of	
  	
  different	
  sectors	
  
•  114	
  brands	
  /	
  10	
  sectors	
  
EVOLUTION	
  2013	
  
•  A	
  wider	
  range	
  of	
  sectors	
  
•  254	
  brands	
  /	
  22	
  sectors	
  
LAUNCH	
  in	
  2011	
  
•  Field	
  in	
  2	
  waves	
  
•  100	
  brands	
  /	
  10	
  sectors	


INTERVIEWS	


Online	
  field	
  conducted	
  by	
  	
  
AQRate	
  in	
  March	


«	
  pls	
  indicate	
  the	
  frequency	
  at	
  which	
  
you	
  see,	
  read	
  or	
  hear	
  something	
  
about	
  the	
  following	
  brands	
  »	
  :	
  
NEVER	
   RARELY	
   SOMETIMES	
   OFTEN	
  
Adver8sing	
  in	
  media	
  (TV,	
  
Internet,	
  Radio,	
  outdoor,	
  print)	
  	
  
Brochures,	
  (e-­‐)mailings	
  
Promo8onal	
  giGs,	
  trade	
  fairs	
  
Sponsored	
  events	
  
Opinions	
  of	
  friends	
  and	
  family,	
  word	
  
of	
  mouth	
  
Opinions	
  of	
  surfers	
  
(blogs,	
  forums,	
  community	
  networks,	
  
etc	
  ...)	
  
Press	
  coverage	
  
Web	
  Site,	
  facebook	
  page	
  of	
  the	
  brand	
  
Point	
  of	
  sale	
  
Catalogue	
  or	
  magazine	
  
of	
  the	
  brand	
  
You	
  are	
  exposed	
  to	
  this	
  brand	
  
through	
  the	
  following	
  
7	
  
TOP	
  5	
  MEDIA	
  PERFORMANCE	
  
Ranking	
  based	
  on	
  perceived	
  exposure	
  score	
  on	
  15-­‐64	
  
8	
  
TOP	
  10	
  MEDIA	
  PERFORMANCE	
  
Ranking	
  based	
  on	
  perceived	
  exposure	
  score	
  on	
  15-­‐64	
  
9	
  
TOP	
  10	
  MEDIA	
  PERFORMANCE	
  
North	
  incl.	
  Media	
  Brands	
  
Ranking	
  based	
  on	
  perceived	
  exposure	
  score	
  on	
  15-­‐64	
  
10	
  
TOP	
  10	
  MEDIA	
  PERFORMANCE	
  
South	
  incl.	
  Media	
  Brands	
  
Ranking	
  based	
  on	
  perceived	
  exposure	
  score	
  on	
  15-­‐64	
  
11	
  
TOP	
  10	
  MEDIA	
  PERFORMANCE	
  15-­‐34	
  
Ranking	
  based	
  on	
  perceived	
  exposure	
  score	
  on	
  15-­‐64	
  
Top	
  20	
  MEDIA	
  PERFORMANCE	
  
15-­‐34	
  vs.	
  15+	
  
Ranking	
  based	
  on	
  perceived	
  exposure	
  score	
  
55%	
   22%	
   23%	
  
PAID	
  MEDIA	
  
STILL	
  WIN	
  THE	
  RACE	
  
2013	
  
2012	
   59%	
   19%	
   22%	
  
2011	
  	
  average	
  	
  of	
  100	
  	
  brands	


  2012	
  average	
  	
  of	
  114	
  	
  brands	


  2013	
  average	
  of	
  254	
  brands	
  
2011	
   58%	
   17%	
   25%	
  
P
O
E
55%	
   22%	
   23%	
  
2013	
  
2012	
   53%	
   24%	
   23%	
  
2011	
  	
  average	
  	
  of	
  100	
  	
  brands	


  2012	
  average	
  	
  of	
  114	
  	
  brands	


  2013	
  average	
  of	
  254	
  brands	
  
2011	
   58%	
   17%	
   25%	
  
POWERFUL	
  OWNED	
  CHANNELS	
  
of	
  the	
  MEDIA	
  BRANDS	
  
2013	
  without	
  media	
  brands	
  
52%	
   25%	
   23%	
  
AdverZsing	
  
Direct	
  MarkeZng	
  
Sponsoring	
  	
  
&	
  events	
  
Brand	
  websites	
  
and	
  facebook	
  
pages	
  
Physical	
  Point	
  of	
  
Sales	
  
Catalogues	
  &	
  
brand	
  
magazines	
  
Opinions	
  of	
  
surfers	
  	
  
Press	
  arZcles	
  
ConversaZons	
  
&	
  opinions	
  with	
  
friends	
  &	
  family	
  
55%	
   22%	
   23%	
  
Google	
   28%	
   40%	
   32%	
  
MicrosoG	
   32%	
   41%	
   27%	
  
Facebook	
   28%	
   37%	
   36%	
  
Coca-­‐Cola	
   73%	
   5%	
   21%	
  
Nokia	
   35%	
   41%	
   23%	
  
Nivea	
   71%	
   7%	
   22%	
  
Belgacom	
   38%	
   42%	
   20%	
  
Côte	
  d’Or	
   74%	
   6%	
   20%	
  
Spa	
   73%	
   5%	
   22%	
  
Oral	
  B	
   77%	
   4%	
   19%	
  
BRANDS	
   EXPOSURE	
   PAID	
   OWNED	
   EARNED	
  
52%	
   25%	
   23%	
  
SUPERMARKETS	
   39%	
   44%	
   17%	
  
RETAIL	
   38%	
   41%	
   20%	
  
TECHNOLOGY	
   32%	
   41%	
   27%	
  
TELECOM	
   39%	
   40%	
   21%	
  
TRANSPORT	
   39%	
   30%	
   31%	
  
TV	
  NL	
   35%	
   38%	
   27%	
  
ENERGY	
   52%	
   22%	
   26%	
  
PRESS	
  FR	
   36%	
   38%	
   26%	
  
TV	
  FR	
   36%	
   39%	
   26%	
  
AUTOMOTIVE	
   38%	
   37%	
   24%	
  
ONLINE	
  SALES	
   46%	
   30%	
   24%	
  
PUBLIC	
  BRANDS	
   39%	
   37%	
   24%	
  
PRESS	
  NL	
   40%	
   37%	
   23%	
  
BANKING	
  &	
  INSURANCES	
   46%	
   32%	
   22%	
  
PAID	
   OWNED	
   EARNED	
  SECTORS	
  
52%	
   25%	
   23%	
  
YOGHURT	
   75%	
   5%	
   20%	
  
WATERS	
   74%	
   5%	
   21%	
  
SNACKS	
   74%	
   6%	
   20%	
  
DESSERTS	
   73%	
   7%	
   21%	
  
HYGIENE	
  &	
  BEAUTY	
   72%	
   6%	
   22%	
  
SOFT	
  DRINKS	
   71%	
   7%	
   22%	
  
COFFEE	
   69%	
   8%	
   23%	
  
BEERS	
   67%	
   7%	
   26%	
  
PAID	
   OWNED	
   EARNED	
  SECTORS	
  
TOP	
  3	
  PAID	
  SECTORS	
  
YOGHURTS	
   WATERS	
   SNACKS	
  
TOP	
  10	
  PAID	
  BRANDS	
  
Coca	
  Cola	
   73%	
   5%	
   21%	
  
Spa	
   73%	
   5%	
   22%	
  
Jupiler	
   68%	
   7%	
   25%	
  
Senseo	
   70%	
   7%	
   23%	
  
Electrabel	
   51%	
   23%	
   26%	
  
Nivea	
   71%	
   7%	
   22%	
  
Belgacom	
   38%	
   42%	
   20%	
  
Côte	
  d'or	
   74%	
   6%	
   20%	
  
Proximus	
   38%	
   42%	
   20%	
  
La	
  Une	
   36%	
   38%	
   26%	
  
BRANDS	
   EXPOSURE	
   PAID	
   OWNED	
   EARNED	
  
(Base	
  :	
  volume	
  Paid)	
  
SUPERMARKETS	
   RETAIL	
   TECHNOLOGY	
  
TOP	
  3	
  OWNED	
  SECTORS	
  
TOP	
  10	
  OWNED	
  BRANDS	
  
Belgacom	
   38%	
   42%	
   20%	
  
Proximus	
   38%	
   42%	
   20%	
  
Colruyt	
   37%	
   44%	
   19%	
  
Eén	
   34%	
   39%	
   27%	
  
La	
  Une	
   36%	
   38%	
   26%	
  
Mobistar	
   40%	
   39%	
   21%	
  
Het	
  Laatste	
  Nieuws	
   41%	
   38%	
   21%	
  
Telenet	
   39%	
   40%	
   21%	
  
Carrefour	
   41%	
   44%	
   16%	
  
le	
  Soir	
   35%	
   39%	
   26%	
  
BRANDS	
   EXPOSURE	
   PAID	
   OWNED	
   EARNED	
  
(Base	
  :	
  volume	
  Owned)	
  
TOP	
  10	
  OWNED	
  BRANDS	
  
Excl.	
  Media	
  brands	
  
Belgacom	
   38%	
   42%	
   20%	
  
Proximus	
   38%	
   42%	
   20%	
  
Colruyt	
   37%	
   44%	
   19%	
  
Mobistar	
   40%	
   39%	
   21%	
  
Telenet	
   39%	
   40%	
   21%	
  
Carrefour	
   41%	
   44%	
   16%	
  
Aldi	
   39%	
   45%	
   15%	
  
Delhaize	
   38%	
   45%	
   18%	
  
La-­‐De	
  Poste/	
  B-­‐Post	
   41%	
   41%	
   18%	
  
Google	
   28%	
   40%	
   32%	
  
BRANDS	
   EXPOSURE	
   PAID	
   OWNED	
   EARNED	
  
(Base	
  :	
  volume	
  Owned)	
  
TRANSPORTS	
   TECHNOLOGY	
   TV	
  NL	
  
TOP	
  3	
  EARNED	
  SECTORS	
  
TOP	
  10	
  EARNED	
  BRANDS	
  
La	
  Une	
   36%	
   38%	
   26%	
  
Eén	
   34%	
   39%	
   27%	
  
Facebook	
   28%	
   37%	
   36%	
  
Belgacom	
   38%	
   42%	
   20%	
  
Electrabel	
   51%	
   23%	
   26%	
  
Coca	
  Cola	
   73%	
   5%	
   21%	
  
Google	
   28%	
   40%	
   32%	
  
Proximus	
   38%	
   42%	
   20%	
  
Jupiler	
   68%	
   7%	
   25%	
  
le	
  Soir	
   35%	
   39%	
   26%	
  
BRANDS	
   EXPOSURE	
   PAID	
   OWNED	
   EARNED	
  
(Base	
  :	
  volume	
  Earned)	
  
TOP	
  10	
  EARNED	
  BRANDS	
  
Excl	
  Media	
  brands	
  
Facebook	
   28%	
   37%	
   36%	
  
Belgacom	
   38%	
   42%	
   20%	
  
Electrabel	
   51%	
   23%	
   26%	
  
Coca	
  Cola	
   73%	
   5%	
   21%	
  
Google	
   28%	
   40%	
   32%	
  
Proximus	
   38%	
   42%	
   20%	
  
Jupiler	
   68%	
   7%	
   25%	
  
Colruyt	
   37%	
   44%	
   19%	
  
Mobistar	
   40%	
   39%	
   21%	
  
You	
  tube	
   30%	
   36%	
   34%	
  
BRANDS	
   EXPOSURE	
   PAID	
   OWNED	
   EARNED	
  
(Base	
  :	
  volume	
  Earned)	
  
2013	
  average	
  of	
  254	
  brands	
  
Let’s	
  Summarize	
  …	
  	
  
52%	
  
25%	
  
23%	
  
55	
  %	
  -­‐	
  AdverZsing	
  
27%	
  	
  -­‐	
  Direct	
  MarkeZng	
  
18%	
  	
  -­‐	
  Sponsoring	
  
29	
  %	
  	
  
14	
  %	
  	
  
9	
  %	
  
38	
  %	
  -­‐	
  Site	
  /	
  FB	
  Page	
  
23	
  %	
  -­‐	
  “Catalogue”	
  
39	
  %	
  -­‐	
  Point	
  of	
  Sales	
  	
  
10	
  %	
  	
  
6	
  %	
  	
  
10	
  %	
  
36	
  %	
  -­‐	
  Friends	
  &	
  Family	
  
23	
  %	
  -­‐	
  Social	
  Media	
  
39	
  %	
  -­‐	
  Press	
  RelaZon	
  
8	
  %	
  	
  
5	
  %	
  	
  
9	
  %	
  
254	
  
Brands	
  	
  
OWNED	
  
MEDIA	
  
PAID	
   PAID	
  
PAID	
  
PAID	
  
h"p://www.mediaplanetgossip.com	
  

Poe 2013 21 6 2013

  • 1.
  • 3.
    Public  PERCEPTION    of  EXPOSURE  TO  BRANDS   PAID  MEDIA   EARNED  MEDIA  OWNED  MEDIA   EVOLUTION  2012   •  Analysis  of    different  sectors   •  114  brands  /  10  sectors   EVOLUTION  2013   •  A  wider  range  of  sectors   •  254  brands  /  22  sectors   LAUNCH  in  2011   •  Field  in  2  waves   •  100  brands  /  10  sectors            
  • 4.
    INTERVIEWS     Online  field  conducted  by     AQRate  in  March    
  • 5.
    «  pls  indicate  the  frequency  at  which   you  see,  read  or  hear  something   about  the  following  brands  »  :   NEVER   RARELY   SOMETIMES   OFTEN  
  • 6.
    Adver8sing  in  media  (TV,   Internet,  Radio,  outdoor,  print)     Brochures,  (e-­‐)mailings   Promo8onal  giGs,  trade  fairs   Sponsored  events   Opinions  of  friends  and  family,  word   of  mouth   Opinions  of  surfers   (blogs,  forums,  community  networks,   etc  ...)   Press  coverage   Web  Site,  facebook  page  of  the  brand   Point  of  sale   Catalogue  or  magazine   of  the  brand   You  are  exposed  to  this  brand   through  the  following  
  • 7.
    7   TOP  5  MEDIA  PERFORMANCE   Ranking  based  on  perceived  exposure  score  on  15-­‐64  
  • 8.
    8   TOP  10  MEDIA  PERFORMANCE   Ranking  based  on  perceived  exposure  score  on  15-­‐64  
  • 9.
    9   TOP  10  MEDIA  PERFORMANCE   North  incl.  Media  Brands   Ranking  based  on  perceived  exposure  score  on  15-­‐64  
  • 10.
    10   TOP  10  MEDIA  PERFORMANCE   South  incl.  Media  Brands   Ranking  based  on  perceived  exposure  score  on  15-­‐64  
  • 11.
    11   TOP  10  MEDIA  PERFORMANCE  15-­‐34   Ranking  based  on  perceived  exposure  score  on  15-­‐64  
  • 12.
    Top  20  MEDIA  PERFORMANCE   15-­‐34  vs.  15+   Ranking  based  on  perceived  exposure  score  
  • 13.
    55%   22%   23%   PAID  MEDIA   STILL  WIN  THE  RACE   2013   2012   59%   19%   22%   2011    average    of  100    brands                                              2012  average    of  114    brands                                              2013  average  of  254  brands   2011   58%   17%   25%  
  • 14.
    P O E 55%   22%   23%   2013   2012   53%   24%   23%   2011    average    of  100    brands                                              2012  average    of  114    brands                                              2013  average  of  254  brands   2011   58%   17%   25%   POWERFUL  OWNED  CHANNELS   of  the  MEDIA  BRANDS   2013  without  media  brands   52%   25%   23%  
  • 15.
    AdverZsing   Direct  MarkeZng   Sponsoring     &  events  
  • 16.
    Brand  websites   and  facebook   pages   Physical  Point  of   Sales   Catalogues  &   brand   magazines  
  • 17.
    Opinions  of   surfers     Press  arZcles   ConversaZons   &  opinions  with   friends  &  family  
  • 18.
    55%   22%   23%   Google   28%   40%   32%   MicrosoG   32%   41%   27%   Facebook   28%   37%   36%   Coca-­‐Cola   73%   5%   21%   Nokia   35%   41%   23%   Nivea   71%   7%   22%   Belgacom   38%   42%   20%   Côte  d’Or   74%   6%   20%   Spa   73%   5%   22%   Oral  B   77%   4%   19%   BRANDS   EXPOSURE   PAID   OWNED   EARNED  
  • 19.
    52%   25%   23%   SUPERMARKETS   39%   44%   17%   RETAIL   38%   41%   20%   TECHNOLOGY   32%   41%   27%   TELECOM   39%   40%   21%   TRANSPORT   39%   30%   31%   TV  NL   35%   38%   27%   ENERGY   52%   22%   26%   PRESS  FR   36%   38%   26%   TV  FR   36%   39%   26%   AUTOMOTIVE   38%   37%   24%   ONLINE  SALES   46%   30%   24%   PUBLIC  BRANDS   39%   37%   24%   PRESS  NL   40%   37%   23%   BANKING  &  INSURANCES   46%   32%   22%   PAID   OWNED   EARNED  SECTORS  
  • 20.
    52%   25%   23%   YOGHURT   75%   5%   20%   WATERS   74%   5%   21%   SNACKS   74%   6%   20%   DESSERTS   73%   7%   21%   HYGIENE  &  BEAUTY   72%   6%   22%   SOFT  DRINKS   71%   7%   22%   COFFEE   69%   8%   23%   BEERS   67%   7%   26%   PAID   OWNED   EARNED  SECTORS  
  • 21.
    TOP  3  PAID  SECTORS   YOGHURTS   WATERS   SNACKS  
  • 22.
    TOP  10  PAID  BRANDS   Coca  Cola   73%   5%   21%   Spa   73%   5%   22%   Jupiler   68%   7%   25%   Senseo   70%   7%   23%   Electrabel   51%   23%   26%   Nivea   71%   7%   22%   Belgacom   38%   42%   20%   Côte  d'or   74%   6%   20%   Proximus   38%   42%   20%   La  Une   36%   38%   26%   BRANDS   EXPOSURE   PAID   OWNED   EARNED   (Base  :  volume  Paid)  
  • 23.
    SUPERMARKETS   RETAIL   TECHNOLOGY   TOP  3  OWNED  SECTORS  
  • 24.
    TOP  10  OWNED  BRANDS   Belgacom   38%   42%   20%   Proximus   38%   42%   20%   Colruyt   37%   44%   19%   Eén   34%   39%   27%   La  Une   36%   38%   26%   Mobistar   40%   39%   21%   Het  Laatste  Nieuws   41%   38%   21%   Telenet   39%   40%   21%   Carrefour   41%   44%   16%   le  Soir   35%   39%   26%   BRANDS   EXPOSURE   PAID   OWNED   EARNED   (Base  :  volume  Owned)  
  • 25.
    TOP  10  OWNED  BRANDS   Excl.  Media  brands   Belgacom   38%   42%   20%   Proximus   38%   42%   20%   Colruyt   37%   44%   19%   Mobistar   40%   39%   21%   Telenet   39%   40%   21%   Carrefour   41%   44%   16%   Aldi   39%   45%   15%   Delhaize   38%   45%   18%   La-­‐De  Poste/  B-­‐Post   41%   41%   18%   Google   28%   40%   32%   BRANDS   EXPOSURE   PAID   OWNED   EARNED   (Base  :  volume  Owned)  
  • 26.
    TRANSPORTS   TECHNOLOGY   TV  NL   TOP  3  EARNED  SECTORS  
  • 27.
    TOP  10  EARNED  BRANDS   La  Une   36%   38%   26%   Eén   34%   39%   27%   Facebook   28%   37%   36%   Belgacom   38%   42%   20%   Electrabel   51%   23%   26%   Coca  Cola   73%   5%   21%   Google   28%   40%   32%   Proximus   38%   42%   20%   Jupiler   68%   7%   25%   le  Soir   35%   39%   26%   BRANDS   EXPOSURE   PAID   OWNED   EARNED   (Base  :  volume  Earned)  
  • 28.
    TOP  10  EARNED  BRANDS   Excl  Media  brands   Facebook   28%   37%   36%   Belgacom   38%   42%   20%   Electrabel   51%   23%   26%   Coca  Cola   73%   5%   21%   Google   28%   40%   32%   Proximus   38%   42%   20%   Jupiler   68%   7%   25%   Colruyt   37%   44%   19%   Mobistar   40%   39%   21%   You  tube   30%   36%   34%   BRANDS   EXPOSURE   PAID   OWNED   EARNED   (Base  :  volume  Earned)  
  • 30.
    2013  average  of  254  brands   Let’s  Summarize  …     52%   25%   23%   55  %  -­‐  AdverZsing   27%    -­‐  Direct  MarkeZng   18%    -­‐  Sponsoring   29  %     14  %     9  %   38  %  -­‐  Site  /  FB  Page   23  %  -­‐  “Catalogue”   39  %  -­‐  Point  of  Sales     10  %     6  %     10  %   36  %  -­‐  Friends  &  Family   23  %  -­‐  Social  Media   39  %  -­‐  Press  RelaZon   8  %     5  %     9  %  
  • 31.
  • 32.
    OWNED   MEDIA   PAID   PAID   PAID   PAID  
  • 33.