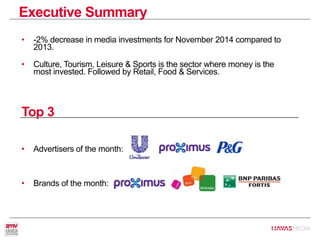
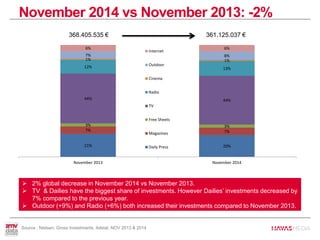
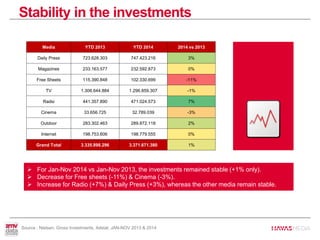
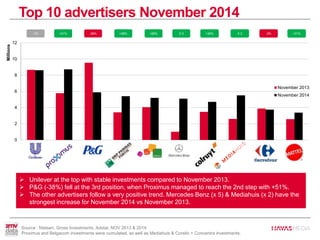
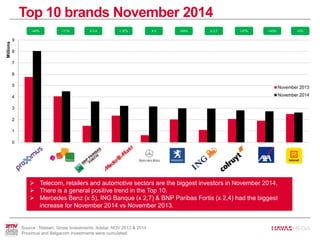
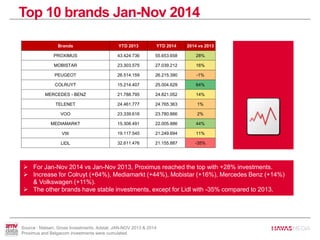
MEDIA INVESTMENTS
OVERVIEW NOVEMBER 2014
Executive Summary
• -2% decrease in media investments for November 2014 compared to
2013.
• Culture, Tourism, Leisure & Sports is the sector where money is the
most invested. Followed by Retail, Food & Services.
Top 3
• Advertisers of the month:
• Brands of the month:
November 2014 vs November 2013: -2%
361.125.037 €368.405.535 €
 2% global decrease in November 2014 vs November 2013.
 TV & Dailies have the biggest share of investments. However Dailies’ investments decreased by
7% compared to the previous year.
 Outdoor (+9%) and Radio (+6%) both increased their investments compared to November 2013.
Source : Nielsen, Gross Investments, Adstat, NOV 2013 & 2014
21% 20%
7% 7%
3% 3%
44% 44%
12% 13%
1% 1%
7% 8%
6% 6%
November 2013 November 2014
Internet
Outdoor
Cinema
Radio
TV
Free Sheets
Magazines
Daily Press
Stability in the investments
Source : Nielsen, Gross Investments, Adstat, JAN-NOV 2013 & 2014
 For Jan-Nov 2014 vs Jan-Nov 2013, the investments remained stable (+1% only).
 Decrease for Free sheets (-11%) & Cinema (-3%).
 Increase for Radio (+7%) & Daily Press (+3%), whereas the other media remain stable.
Media YTD 2013 YTD 2014 2014 vs 2013
Daily Press 723.628.303 747.423.216 3%
Magazines 233.163.577 232.592.873 0%
Free Sheets 115.390.848 102.330.699 -11%
TV 1.306.644.884 1.296.859.307 -1%
Radio 441.357.890 471.024.573 7%
Cinema 33.656.725 32.789.039 -3%
Outdoor 283.302.463 289.872.118 2%
Internet 198.753.606 198.779.555 0%
Grand Total 3.335.898.296 3.371.671.380 1%
 Free sheets investments are decreasing every analyzed month (2014/2013).
 Web & Outdoor investments boomed in March and June 2014 (vs 2013).
 Radio index 2014/2013 was positive from January to June.
 Dailies, Radio & Cinema investments increased for the begining of the school year.
Positive trend for the last 3 months
Source : Nielsen, Gross Investments, Adstat, JAN-NOV 2013 & 2014 - Index
-40%
-30%
-20%
-10%
0%
10%
20%
30%
40%
50%
Jan Feb Mar Apr May Jun Jul Aug Sep Oct Nov
Daily Press
Magazines
Free
Sheets
TV
Radio
Cinema
Outdoor
Internet
Grand
Total
Top 10 advertisers November 2014
-38% X 5+28%-1% +36% -3%
 Unilever at the top with stable investments compared to November 2013.
 P&G (-38%) fell at the 3rd position, when Proximus managed to reach the 2nd step with +51%.
 The other advertisers follow a very positive trend. Mercedes Benz (x 5) & Mediahuis (x 2) have the
strongest increase for November 2014 vs November 2013.
+31%X 2+51%
Source : Nielsen, Gross Investments, Adstat, NOV 2013 & 2014
Proximus and Belgacom investments were cumulated, as well as Mediahuis & Corelio + Concentra investments.
0
2
4
6
8
10
12
Millions
November 2013
November 2014
+58%
Top 10 advertisers Jan-Nov 2014
 For Jan-Nov 2014 vs Jan-Nov 2013, Unilever is also at the top with stable investments.
 The same stability for Coca-Cola and D’Ieteren. The rest of the advertisers are on a positive
slop in terms of investments, except for P&G with -23% compared to the previous year.
Source : Nielsen, Gross Investments, Adstat, JAN-NOV 2013 & 2014
Proximus and Belgacom investments were cumulated, as well as Mediahuis & Corelio + Concentra investments.
Advertisers YTD 2013 YTD 2014 2014 vs 2013
UNILEVER BELGIUM FOODS & HPC 70.157.483 69.466.356 -1%
PROCTER & GAMBLE BENELUX 87.897.081 67.751.755 -23%
COCA-COLA BELGIUM-LUXEMBOURG 55.495.817 56.050.410 1%
D'IETEREN AUTO 55.926.206 54.762.615 -2%
MEDIAHUIS 31.564.319 45.203.159 43%
PROXIMUS 45.220.403 59.709.780 32%
LOTERIE NATIONALE 31.185.249 32.492.090 4%
RECKITT & BENCKISER HOME CARE 30.225.691 30.767.058 2%
COLRUYT 18.223.828 30.145.703 65%
DAIMLER BENZ GROUP 26.510.816 30.102.002 14%
Top 10 brands November 2014
+40% X 2,4 +49%X 5 +43%+ 37% X 2,7 +37%
 Telecom, retailers and automotive sectors are the biggest investors in November 2014.
 There is a general positive trend in the Top 10.
 Mercedes Benz (x 5), ING Banque (x 2,7) & BNP Paribas Fortis (x 2,4) had the biggest
increase for November 2014 vs November 2013.
+11% +5%
Source : Nielsen, Gross Investments, Adstat, NOV 2013 & 2014
Proximus and Belgacom investments were cumulated.
0
1
2
3
4
5
6
7
8
9
Millions
November 2013
November 2014
Top 10 brands Jan-Nov 2014
Source : Nielsen, Gross Investments, Adstat, JAN-NOV 2013 & 2014
Proximus and Belgacom investments were cumulated.
 For Jan-Nov 2014 vs Jan-Nov 2013, Proximus reached the top with +28% investments.
 Increase for Colruyt (+64%), Mediamarkt (+44%), Mobistar (+16%), Mercedes Benz (+14%)
& Volkswagen (+11%).
 The other brands have stable investments, except for Lidl with -35% compared to 2013.
Brands YTD 2013 YTD 2014 2014 vs 2013
PROXIMUS 43.424.736 55.653.658 28%
MOBISTAR 23.303.575 27.039.212 16%
PEUGEOT 26.514.159 26.215.390 -1%
COLRUYT 15.214.407 25.004.629 64%
MERCEDES - BENZ 21.788.795 24.821.052 14%
TELENET 24.461.777 24.765.363 1%
VOO 23.339.616 23.780.866 2%
MEDIAMARKT 15.308.491 22.005.886 44%
VW 19.117.545 21.249.694 11%
LIDL 32.611.476 21.155.887 -35%
THANK YOUAny questions? 2mvdc.belgium@havasmedia.com

Media Investment Overview

  • 1.
  • 2.
    Executive Summary • -2%decrease in media investments for November 2014 compared to 2013. • Culture, Tourism, Leisure & Sports is the sector where money is the most invested. Followed by Retail, Food & Services. Top 3 • Advertisers of the month: • Brands of the month:
  • 3.
    November 2014 vsNovember 2013: -2% 361.125.037 €368.405.535 €  2% global decrease in November 2014 vs November 2013.  TV & Dailies have the biggest share of investments. However Dailies’ investments decreased by 7% compared to the previous year.  Outdoor (+9%) and Radio (+6%) both increased their investments compared to November 2013. Source : Nielsen, Gross Investments, Adstat, NOV 2013 & 2014 21% 20% 7% 7% 3% 3% 44% 44% 12% 13% 1% 1% 7% 8% 6% 6% November 2013 November 2014 Internet Outdoor Cinema Radio TV Free Sheets Magazines Daily Press
  • 4.
    Stability in theinvestments Source : Nielsen, Gross Investments, Adstat, JAN-NOV 2013 & 2014  For Jan-Nov 2014 vs Jan-Nov 2013, the investments remained stable (+1% only).  Decrease for Free sheets (-11%) & Cinema (-3%).  Increase for Radio (+7%) & Daily Press (+3%), whereas the other media remain stable. Media YTD 2013 YTD 2014 2014 vs 2013 Daily Press 723.628.303 747.423.216 3% Magazines 233.163.577 232.592.873 0% Free Sheets 115.390.848 102.330.699 -11% TV 1.306.644.884 1.296.859.307 -1% Radio 441.357.890 471.024.573 7% Cinema 33.656.725 32.789.039 -3% Outdoor 283.302.463 289.872.118 2% Internet 198.753.606 198.779.555 0% Grand Total 3.335.898.296 3.371.671.380 1%
  • 5.
     Free sheetsinvestments are decreasing every analyzed month (2014/2013).  Web & Outdoor investments boomed in March and June 2014 (vs 2013).  Radio index 2014/2013 was positive from January to June.  Dailies, Radio & Cinema investments increased for the begining of the school year. Positive trend for the last 3 months Source : Nielsen, Gross Investments, Adstat, JAN-NOV 2013 & 2014 - Index -40% -30% -20% -10% 0% 10% 20% 30% 40% 50% Jan Feb Mar Apr May Jun Jul Aug Sep Oct Nov Daily Press Magazines Free Sheets TV Radio Cinema Outdoor Internet Grand Total
  • 6.
    Top 10 advertisersNovember 2014 -38% X 5+28%-1% +36% -3%  Unilever at the top with stable investments compared to November 2013.  P&G (-38%) fell at the 3rd position, when Proximus managed to reach the 2nd step with +51%.  The other advertisers follow a very positive trend. Mercedes Benz (x 5) & Mediahuis (x 2) have the strongest increase for November 2014 vs November 2013. +31%X 2+51% Source : Nielsen, Gross Investments, Adstat, NOV 2013 & 2014 Proximus and Belgacom investments were cumulated, as well as Mediahuis & Corelio + Concentra investments. 0 2 4 6 8 10 12 Millions November 2013 November 2014 +58%
  • 7.
    Top 10 advertisersJan-Nov 2014  For Jan-Nov 2014 vs Jan-Nov 2013, Unilever is also at the top with stable investments.  The same stability for Coca-Cola and D’Ieteren. The rest of the advertisers are on a positive slop in terms of investments, except for P&G with -23% compared to the previous year. Source : Nielsen, Gross Investments, Adstat, JAN-NOV 2013 & 2014 Proximus and Belgacom investments were cumulated, as well as Mediahuis & Corelio + Concentra investments. Advertisers YTD 2013 YTD 2014 2014 vs 2013 UNILEVER BELGIUM FOODS & HPC 70.157.483 69.466.356 -1% PROCTER & GAMBLE BENELUX 87.897.081 67.751.755 -23% COCA-COLA BELGIUM-LUXEMBOURG 55.495.817 56.050.410 1% D'IETEREN AUTO 55.926.206 54.762.615 -2% MEDIAHUIS 31.564.319 45.203.159 43% PROXIMUS 45.220.403 59.709.780 32% LOTERIE NATIONALE 31.185.249 32.492.090 4% RECKITT & BENCKISER HOME CARE 30.225.691 30.767.058 2% COLRUYT 18.223.828 30.145.703 65% DAIMLER BENZ GROUP 26.510.816 30.102.002 14%
  • 8.
    Top 10 brandsNovember 2014 +40% X 2,4 +49%X 5 +43%+ 37% X 2,7 +37%  Telecom, retailers and automotive sectors are the biggest investors in November 2014.  There is a general positive trend in the Top 10.  Mercedes Benz (x 5), ING Banque (x 2,7) & BNP Paribas Fortis (x 2,4) had the biggest increase for November 2014 vs November 2013. +11% +5% Source : Nielsen, Gross Investments, Adstat, NOV 2013 & 2014 Proximus and Belgacom investments were cumulated. 0 1 2 3 4 5 6 7 8 9 Millions November 2013 November 2014
  • 9.
    Top 10 brandsJan-Nov 2014 Source : Nielsen, Gross Investments, Adstat, JAN-NOV 2013 & 2014 Proximus and Belgacom investments were cumulated.  For Jan-Nov 2014 vs Jan-Nov 2013, Proximus reached the top with +28% investments.  Increase for Colruyt (+64%), Mediamarkt (+44%), Mobistar (+16%), Mercedes Benz (+14%) & Volkswagen (+11%).  The other brands have stable investments, except for Lidl with -35% compared to 2013. Brands YTD 2013 YTD 2014 2014 vs 2013 PROXIMUS 43.424.736 55.653.658 28% MOBISTAR 23.303.575 27.039.212 16% PEUGEOT 26.514.159 26.215.390 -1% COLRUYT 15.214.407 25.004.629 64% MERCEDES - BENZ 21.788.795 24.821.052 14% TELENET 24.461.777 24.765.363 1% VOO 23.339.616 23.780.866 2% MEDIAMARKT 15.308.491 22.005.886 44% VW 19.117.545 21.249.694 11% LIDL 32.611.476 21.155.887 -35%
  • 10.
    THANK YOUAny questions?2mvdc.belgium@havasmedia.com