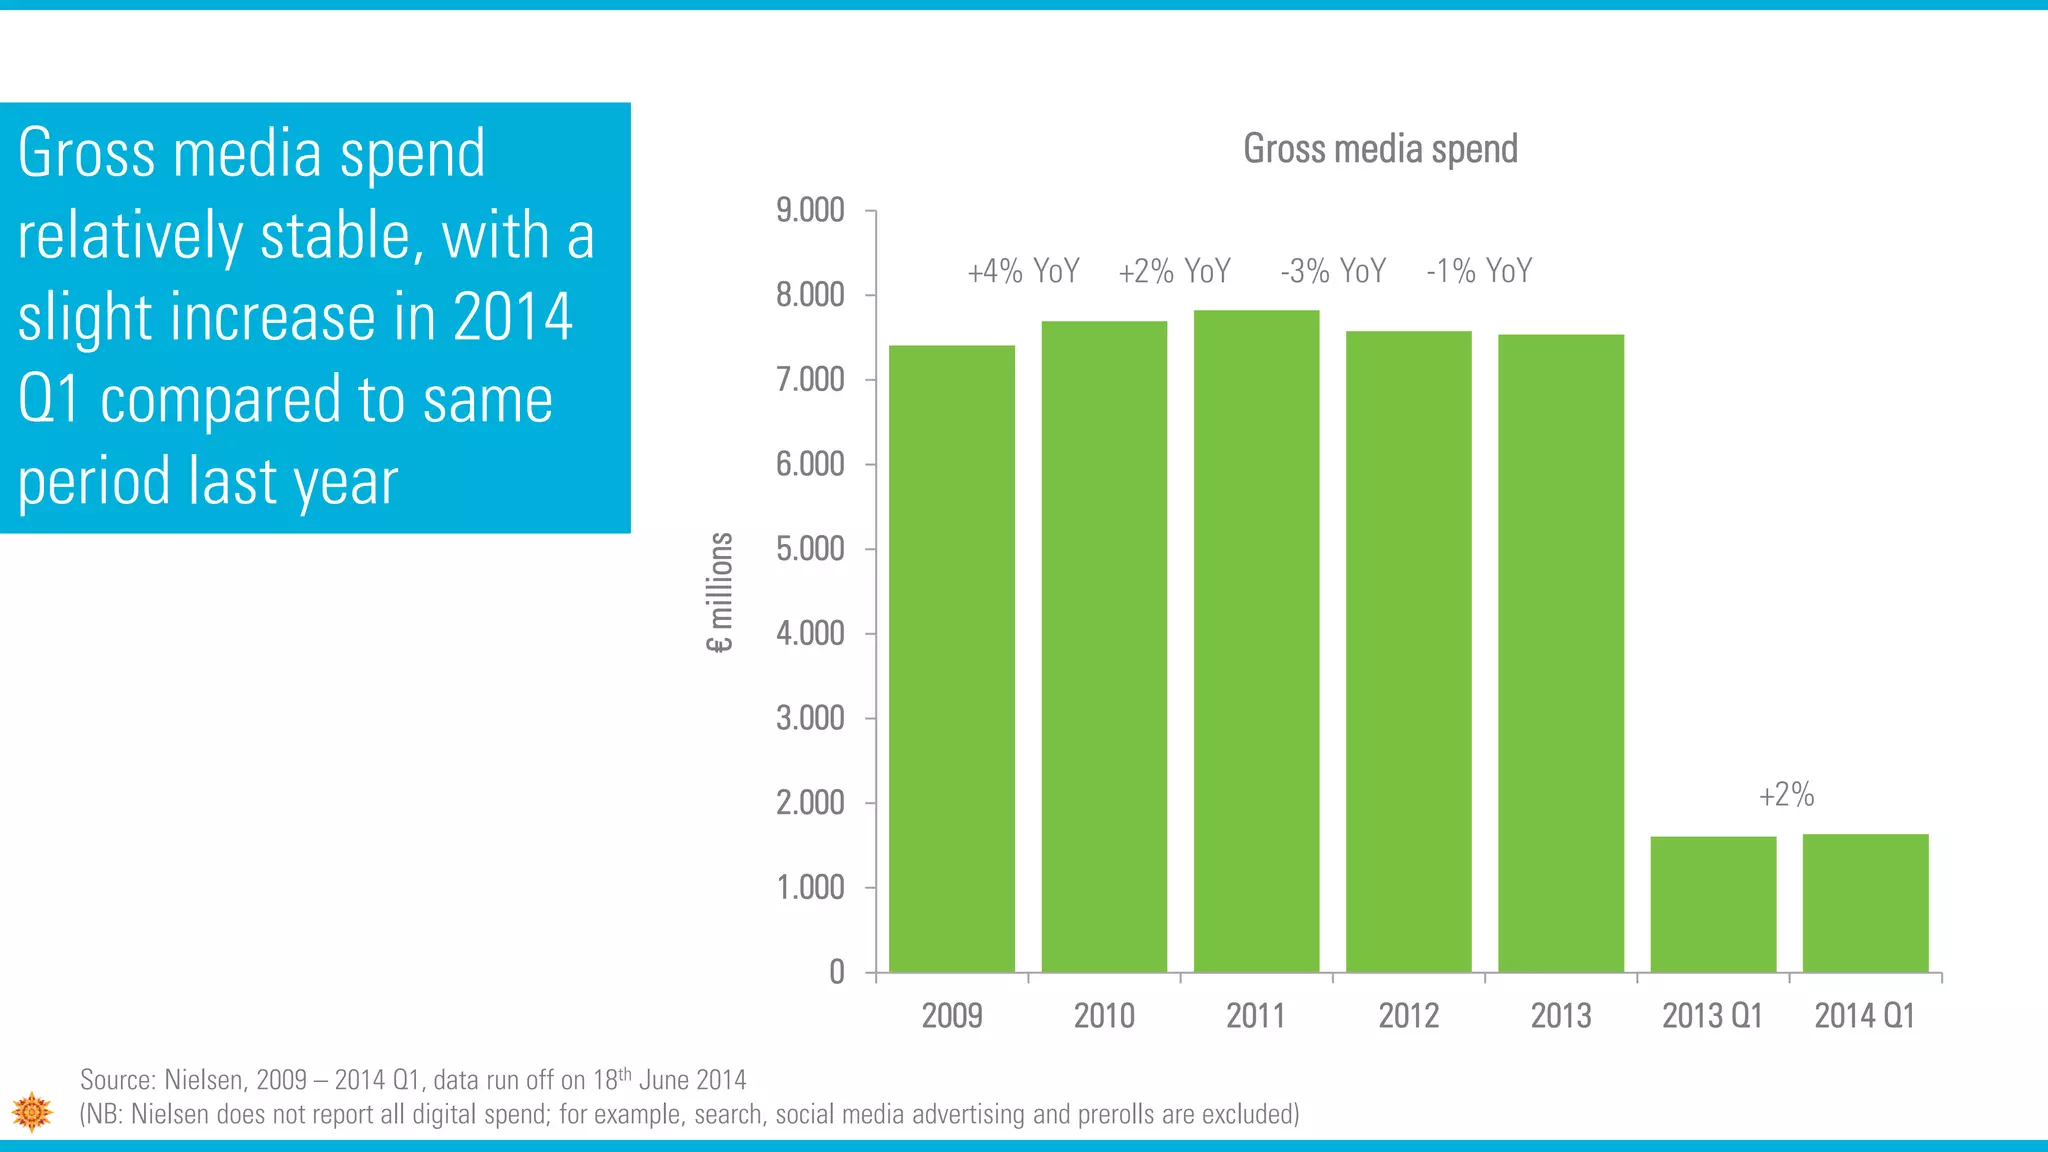
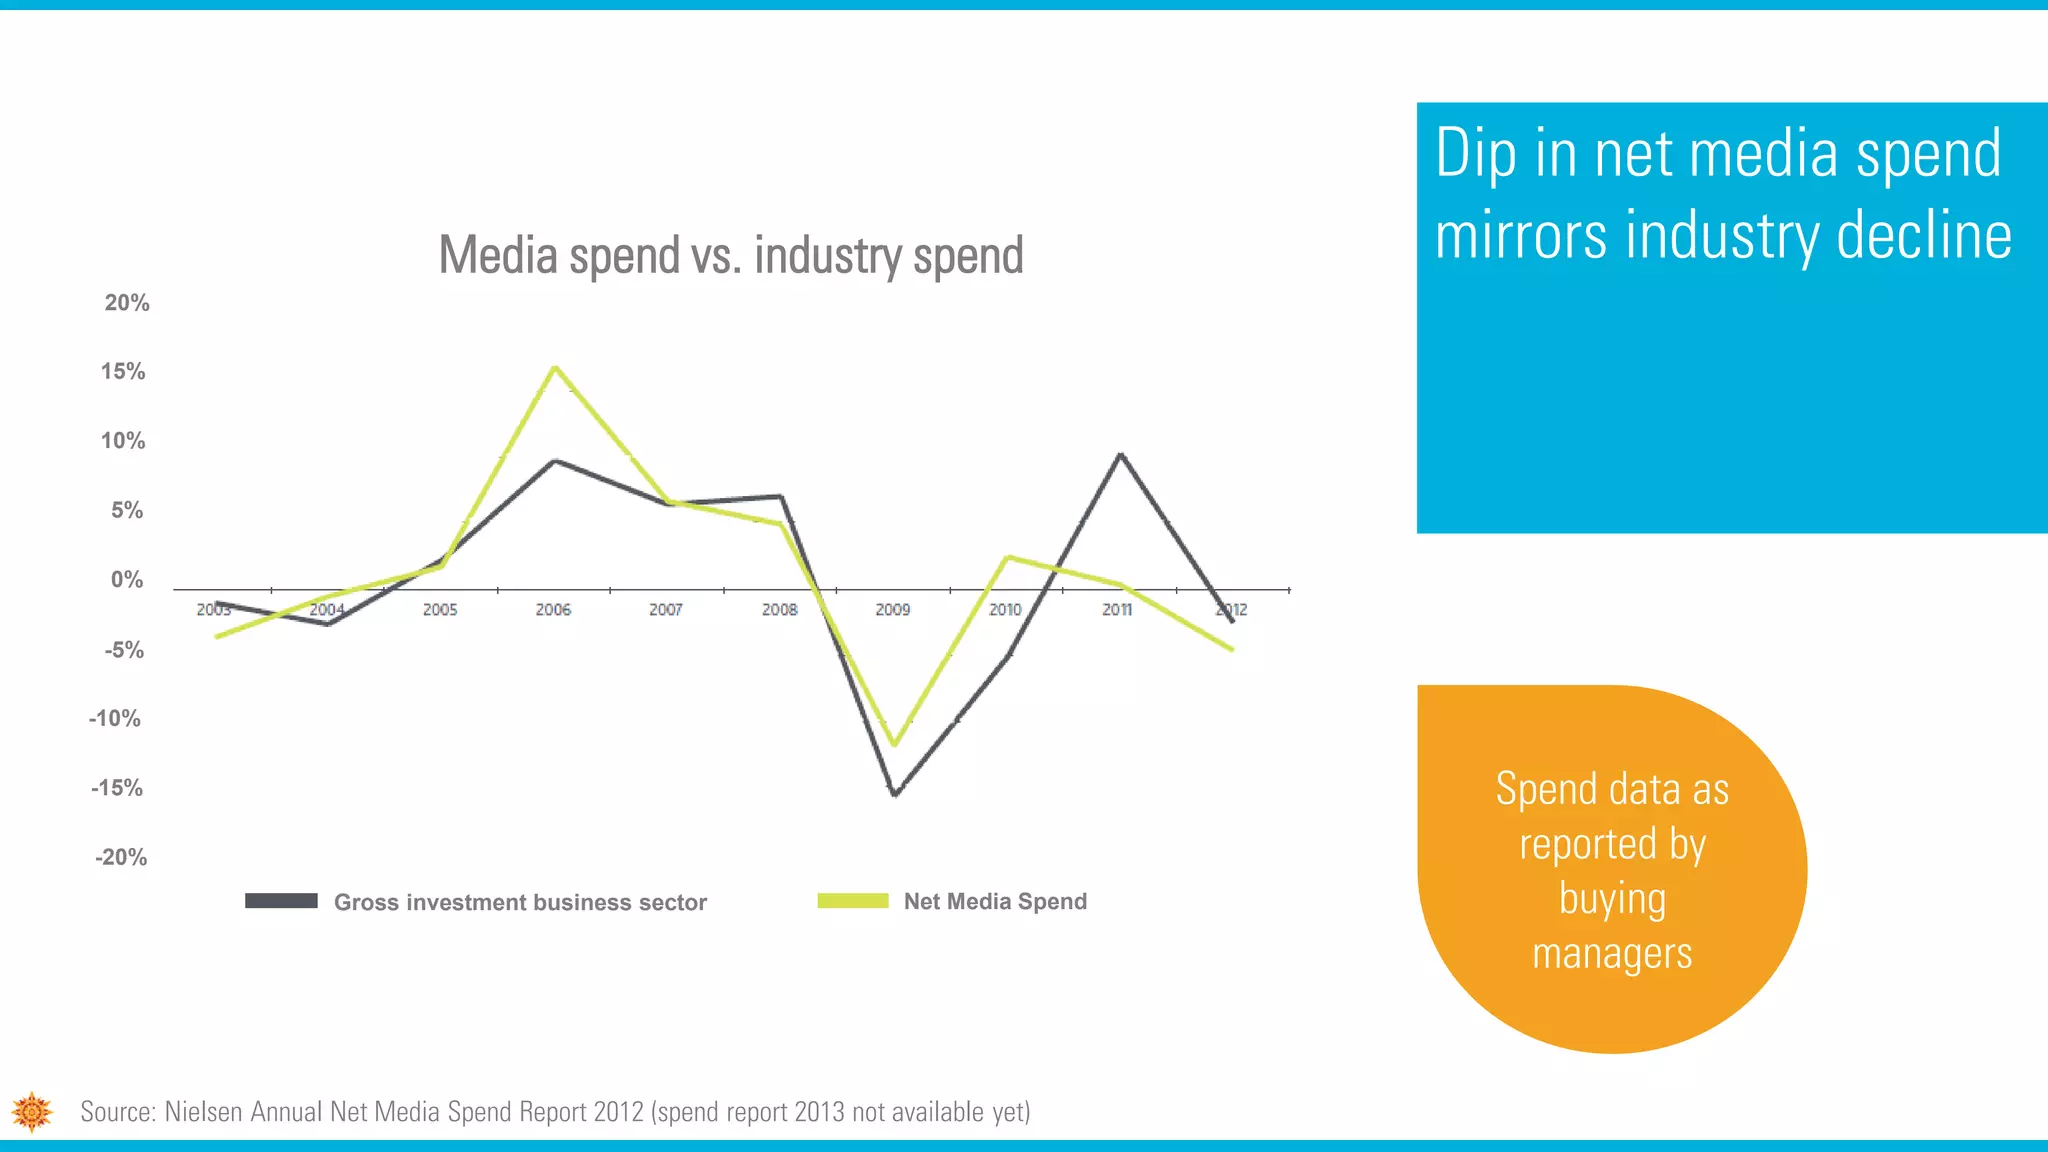
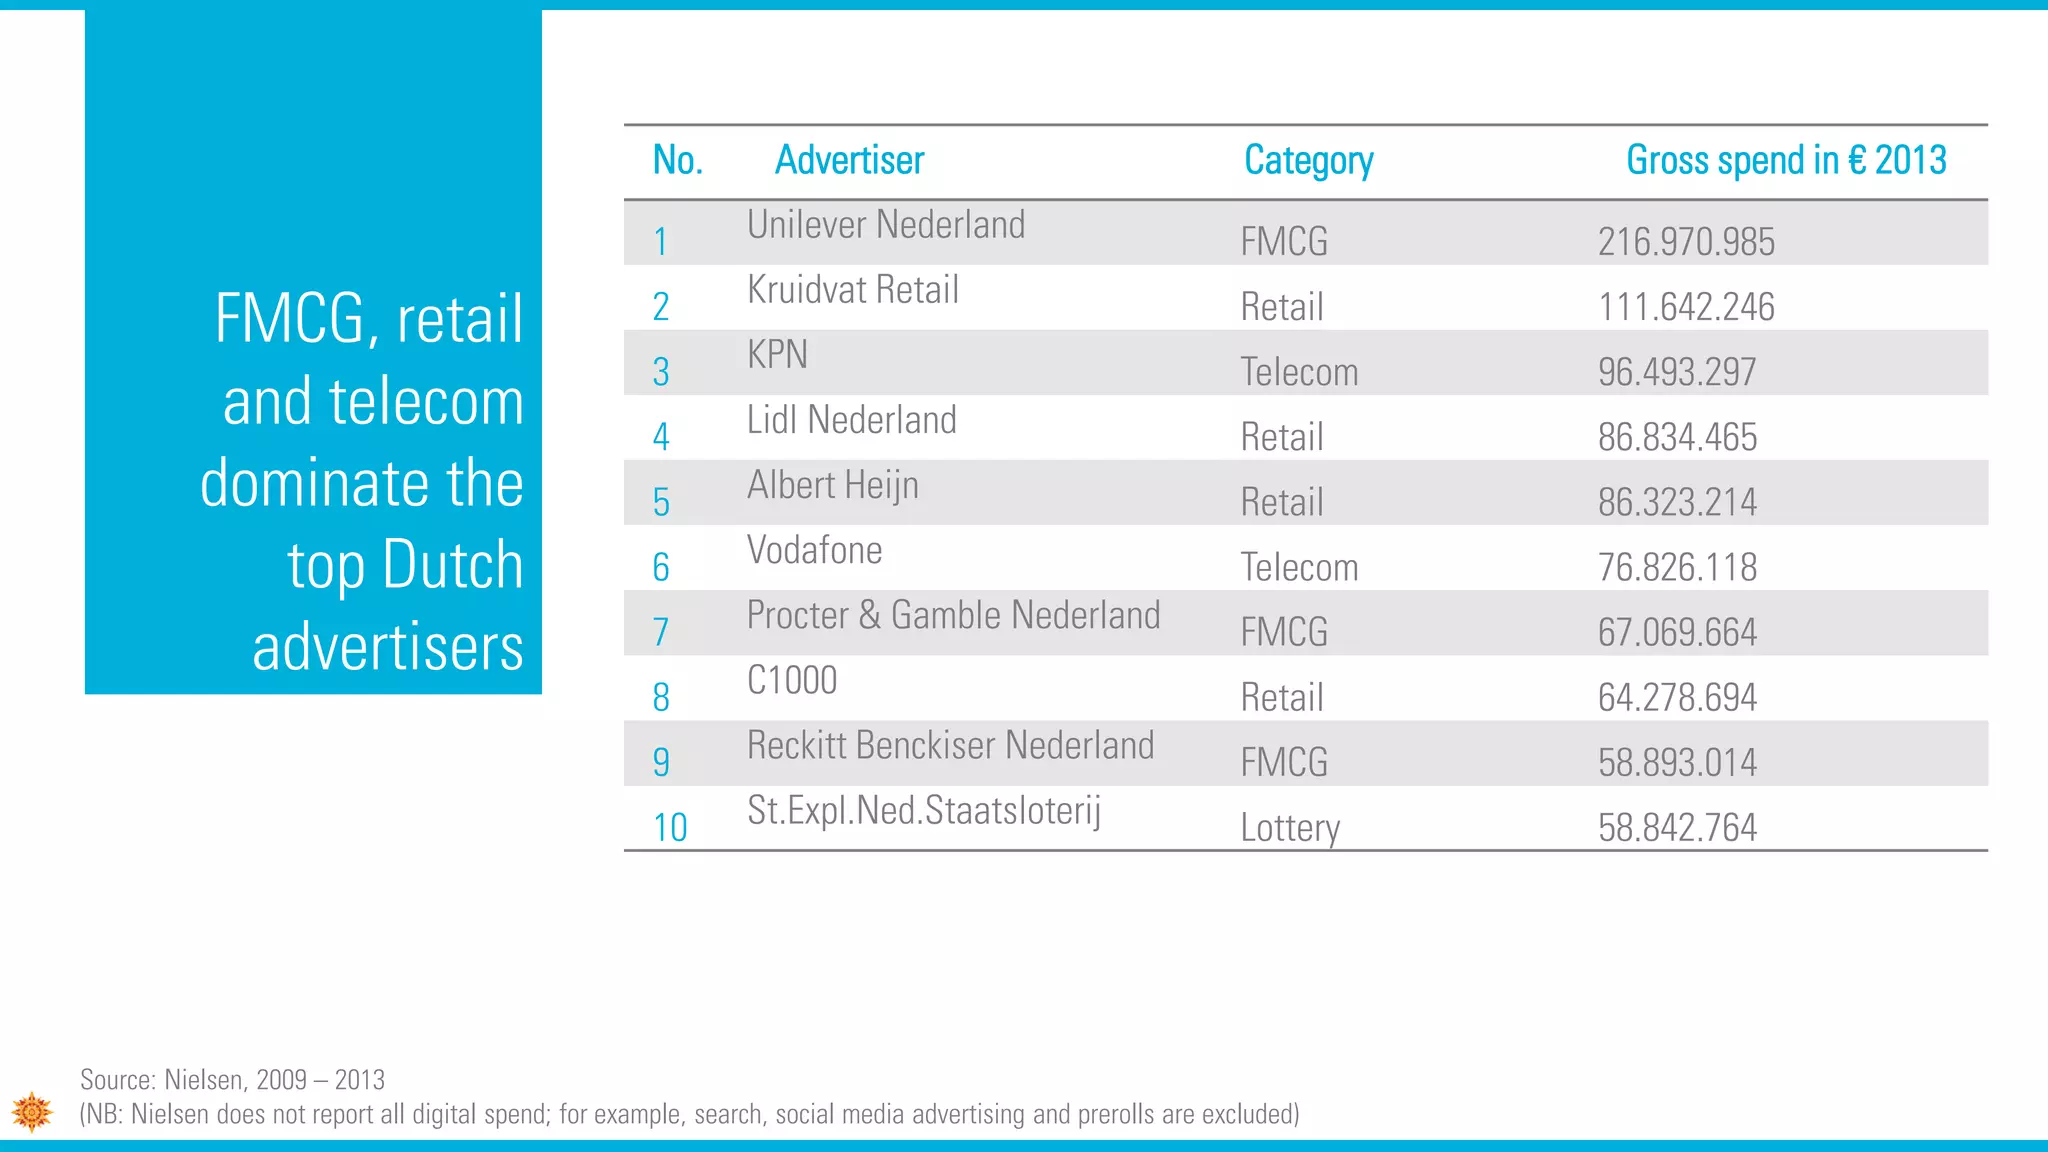
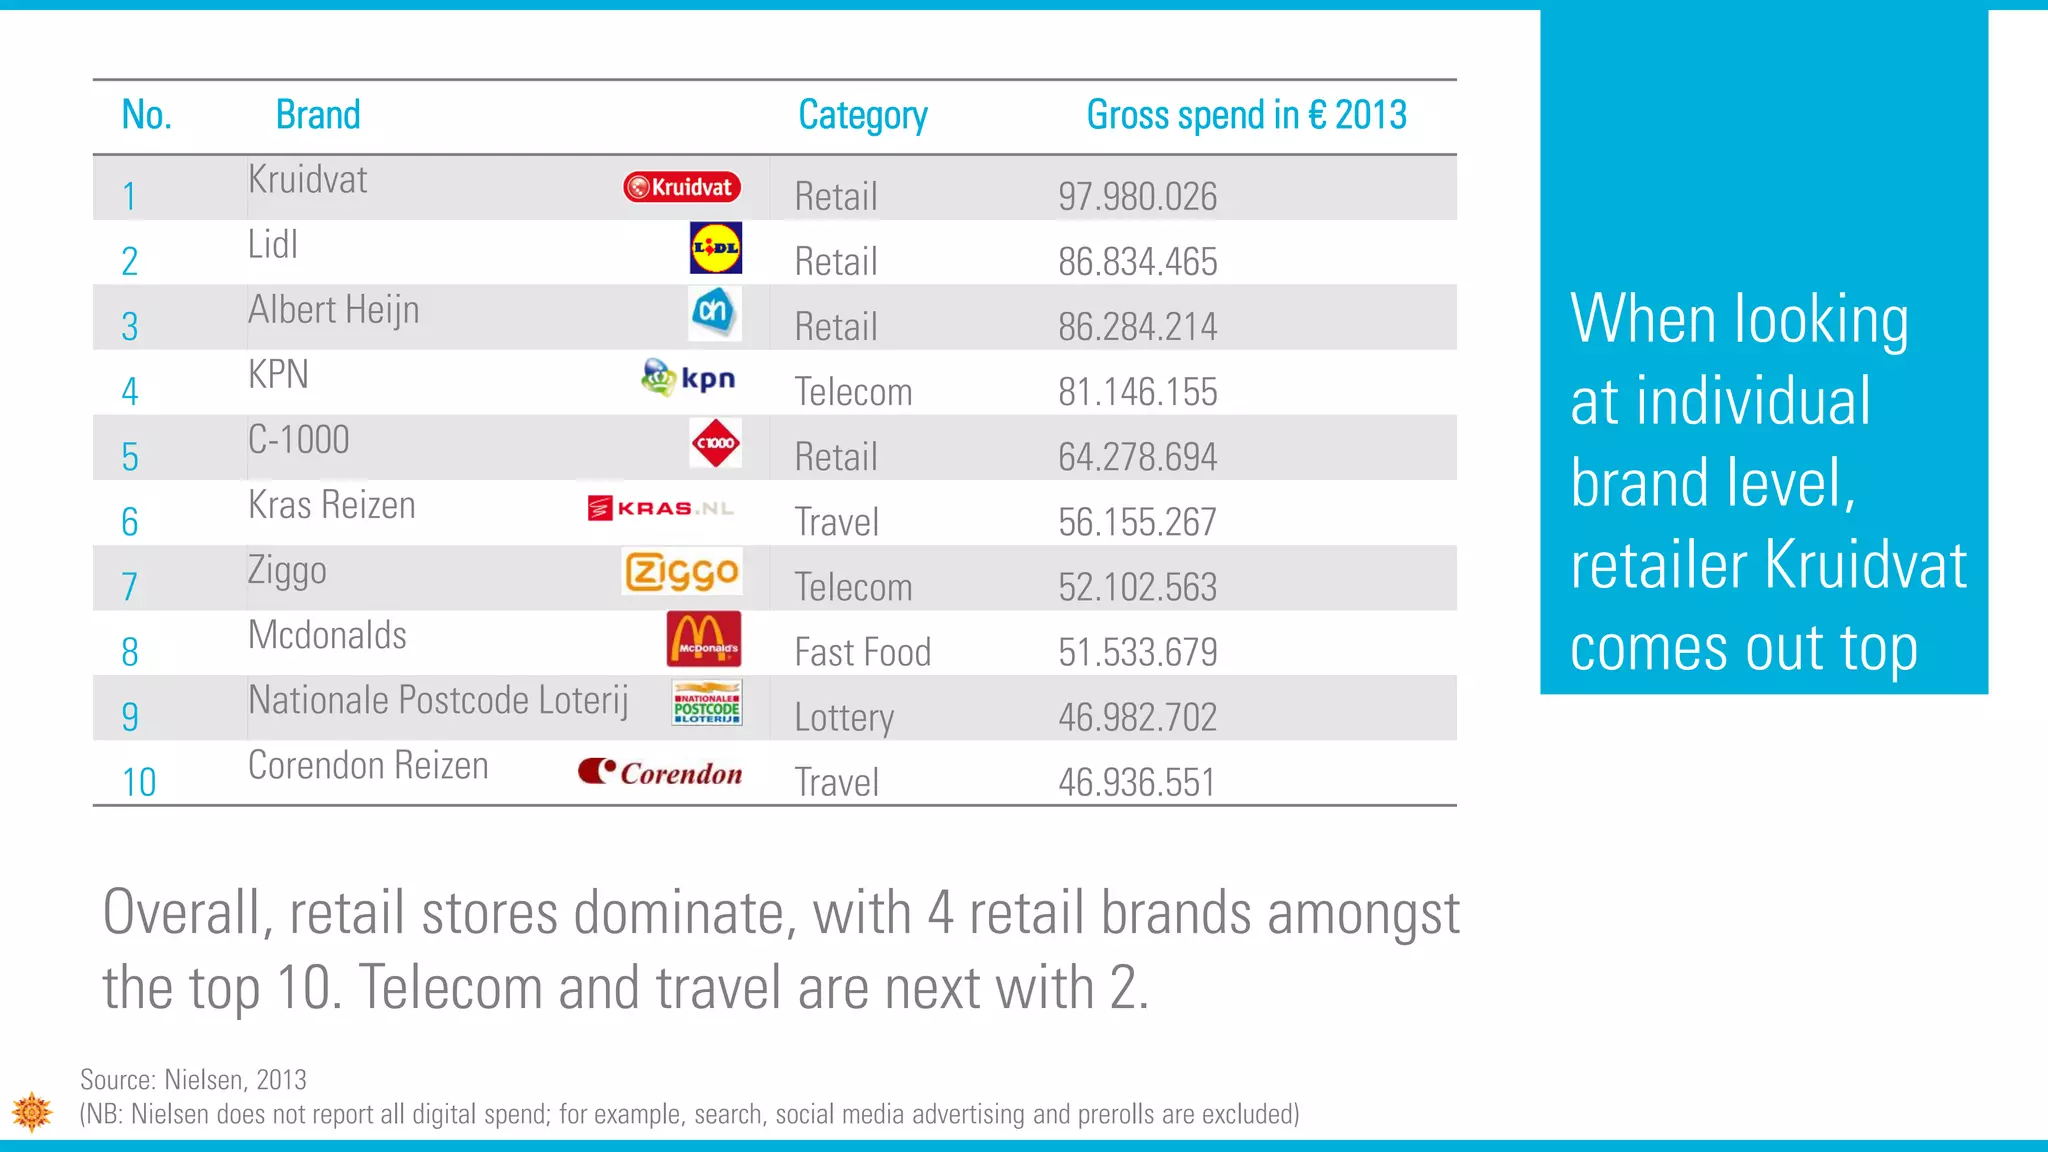
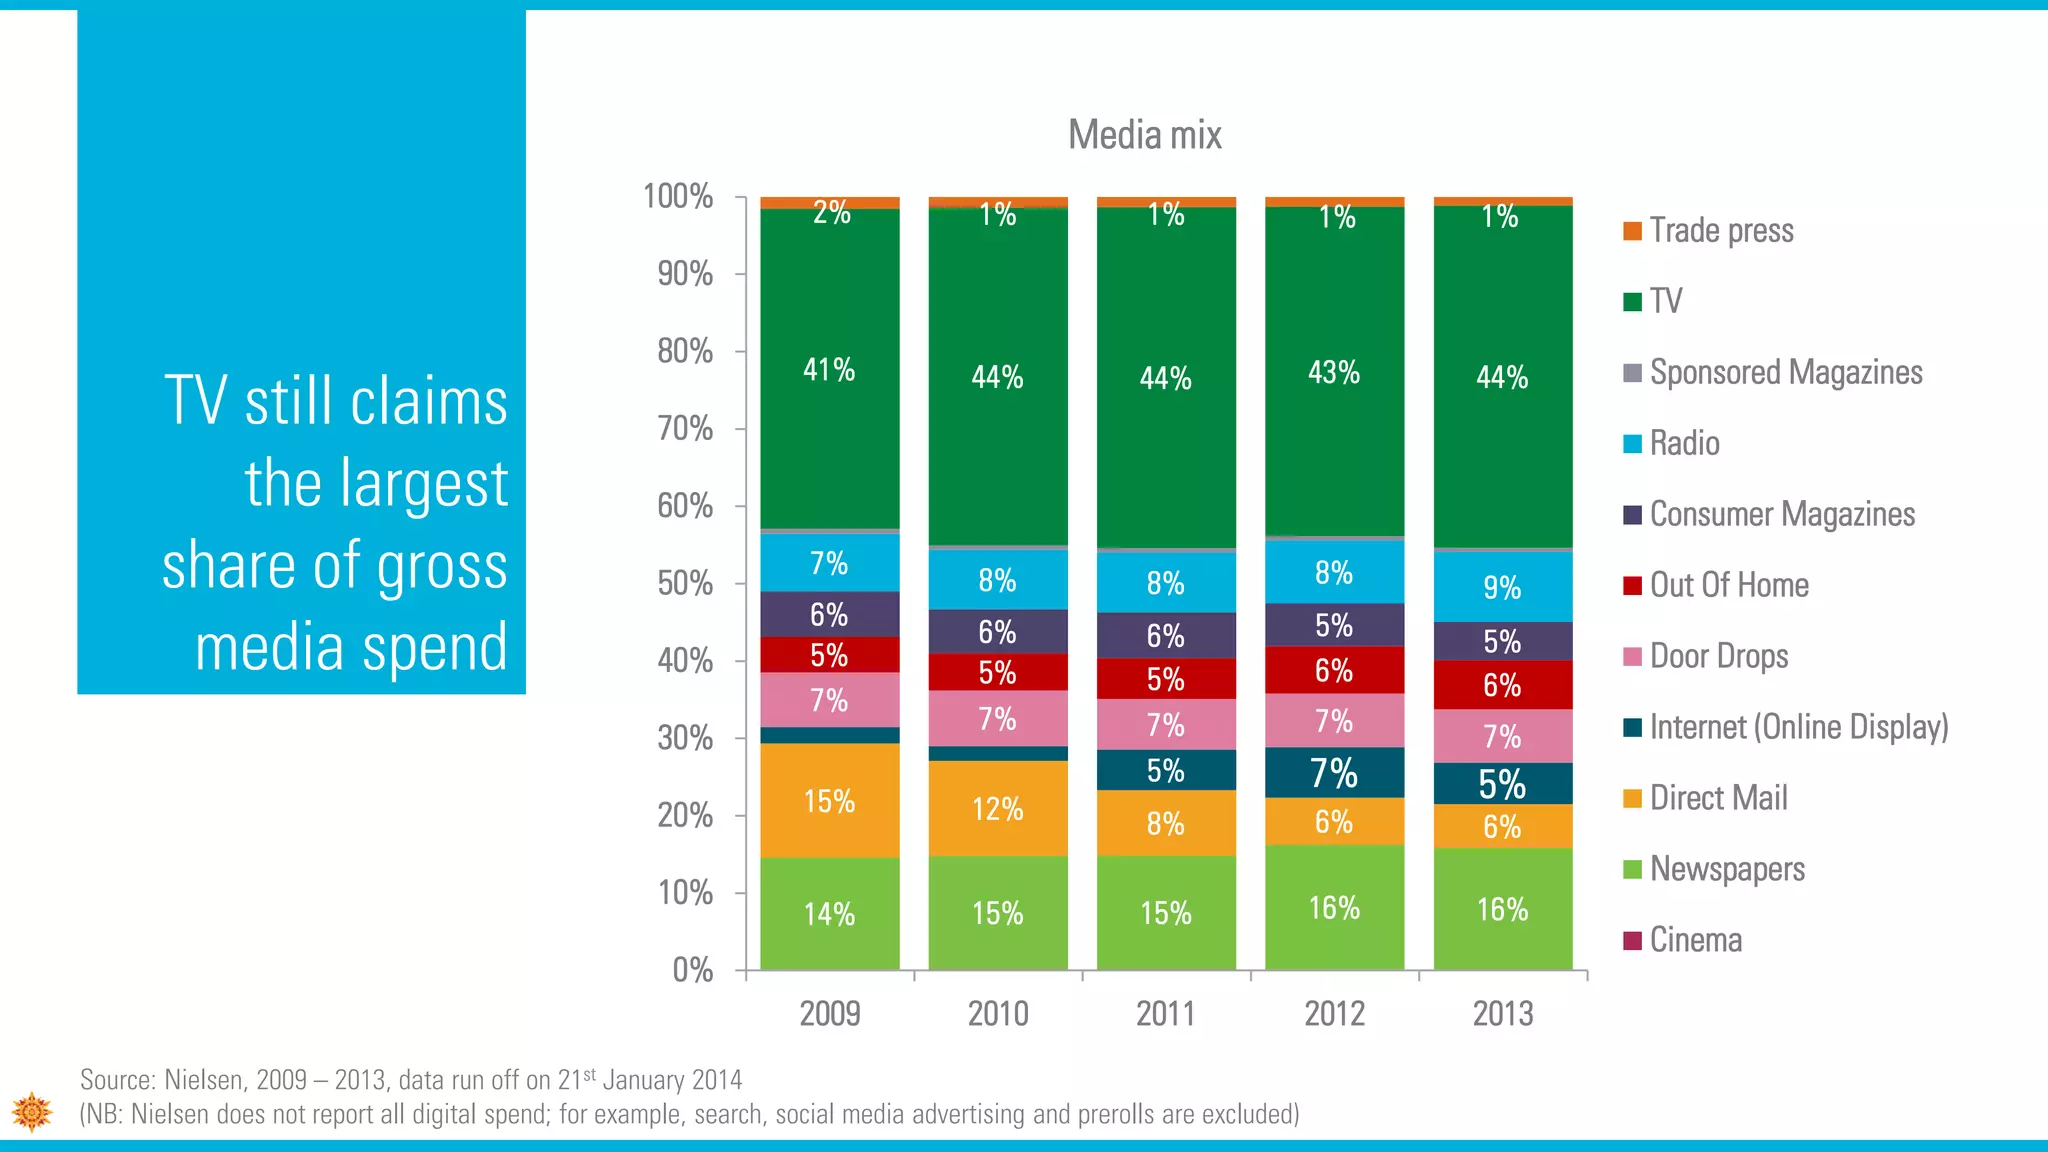
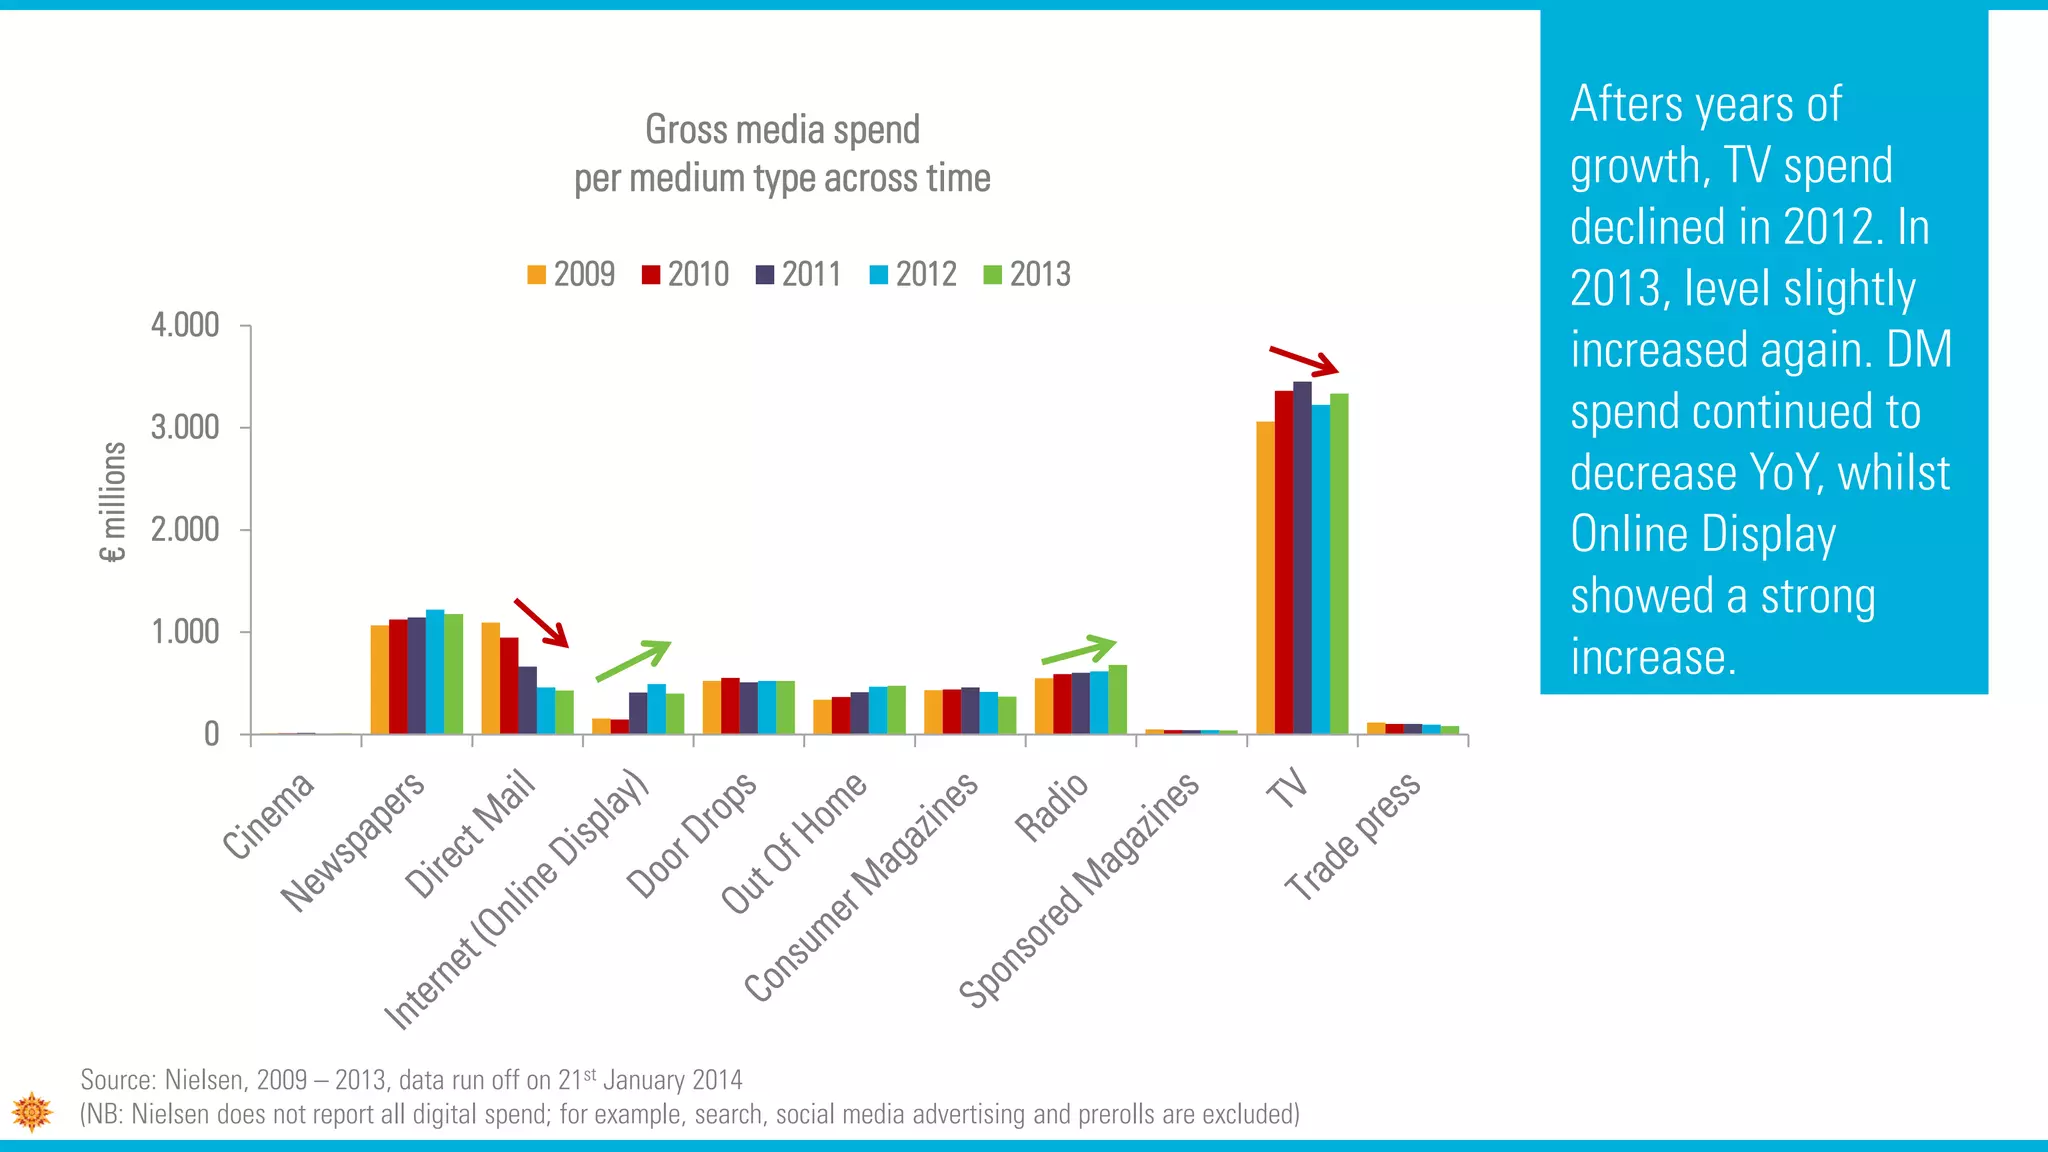
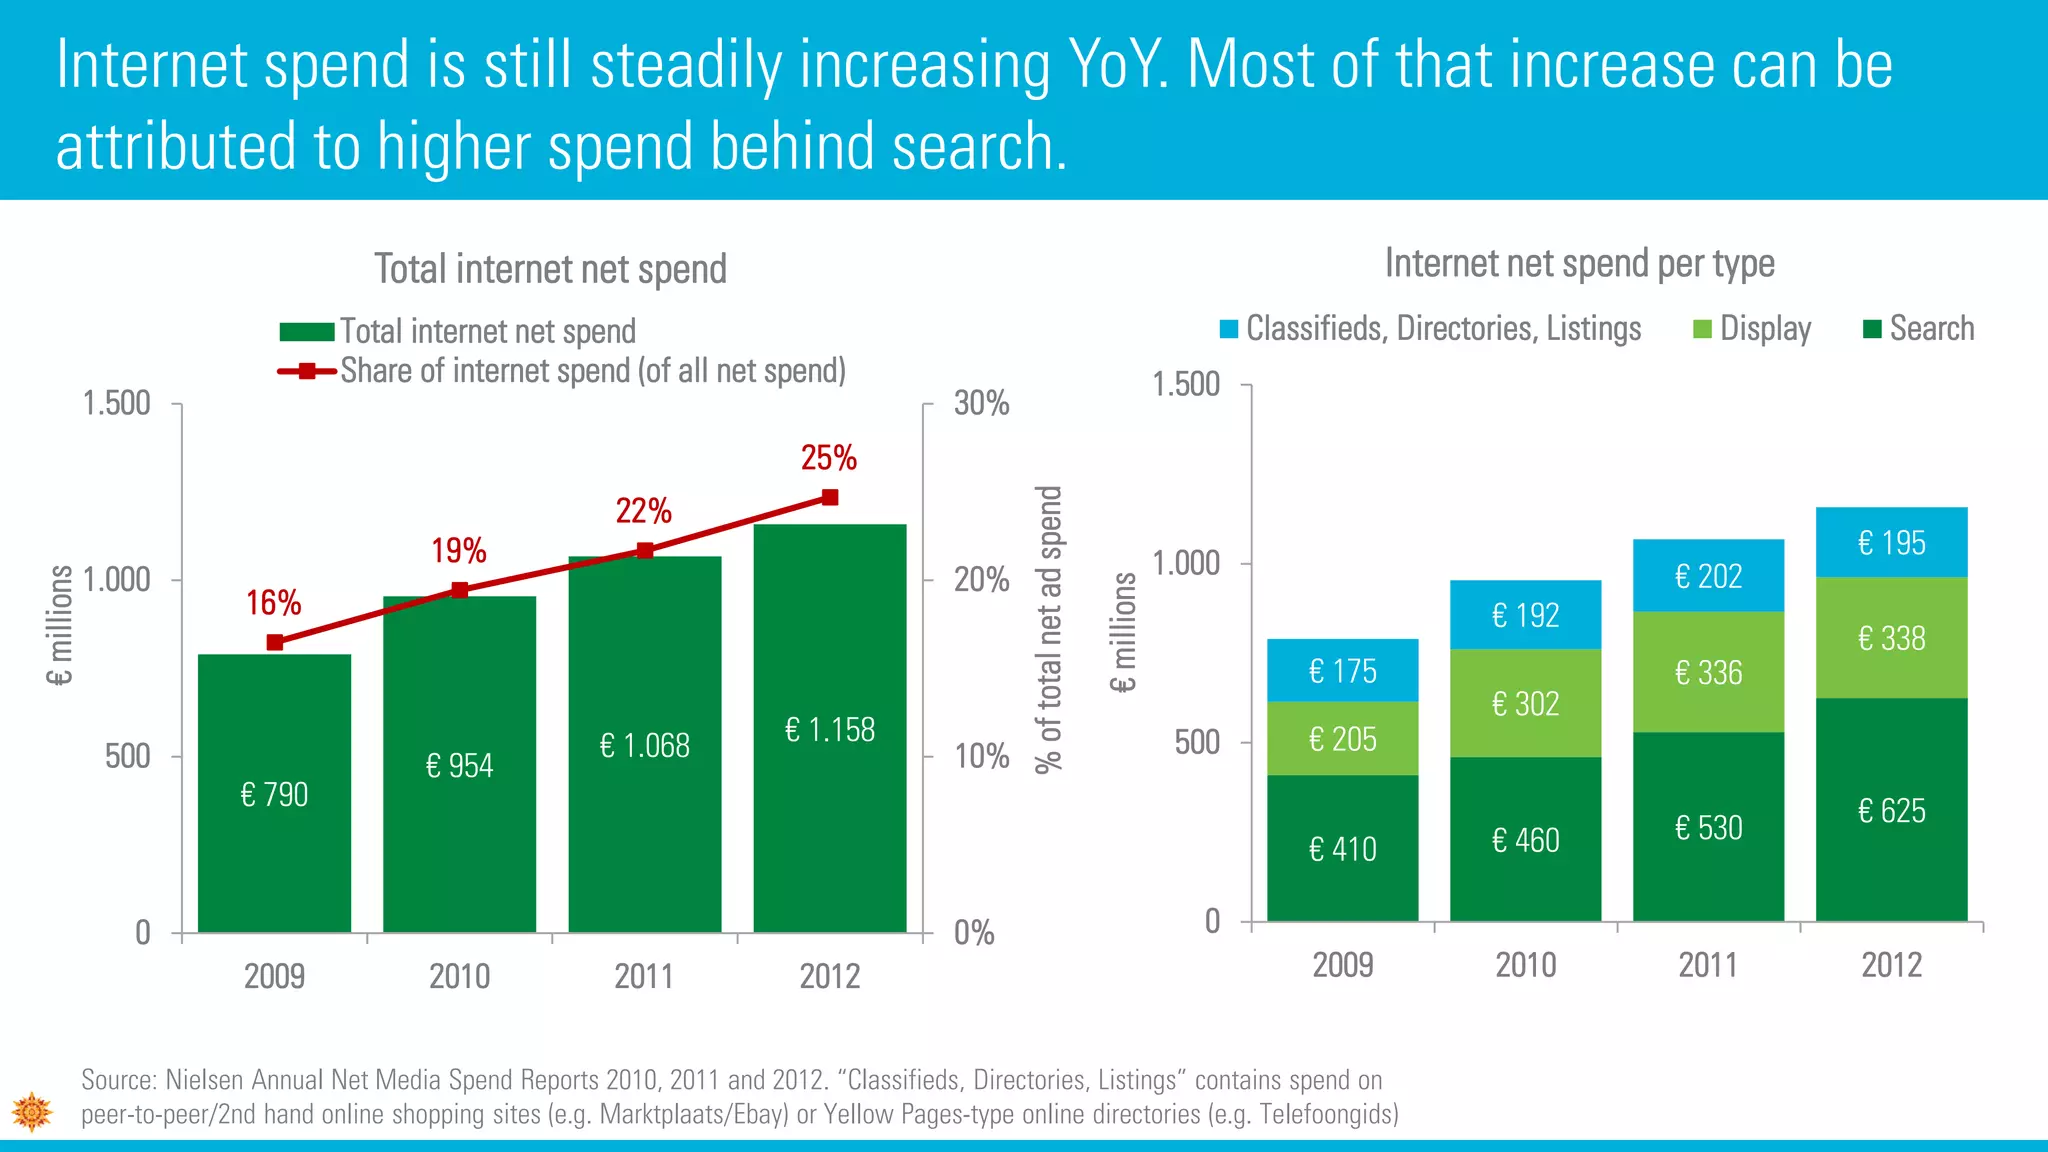
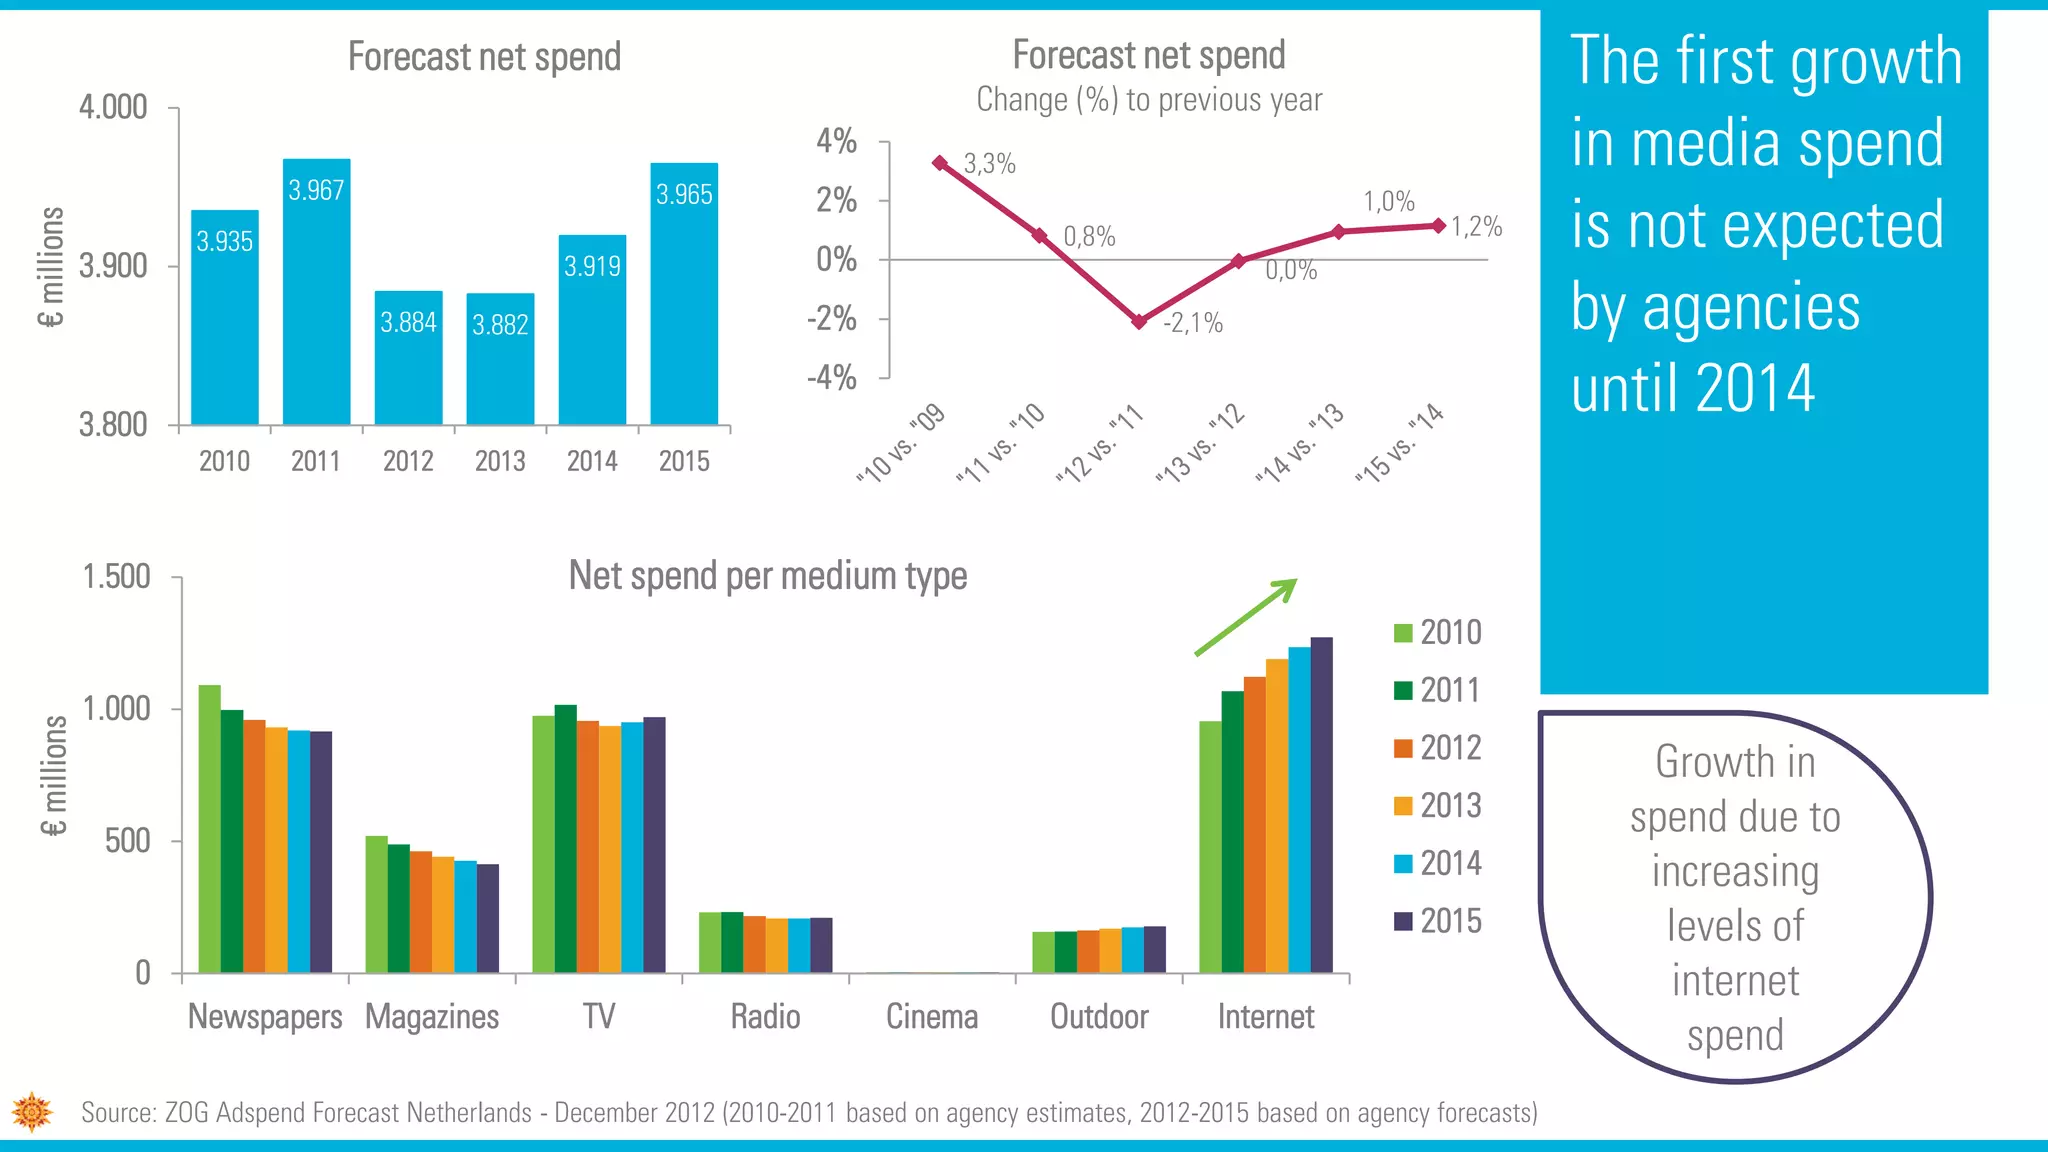
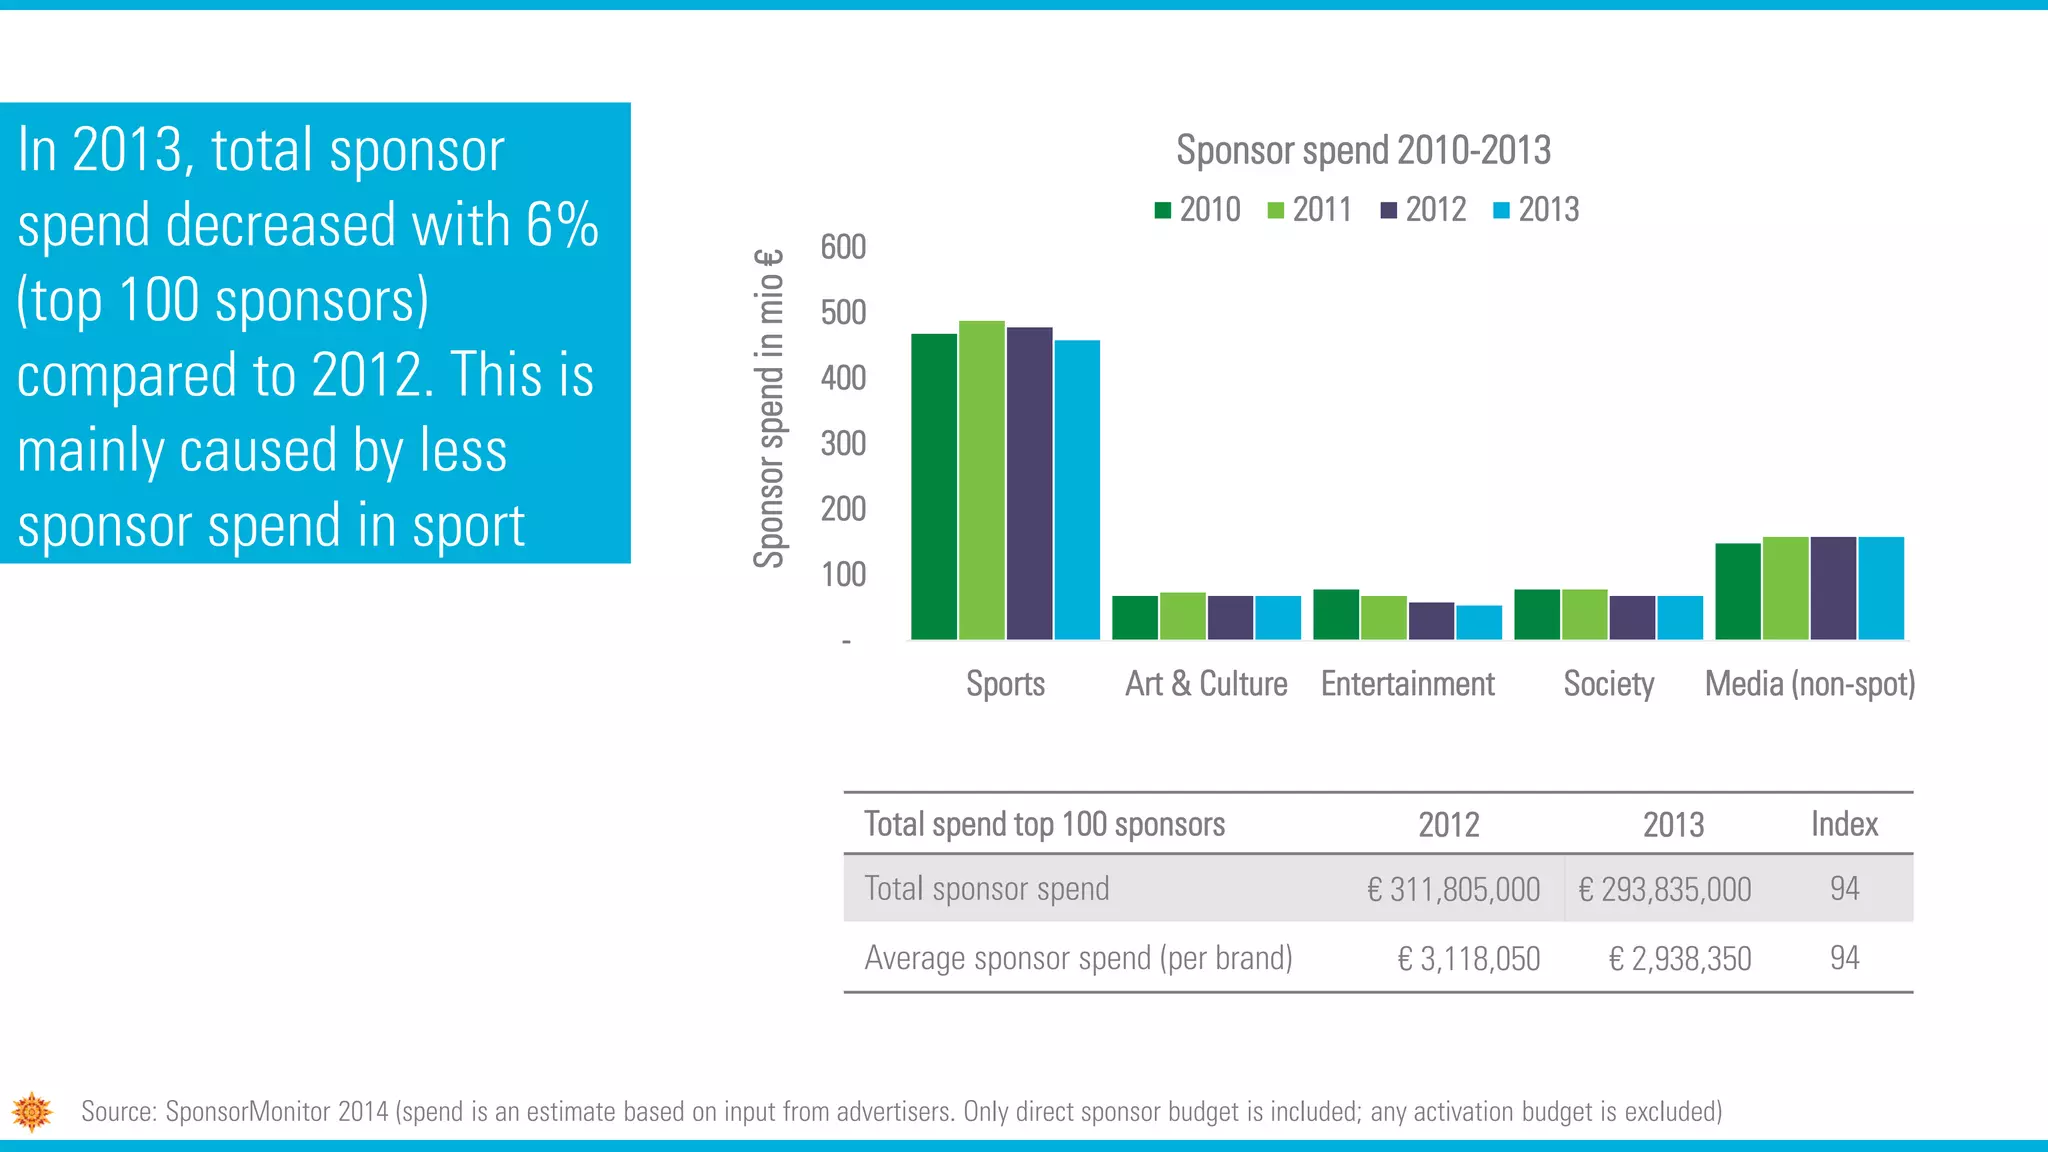
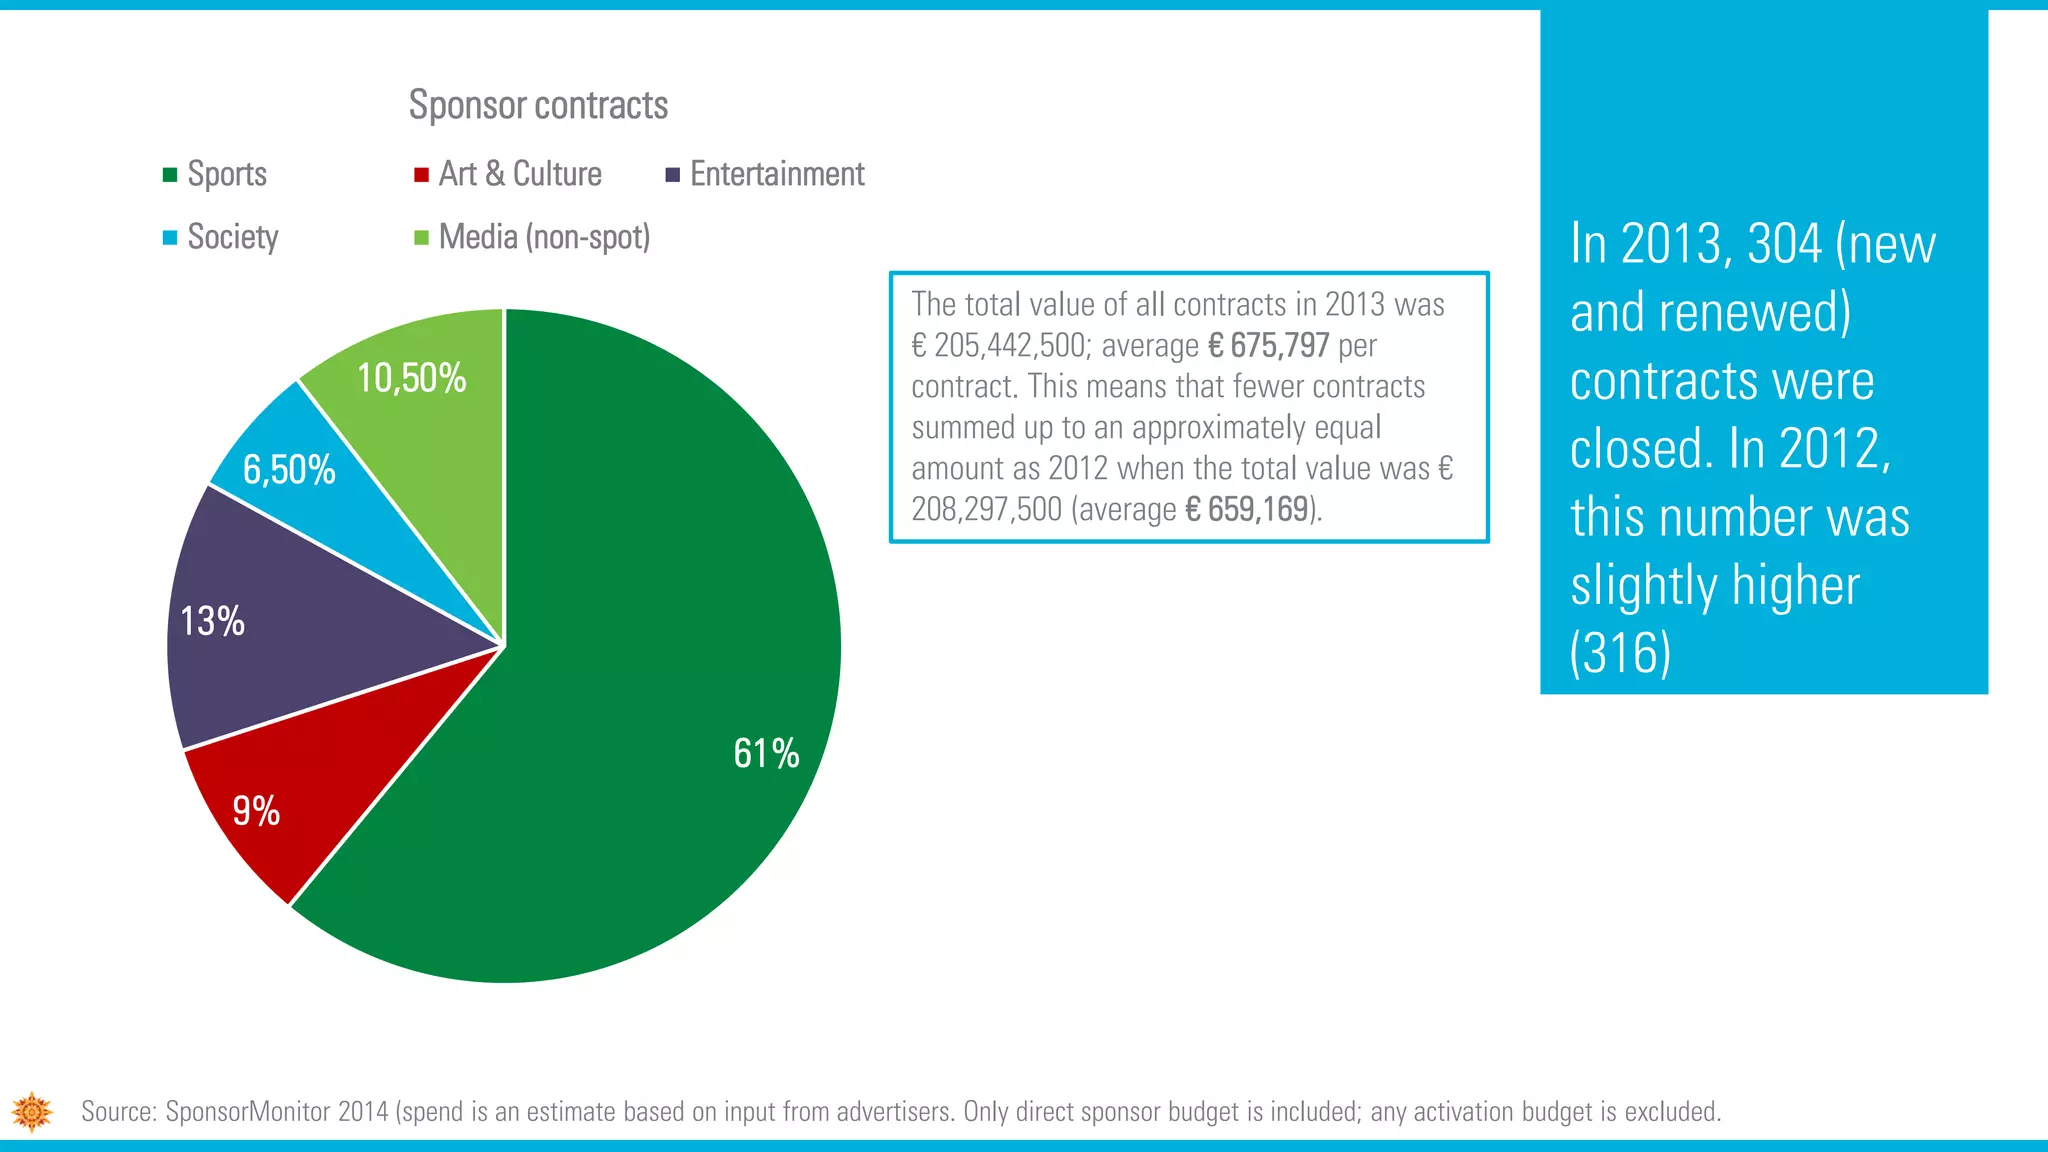
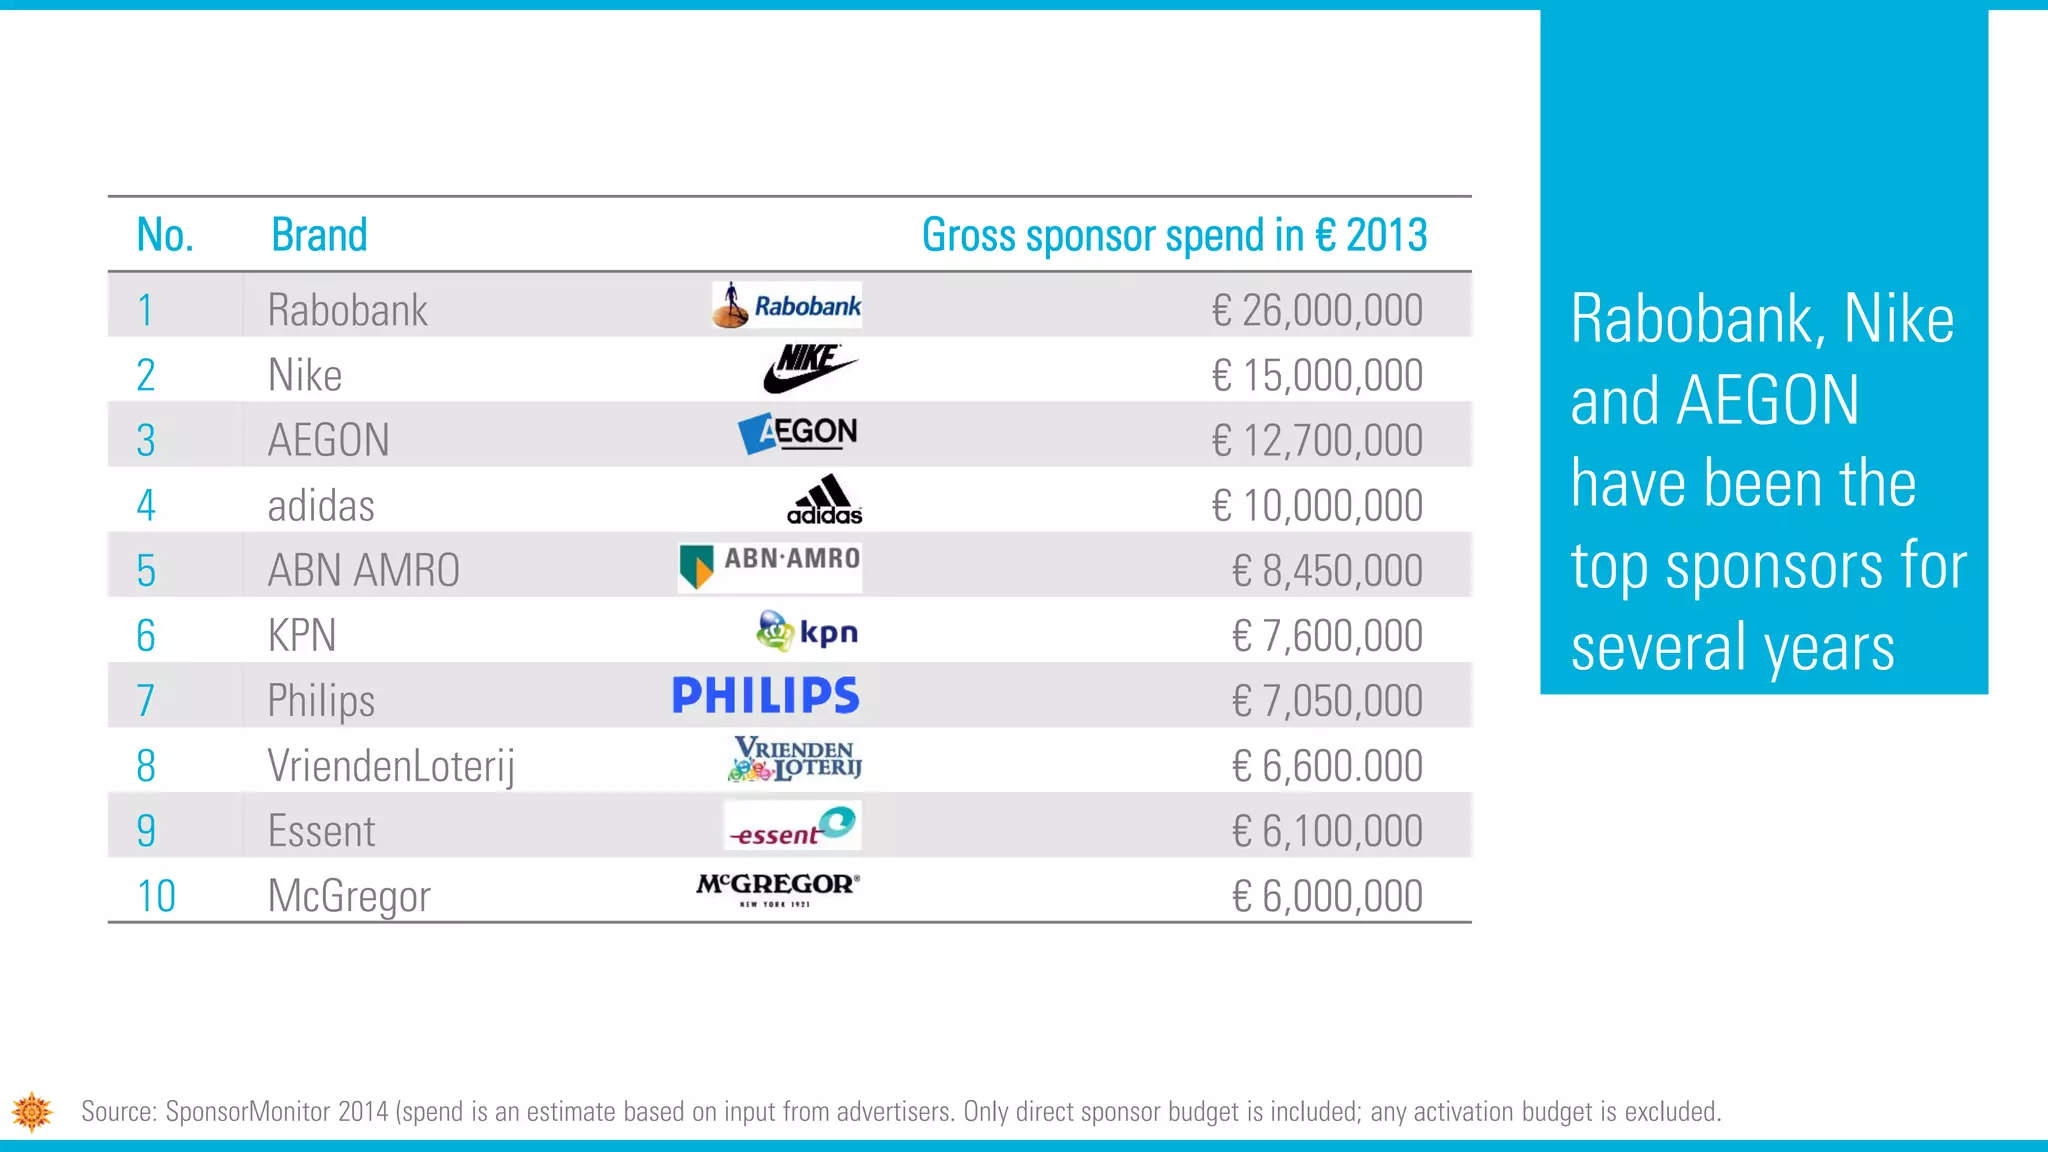
The document provides an overview of media trends in the Netherlands. Key points include:
- Television still claims the largest share of gross media spend, though its share is declining as digital spend rises. Internet display spending is growing rapidly year-over-year.
- Top advertisers are FMCG, retail, and telecom companies. Retail brands dominate the list of top individual brands spending on advertising.
- Total sponsor spending decreased 6% in 2013, mainly due to less spending on sports sponsorships. The majority of sponsor contracts are for sports properties.
- Digital trends like social, local and mobile are increasingly important across media. Consumers are engaging more with digital and multi-screen behaviors.
Dutch Media Landscape 2014 Q4 Updated by StarcomstarcomNL
The document provides an overview of media trends in the Netherlands. It finds that gross media spending increased 4% in 2014, with television claiming the largest share at 47%. Internet spending continues to rise steadily each year as well. Television, outdoor, and radio saw increases in 2014, while sponsorship spending decreased overall. Top advertisers are from FMCG, government, retail, and telecommunications industries.
Dutch media landscape 2014 Q2 update by StarcomstarcomNL
The document provides an overview of media trends in the Netherlands, including:
- Television, radio, digital media, print, and outdoor advertising still account for the majority of gross media spending, though internet spending is growing steadily.
- Retail brands such as Kruidvat and supermarkets dominate the top advertisers, along with FMCG companies like Unilever and government.
- Consumer confidence and disposable household income are increasing after declines during the economic crisis, and online shopping is growing significantly across many categories.
Dutch media landscape 2015 Q3 update by StarcomstarcomNL
The document provides an overview of the Dutch media landscape and consumer behavior trends. It discusses how the population is growing older while household income rises. TV retains the largest share of advertising spending, though online is growing. Programmatic advertising is increasing and now accounts for over 15% of online display spending. Consumer confidence turned positive in 2015 for the first time since 2007.
Dutch media landscape 2013 Q4 update by StarcomstarcomNL
Dutch population is growing older with more single person households. Media spending was relatively stable from 2009-2013, though display advertising saw increases as TV and direct mail declined slightly. Television claims the largest share of spending despite growth in internet advertising. Retail brands dominate brand-level spending, while FMCG and telecom lead at advertiser-level. Sponsorship spending was similar in 2011-2012 with sport claiming most funds. Rabobank, Nike and AEGON are top sponsors.
Dutch media landscape 2015 Q4 update by Starcom starcomNL
The document provides an overview of key statistics and trends in the Dutch media landscape in Q4 2015. It finds that the Dutch population is aging and household income is rising after years of recession. TV claims the largest share of media spending, though online display advertising is growing rapidly through programmatic channels. Emerging trends include the rise of mobile, social media, and the internet of things.
Dutch Media Landscape 2015 Q2 Updated by StarcomstarcomNL
- The document discusses trends in the Dutch media landscape in Q2 2015, including consumption patterns that focus on how people experience media rather than media types.
- Key stats on the Dutch population show continued growth and aging, as well as a rise in disposable household income. Consumer confidence dropped in late 2014 but rose in early 2015.
- Unemployment has decreased for the first time since 2011, though economic growth is estimated to remain modest in the coming years.
- Trends data outlines growth in mobile, social, and programmatic advertising, as well as the increasing importance of experiences over traditional demographics.
Dutch media landscape 2016 Q2 update by StarcomstarcomNL
The document discusses trends in the Dutch media landscape in Q2 2016. It notes that while the Dutch population is growing and aging, disposable household income has increased in recent years. Overall media spend decreased 3% from Q2 2015 to Q2 2016, with only TV showing growth. Online display advertising through programmatic channels grew 19% in H2 2015. Trends seen in the Netherlands include increasing time spent on mobile devices and growing adoption of new technologies like virtual and augmented reality.
Dutch Media Landscape 2015 Q1 update by StarcomstarcomNL
The document provides an overview of media consumption and advertising spending in the Netherlands. Some key points:
- Programmatic trading (automated digital ad buying) has grown rapidly and is expected to account for over 50% of digital display advertising by 2015. Mobile accounts for a growing share of programmatic spending.
- Total media spending in the Netherlands was down 8% in Q1 2015 compared to the previous year. FMCG, telecom, retail, and travel companies dominate advertising spending.
- Trends to watch include the growth of mobile, video, social media, and programmatic advertising, as well as the rise of new technologies like the Internet of Things. Consumers are increasingly media experiences across different devices
Dutch media landscape 2016 Q4 update by StarcomstarcomNL
The document provides an overview of media trends in the Netherlands in Q4 2016. Key points include:
- Newspapers and direct mail saw declines in spending while radio and TV saw higher spending. Programmatic display spending increased 20%.
- The Dutch are watching less linear TV but non-linear viewing is growing. Streaming services now allow offline viewing and smartphones are used more for watching TV.
- Spending and market share decreased substantially for NPO 3 FM radio. Digital out of home advertising is growing as major players expand their digital networks.
- Usage of Facebook continues to grow along with YouTube and Instagram. The number of people on social media and time spent online increases each year.
Dutch media landscape 2016 Q3 update by StarcomstarcomNL
Dutch media spend saw annual growth in TV and radio but decreases in newspapers and direct mail in Q3 2016. Total media spend decreased 2% from 2015 Q3 to 2016 Q3. Radio saw the largest growth at 10% while direct mail declined 47% in that period. TV's share of total spend increased due to declines in newspapers and direct mail. Online display advertising through programmatic channels grew 29% in the first half of 2016. Total net media spend is predicted to rise mainly from increased online spend, while print spend continues decreasing.
Dutch media landscape 2016 Q1 update by StarcomstarcomNL
The document provides an overview of key stats and trends in the Dutch media landscape in early 2016. It finds that Dutch consumer confidence dropped significantly in Q1 2016 compared to the previous year. Meanwhile, TV continues to claim the largest share of gross media spending, though spending on cinema, TV and outdoor media all grew from 2015 to 2016. The share of total net media spending on internet continues to exceed that of audiovisual media like TV and radio.
Dutch Media Landscape 2017 Q1 update by StarcomstarcomNL
Instagram and Netflix continue growing rapidly and are now among the top 10 apps based on reach in the Netherlands. Traditional TV players like NPO and new entrants like VICELAND are mentioned. Millennials watch 3 hours more online video daily than those aged 55+. Cinema visits increased in Q1 2017 while radio stations 3FM and BNR lost market share. Instagram saw the largest increase in active users while WhatsApp and Facebook also grew.
Dutch media landscape 2014 Q3 update by StarcomstarcomNL
This document provides an overview of media trends in the Netherlands as of Q3 2014. It discusses the Dutch population and economic indicators, breakdowns of media spending, and trends in different media sectors. Television still claims the largest share of gross media spending, though online/internet spending is growing steadily. Retail dominates advertising spending, while FMCG and government also rank highly as advertisers.
Dutch media landscape 2013 Q3 update by StarcomstarcomNL
The document provides an overview of media trends in the Netherlands for 2013 Q3. It finds that the Dutch population is aging and household sizes are decreasing. Consumer confidence remains low due to stagnant incomes. Total media spending was relatively stable from 2009-2012, though declined slightly in 2012, mirroring declines in industry spending. Television claims the largest share of spending, though internet spending is steadily increasing. Retail companies dominate overall advertising spending, while the retailer Kruidvat spends the most on individual brands. Sponsorship spending was also relatively flat from 2011-2012.
Dutch media landscape 2018 Q2 update by StarcomstarcomNL
1) TV viewing time per day has further decreased in the Netherlands, especially during the hot summer months of 2018.
2) Radio host Gerard Ekdom leaving Radio 2 for Radio 10 has had a positive effect on Radio 10's market share.
3) New on-demand streaming services like FILM1 and YouTube Music have entered the Dutch media market.
The document summarizes key developments in the Dutch media landscape in Q1 2018. Major points include:
1) Talpa now owns news agency ANP after acquiring it from Veronica and will likely integrate it into a new TV format.
2) Public broadcaster NPO had high market shares in Q1 due to events like the Winter Olympics and popular shows.
3) There were major shifts in radio with the transfers of prominent DJs like Gerard Ekdom and Edwin Evers.
4) Digital news platform Blendle launched an audio service in response to the rise of podcasts.
Private Equity consolidating the European software marketRon Belt
We have researched the M&A activity in the European and found that there is a growing number of active buyers. Similar to other sub sectors, Private Equity has found the software market as yet another market to consolidate. In the report we have identified a number consolidation platforms that are looking for add-on acquisitions. We also analyzed the most recent deals and finally we provide some insights in how these Private Equity deals are structured.
Dutch media landscape 2017 Q4 update by StarcomstarcomNL
The document summarizes recent developments in the Dutch media landscape in 2017. It notes that digital ad spending is shifting more to video from banners, and competition is growing in the video-on-demand market. It also discusses new experiences like 4DX cinema and the growth of platforms like Amazon Music. Overall media spending continues to increase, especially for television, while digital advertising such as search and social media are underreported in traditional measures.
Digital ad spend in Europe increased by 11.9% in 2013 to surpass the €27bn mark, with the UK extending its lead as the most developed market in the region, although growth in Western Europe’s second-largest market (Germany), was relatively flat, according to figures released by the IAB.
Dutch media landscape 2017 Q3 update by Starcom starcomNL
The document summarizes recent developments in the Dutch media landscape in Q3 2017. Key points include:
- Talpa now owns all SBS channels after John de Mol's purchase from Sanoma.
- Special interest channels seem to be gaining popularity while branddeli's market share rises.
- New streaming services like Facebook Watch and Disney+ will provide competition for Netflix.
- Cinemas are experimenting with alternative live content like boxing and Game of Thrones.
- NOS.nl has surpassed Nu.nl to become the main Dutch online news site.
Dutch Media Landschap 2017 Q2 update by StarcomstarcomNL
The document provides an overview of media trends in Q2 2017 in the Netherlands. Some key points:
- TV viewing is declining but TV ad spend is still increasing. Cinemas are experimenting with mobile interactivity.
- Instagram stories now has more users than Snapchat. There is discussion around advertisers' responsibility for editorial content.
- Newspapers are increasingly read on mobile versus print. Spend on online advertising, especially display and video, is growing.
- Programmatic trading of online ads is increasing and now makes up over half of all digital display advertising spend.
Digital Marketing for Finance Industry in Central and Eastern EuropeMarta Klepka
What are the main digital marketing trends that are coming to Central and Eastern Europe? Why internet marketing is a chance for the financial sector, is it different to others in terms of digital opportunities?
Find out more in this presentation and Q&A with Marta Klepka, Digital Director of Publicis Groupe agencies in CEE http://emea.blog.performics.com/2014/07/03/digital-trends-insights-cee-region-qa-marta-klepka/
This document provides an introduction to understanding ad tech. It begins by explaining that ad tech fuels the global economy through billions in investment, employment, and ad spend. It then defines ad tech as using technology to make advertising faster, easier, and more effective. The document aims to help readers understand this complex industry so they can confidently invest in it through employment, financial backing, or informed conversations. It then outlines the guide's contents which will cover why ad tech is important, how it works, and a glossary of terms.
Dutch Media Landscape 2018 by Publicis SpinestarcomNL
The document provides an overview of media trends in the Dutch media landscape in 2018. Some key points include:
- Linear TV viewing decreased 7% year-over-year to 138 minutes per day on average, while total TV time was 155 minutes.
- New social media players like TikTok are emerging while Google+ is shutting down. Instagram continues growing.
- Cinema visitor numbers stabilized after continual growth since 2007, with "Bohemian Rhapsody" becoming the most visited film in 20 years.
- The public broadcaster NPO gained market share to 41% despite a decline in spending, as commercial broadcasters make diverse investments.
RTB growth perspectives in CEE 2010-2016Guntis Stirna
Extract of market overviews and forecasts 2011-2013 on the development of digital > display > programmatic buying World Wide > Western Europe > Central & Eastern Europe > Baltics
146676513 e marketer-mobile-ad-trends-in-france-and-germany-pdfSumit Roy
Mobile advertising is growing quickly in France and Germany, though spending still lags behind the UK. Spending on mobile ads in France is projected to reach $198 million in 2013 and grow to $792 million by 2017, while in Germany spending will reach $349 million in 2013 and $1.8 billion by 2017. Large multinational companies are leading the growth of mobile advertising in both countries through innovative campaigns. As smartphone and tablet adoption increases, more consumers are seeing and engaging with mobile ads.
Global Social Media Trends (includes Argentina and Chile)akmohr
The document summarizes findings from the Randstad Workmonitor survey regarding social media use among employees in various countries. Some key findings include: 1) Over half of employees globally have social media profiles, mainly using them to stay connected with friends and family; 2) Many employees are aware employers can view their profiles and use social media to research potential employers; 3) About a third of employees receive guidelines from employers on appropriate social media use, though practices vary widely between countries.
PERM - Transporte ferroviario de pasajeros en RosarioInfrapública
El documento describe un proyecto para desarrollar un sistema ferroviario metropolitano y regional en Rosario y su área metropolitana. Actualmente la red ferroviaria se usa principalmente para carga y su estado no es adecuado para pasajeros. El proyecto propone rehabilitar la infraestructura existente para implementar trenes livianos que conecten diferentes sectores de Rosario y localidades de la región. Esto mejoraría la movilidad, reduciría la congestión y sería beneficioso desde lo social y ambiental. Se analizarían cuatro
Lazard Investment Research: Update on the Improving Foundations of US House P...LazardLazard
Home prices have continued their upward climb, as evidenced by the latest report from S&P/Case-Shiller. However, the most recent data show a sequential deceleration in aggregate price increases. While there are several variables that influence the price trajectory of housing, the recent spike in borrowing rates—in anticipation of tapering by the US Federal Reserve—appears to be a primary driver. In this paper, we discuss the key variables, in addition to housing price indices, that contribute to create a more complete assessment of the fundamentals for a further price recovery.
El documento describe la historia y estrategias de mejora continua de Amortiguadores Gabriel de Venezuela. La compañía se fundó en 1963 y ha desarrollado varias innovaciones tecnológicas en amortiguadores a lo largo de los años para mantener su liderazgo en el mercado altamente competitivo de autopartes. Para adaptarse a los cambios en el ambiente competitivo, la compañía ha utilizado estrategias como la inversión en innovación, mejora de procesos y satisfacción de clientes.
Este documento presenta una variedad de válvulas y accesorios de acero inoxidable fabricados por Eurobinox. Incluye válvulas de mariposa, válvulas manuales, válvulas neumáticas de pistón, válvulas asépticas, uniones, mirillas, filtros y equipos eléctricos. Proporciona detalles técnicos como materiales, dimensiones y especificaciones de cada producto.
Síndrome Anémico Carencial En El EmbarazoKevin Dickens
El documento discute la anemia como una complicación común del embarazo, causada principalmente por deficiencias de hierro y ácido fólico. Explica los requerimientos nutricionales aumentados durante el embarazo y las consecuencias de la anemia para la madre y el feto, como parto prematuro y restricción del crecimiento. También resume las pautas para la prevención, detección y tratamiento de la anemia durante el embarazo.
In this presentation, I explore the concept of Activity and CHAT (Cultural-Historical Activity Theory) in the context of The Little Red Hen, then apply it to my doctoral research to understand how an augmented reality game mediates the cultural models of campers at a traditional woods camp.
Alcatel Lucent- Change The ConversationArrow ECS UK
The document outlines Alcatel-Lucent's 2012 channel marketing plan. It discusses priorities like boosting SMB business through promotions for OXO upgrades and replacements. It details initiatives for mid-market sales of OpenTouch and OmniPCX Enterprise, as well as network infrastructure. The plan provides campaign materials to help resellers promote solutions. It announces rewards through the Vitalize program for sales of priority products and migrations. Resellers must register by Q1 2012 to participate in initiatives and qualify for rewards.
Este documento presenta la nueva cura nocturna Botanical D-Tox de Sisley para liberar la piel de las toxinas acumuladas. La cura actúa eliminando las proteínas deterioradas y toxinas, reforzando los mecanismos de defensa antioxidantes de la piel y estimulando la microcirculación para favorecer la eliminación de impurezas.
El documento presenta 10 poemas de diferentes épocas pertenecientes a la lírica tradicional española. Incluye jarchas de la literatura hispanoárabe, cantigas galaico-portuguesas de la Edad Media, poemas anónimos del siglo XV y poemas cancioneriles. Todos ellos comparten temas amorosos y estructuras poéticas como el estribillo. Se analizan rasgos estilísticos comunes y diferencias en el tratamiento del amor y la convivencia entre cristianos y musulmanes.
Este documento presenta información sobre la Oficina Diocesana de Educación Católica (ODEC) en Chachapoyas. Detalla la dirección general y los docentes colaboradores de ODEC-Chachapoyas. Además, proporciona una presentación que destaca que este material apoyará al docente en ayudar a los estudiantes a crecer en la fe a través de actividades religiosas alegres.
El documento presenta información sobre la ciudad de Aguadilla en Puerto Rico, incluyendo su ubicación, datos históricos y personalidades destacadas como Manuel Méndez Ballester, Luis Ángel Márquez, Carlos Juan Delgado y Rafael Hernández Marín. También incluye fotos antiguas y contemporáneas de la ciudad y poemas dedicados a Aguadilla.
the IBM Design Thinking methodology is changing the way IBM approaching software design.
Changing a culture of a company that is 104 year old and have about 480,000 employs worldwide and cross culture is complex, yet rewording process. In the talk I’ll explain the IBM Design Thinking methodology, and how we work toward move our focus to the users in an enterprise oriented technology company.
En los años 70, un grupo de padres fundó el Club Burriana Fútbol Base para ofrecer a los jóvenes de Burriana la oportunidad de jugar y aprender fútbol. Actualmente, el club tiene 19 equipos y cerca de 300 jugadores. Además de proveer jugadores al equipo local CD Burriana, varios jugadores del club han avanzado a equipos profesionales. El club se enfoca en formar buenos jugadores y personas a través de un entrenamiento integral y una filosofía basada en el descubrimiento guiado.
This document summarizes key aspects of gender and sexuality from a biological and social perspective. Biologically, gender is determined by sex chromosomes and influenced by sex hormones. Men and women differ in their timing of puberty, physical characteristics, and risks for certain mental health issues. Culturally, gender roles shape the behaviors expected of each sex, though these roles vary across societies and are also influenced by individual factors. The document also discusses gender identity, sexual orientation, hormones' effects on behavior, and cultural influences on sexuality.
Mobile App Marketing Trends & Strategies for Asia - ARPU, App Store Rank Data...appsasia
In our research you will find this data per country:
Average ARPU, Market Share and Size, Top Genre's in the Top 25 (iOS & Android), Expected daily downloads and revenue for Top 1, Top 5, Top 10, Top 25 and Top 50 for Google, iOS and iPad.
Countries covered in this research are: Korea, Japan, China, Taiwan, Hong Kong, Singapore, US, UK, Germany & France.
Hopefully this research will help you in your global mobile marketing strategy.
Colaboración digital versus colaboración presencialCONECTIVIDAD XXI
El documento analiza la colaboración digital frente a la colaboración presencial. Muestra que hay más información disponible sobre la colaboración digital, especialmente en el ámbito educativo. El objetivo es mostrar las preferencias de los usuarios y analizar cómo se trata este tema en internet. Concluye que hay un sesgo a favor de la información sobre colaboración digital y que esta está más presente en educación que en el ámbito laboral.
We often optimize our software for performance, but what also optimizing our development teams for happiness? Take a look at how the tools you choose for your development team can impact developer happiness, and learn how to keep your teams happier and more productive.
*The graph on slide 3 is fabricated data, because studies also show that people are more likely to believe statements accompanied by scientific data.*
We Are Social's comprehensive new Digital in 2016 report presents internet, social media, and mobile usage statistics and trends from all over the world. It contains more than 500 infographics, including global data snapshots, regional overviews, and in-depth profiles of the digital landscapes in 30 of the world's key economies. For a more insightful analysis of the numbers contained in this report, please visit http://bit.ly/DSM2016ES.
The Real World is Posterscope's monthly market update, containing latest industry news, key facts and figures and some really cool out-of-home campaigns.
Spanish Digital Startup Ecosystem Overview 2015Aleix Valls
Spain is known for many things all around the world, but digital or technology have not been one of such things for many decades. However, things are slowly but steadily changing for both regions.
Barcelona has been described by many as and up-and-coming technology hub in Europe, thanks to a healthy combination of high class educational institutions, government support, ability to attract foreign talent and various waves of entrepreneurs and companies that have planted the seeds for generations to come.
Given the young nature of Spain and Barcelona’s technology scenes, an analysis of their evolution has yet to be produced. 2015 was a record year for the country, and this report will analyse the bigger trends that have defined this record period of time and the areas that could and should still improve over the next few years in order for Spain and Catalonia to become worldwide known for their technology advancements.
This document provides an agenda and materials for Alma Media Capital Markets Day on November 27, 2014. The agenda includes presentations on digital strategy from Kai Telanne, financial development from Juha Nuutinen, and closing remarks again from Kai Telanne. The materials include data and charts on trends in digital media consumption, the impact on the media market, Alma Media's digital growth strategy and key initiatives, financial performance and targets, and segment results. The goal is to provide investors insights into Alma Media's transition to digital and growth opportunities.
The Real World is Posterscope's monthly Out-of-Home market update, containing latest industry news, key facts and figures and some really cool OOH campaigns.
This document provides an overview of the out-of-home advertising industry in the UK, including key metrics and trends. It discusses revenue and spending data for various OOH formats and categories. It also profiles the major UK OOH companies such as JCDecaux, Clear Channel, Exterion Media, Primesight, and Ocean Outdoor, outlining their key areas of investment and proprietary research.
- Mobile device ownership in the UK has grown significantly, with smartphone ownership reaching 67% in 2013. Tablet ownership has also doubled in the last year.
- Mobile advertising spend in the UK has grown strongly, with over £1 in every £10 of digital advertising now being spent on mobile. Mobile display advertising saw particularly strong growth between 2011-2012.
- Major publishers are seeing nearly half of their online content being consumed via mobile devices. Many companies also report a significant portion of online sales coming through mobile.
- Successful mobile marketing examples demonstrate using mobile to enhance other media like print, outdoor, and driving in-store purchases. The future will require completely adjusting strategies to focus on mobile.
- Mobile device ownership in the UK has grown significantly, with smartphone ownership reaching 67% in 2013. Tablet ownership has also doubled in the last year.
- Mobile advertising spend in the UK has grown strongly, with £1 in every £10 of digital ad spend now on mobile. Mobile display advertising, in particular, saw large growth between 2011-2012.
- Major publishers are seeing nearly half of their online content consumption on mobile and tablet devices. Many brands are seeing a significant portion of online sales and traffic coming from mobile.
- Examples are shown of mobile campaigns that integrated with other channels like outdoor, print, and in-store to drive awareness and purchases.
- By 2013, the majority of search
This document provides an overview of out-of-home advertising in a changing world. It discusses how formats are converging due to new technologies and mobile connectivity. It also outlines several major out-of-home advertising companies in the UK, including their key areas of investment like digital platforms, proprietary research, and expanding their geographic coverage.
To kick off the IGNITION conference, Business Insider CEO Henry Blodget delivered the following presentation put together with the help of the BI Intelligence team.
This document provides an overview of trends in the out-of-home (OOH) advertising industry in the UK, including information on various OOH media companies and formats. Key points include spending trends that show a rise in digital OOH revenue, the top spending categories and advertisers in the first half of 2015, and details on investments and offerings from major OOH companies like JCDecaux, Clear Channel, Exterion, Primesight and Ocean Outdoor. Proprietary research tools and data-driven targeting capabilities are also mentioned.
The Real World is Posterscope's monthly Out-of-Home market update, containing latest industry news, key facts and figures and some really cool OOH campaigns.
This document summarizes the key findings of a large pan-European online survey conducted in 16 countries in 2009 on digital media consumption. The survey included over 32,000 internet users and was representative of each country's online population. It covered topics like mobile internet usage, online activities, e-commerce purchases, and preferences for accessing content on mobile versus PC. The findings were enriched through an international online discussion board and the author's expertise in digital research.
Similar to Dutch media landscape 2014 Q1 update by Starcom (15)
Title: Making Money the Easy Way: A Quick Guide to Generating IncomeWilliamZinsmeister
Welcome to "Making Money the Easy Way: A Quick Guide to Generating Income." This book is designed to provide you with practical, actionable strategies to generate income with minimal effort. Whether you’re looking to supplement your current income or create a full-time revenue stream, this guide covers a variety of methods to help you achieve your financial goals. We will explore opportunities available online, various investment strategies, profitable side hustles, creative approaches, and essential financial tips to ensure sustainable income growth.
This document was submitted as part of interview process for Content Strategist position at Viapulsa, an Indonesian tech company which offers service to convert/transfer mobile credits into bank account.
Digital Marketing Company in India - DIGI BrooksDIGI Brooks
This infographic provides guidance on marketing analytics, helping businesses grow using tools like Google Analytics and AI, measuring ROI, and analysing future trends to track business development.
https://digibrooks.com/digital-marketing-services/
How to Generate Add to Calendar Link using Cal.etY
Cal.et is a free tool that helps you create “Add to Calendar” links for your events. It supports popular calendar platforms like Google, Apple, Outlook, Yahoo, and Office365. Users can generate short, shareable URLs, customize event details, and even create QR codes for easy access. It’s ideal for embedding event links in emails, websites, and social media, making it easier for participants to save event information directly to their calendars.
How to Start Affiliate Marketing with ChatGPT- A Step-by-Step Guide (1).pdfSimpleMoneyMaker
Discover the power of affiliate marketing with ChatGPT! This comprehensive guide takes you through the process of starting and scaling your affiliate marketing business using the latest AI technology. Learn how to leverage ChatGPT to generate content ideas, create engaging articles, and connect with your audience through personalized interactions. From building your strategy and optimizing conversions to analyzing performance and staying updated with industry trends, this eBook provides everything you need to know to succeed in affiliate marketing. Whether you're a beginner looking to start your online business or an experienced marketer wanting to take your efforts to the next level, this guide is your roadmap to success in the world of affiliate marketing.
E-Learning Vs Traditional Learning_ Benefits and Differences.pdfMega P
E-learning and traditional learning are two distinct approaches to education, each offering unique advantages and facing specific challenges. E-learning provides flexibility and convenience, allowing students to access materials and complete assignments at their own pace and schedule. Traditional learning fosters direct, face-to-face interaction between students and instructors, which can enhance communication, immediate feedback, and a sense of community.
AI Best Practices for Marketing HUG June 2024Amanda Farrell
During this presentation, the Nextiny marketing team reviews best practices when adopting generative AI into content creation. Join our HUG community to register for more events https://events.hubspot.com/sarasota/
INTRODUCTION TO SEARCH ENGINE OPTIMIZATION (SEO).pptxGiorgio Chiesa
This presentation is recommended for those who want to know more about SEO. It explains the main theoretical and practical aspects that influence the positioning of websites in search engines.
The Future of B2B Audience Targeting with LinkedInTajul Islam
Tired of pouring money into LinkedIn ads that don't convert?
A marketer’s guide to unlocking the full potential of LinkedIn’s extensive targeting resources and partner tools.
There's a better way. This guide unlocks the secrets to laser-targeting your ideal B2B audience on LinkedIn. Forget generic campaigns. We'll show you how to combine LinkedIn's advanced features with your existing customer data to reach high-value decision-makers directly. Imagine reaching the exact companies and people who can benefit most from your product or service.
Download our free eBook and discover a data-driven approach to LinkedIn marketing that delivers real results. Stop chasing the wrong audience – start targeting the right ones today
A brief analysis of SHEIN's digital transformation.
SHEIN’s business model:
1. D2C cross-border ecommerce: SHEIN integrate the manufactures from Guanzhou to make clothes and deliver direct to customers.
2. Digital marketing: Data driven online marketing for user acquisition.
3. Digital transforming vendor chain: the most core of the revolution to shorten the innovation and lead time.
4. Outstanding user experience: International delivery in high efficiency
Leverage four parts of the user satisfaction process and integrate related resource and information flow, which making SHEIN an international leading D2C ecommerce company.
• Keeping utilizing data in all process is another core capability. From the page click, sales metrics, fabric sourcing to manufacturing time, all data is integrated for decision making, leading an upward customer preference and much efficient business decision making process.
Masira Digital Marketing Agency, Bangalore offers the most advanced digital marketing services to help businesses grow. For more details, visit: https://masiradm.com/
2. CONTENT
THE NETHERLANDS – GENERAL STATS & FIGURES
OVERALL TRENDS & RANKINGS
MEDIA SPEND
TIME SPEND ANALYSIS
MEDIA TRENDS INCL. MULTI SCREEN
TELEVISION
RADIO
DIGITAL
PRINT
OUTDOOR
CINEMA
4. 16.193
16.780
15.500
16.000
16.500
17.000
2003 2004 2005 2006 2007 2008 2009 2010 2011 2012 2013
Population (in ‘000s)
Dutch population is growing and getting older, with the number of single person
households increasing
+ 3.21%
since 2003
2.384 2.802
4.612 4.767
2,28
2,19
1,0
1,3
1,6
1,9
2,2
2,5
0
2.000
4.000
6.000
8.000
2003 2004 2005 2006 2007 2008 2009 2010 2011 2012 2013
Averageno.ofpeopleinHH
NumberofHH(in‘000s)
Household size
Single person household Multiple person household Average no. of people in HH
Source: CBS, Statline , January 2014
38,6
40,8
37
38
39
40
41
2003 2004 2005 2006 2007 2008 2009 2010 2011 2012 2013
Average age
+ 4.62%
since 2003
5. Consumer confidence is climbing back up from an ultimate low
Source: CBS, Statline , Jan 2014 (NB: 2013 figures for disposable HH income haven’t been published yet)
Despite the
economic crisis,
disposable HH
income hasn’t
actually declined
but remained
stable
28,3 29,0 29,4 30,6
32,6 33,1 33,3 33,2 33,1 33,2
0
10
20
30
2003 2004 2005 2006 2007 2008 2009 2010 2011 2012
€(in‘000s)
Annual disposable HH income
-50
-40
-30
-20
-10
0
10
20
30
2007 Jan 2008 Jan 2009 Jan 2010 Jan 2011 Jan 2012 Jan 2013 Jan 2014 JanDifference%positiveandnegativeanswers
Consumer confidence
6. The effects of
the difficult
economic
climate are
still felt, but
first signs of
recovery are
evident
Key Economic
Indicators NL
2011 2012 2013 2014 2015
Inflation 2.3% 2.25% 1.75% 2% 2,25%
Economic growth 1.2% -0.75% 1.25% 1.5% 1.5%
Purchasing power* -1.0% -1.75% 0% -0.5% -0.5%
Unemployed (in ‘000s) 389 500 545 535 495
Unemployment % 5.4% 6.75% 7.25% 7.25% 6.5%
Source: CPB, Kerngegevenstabel 2011-2015, June 2014 (* Median all households)
8. SoLoMo is now
Social Local Mobile
Mobile technology makes it
possible to reach people
anywhere, anytime
Social media connects
people worldwide with
events, activities and each
other
Increasing ability for brands
and organizations to
respond to people’s
whereabouts and out-of-
home activities
9. Source: trendwatching.nl, 10 crucial consumer trends for 2013
10 crucial consumer trends of 2013
“Consumers are becoming more
involved in the financing and
development of new products
and brands”
“Emerging markets that serve
other emerging markets.
Worldwide”
“Multitasking shall be hyper-
tasking: 2013 becomes the year
of micro convenience, mini
digital experiences and digital
snacks”
“The time has come for
products that also give back”
“Apps are the new drug”
“Show off the new 'it' cultures” “Consumers wish 'useful' or
even profitable data”
“Local production is the new
service economy”
“Not only transparent, but also
open, exposed and proud ;-) “
“Brands will ask contribution of
their customers”
10. 6 mentality trends of the Dutch population in 2013
Source: Motivaction, Mentaliteitstrends 2013
Manifestation Fascination for violence Techno progression
Decrease societal
engagement
Simplicity Imagineering
“I like to be watched by other people” “I think violence on TV should be limited” “There should be boundaries to technological development”
“I feel very engaged with society” “I have chosen to live a more simple life” “Dreams and fantasies are crucial in my life”
11. 6 Obvious and 6 less obvious trends of 2013
More digital
More mobile
More social
More emerging markets.
More agile/speedy
More data-driven
The future is digital and analog
For example, mobile connects digital with the real world when
sharing content or checking-in
The future is about self-marketing
On social media, consumers have the ability to express themselves
more and more
Less advertising. More utilities & service
Brands more and more develop apps which facilitate life
The future of TV will come from the slime
Start-ups like Netflix and YouTube are changing TV behavior
Future is more access, less ownership
Services like Spotify replace the need of ownership (of cd’s)
Marketing is a huge growth category
Source: Rishad Tobaccowala, Chief Strategy and Innovation Officer, SMG HES Republic, October 2013
12. Local Dutch
brands have high
“share of mind”
amongst Dutch
consumers. The
news gained a
prominent
position in the
list.
Source: EURIB Top 100 Indispensable Brands of 2013 (EURIB Top 100 Onmisbare Merken van 2013), n=1,001
No. 3
No. 2
No. 1
14. Gross media spend
relatively stable, with a
slight increase in 2014
Q1 compared to same
period last year
0
1.000
2.000
3.000
4.000
5.000
6.000
7.000
8.000
9.000
2009 2010 2011 2012 2013 2013 Q1 2014 Q1
€millions
Gross media spend
Source: Nielsen, 2009 – 2014 Q1, data run off on 18th June 2014
(NB: Nielsen does not report all digital spend; for example, search, social media advertising and prerolls are excluded)
+4% YoY +2% YoY -3% YoY -1% YoY
+2%
15. Dip in net media spend
mirrors industry declineMedia spend vs. industry spend
Net Media Spend
Spend data as
reported by
buying
managers
Source: Nielsen Annual Net Media Spend Report 2012 (spend report 2013 not available yet)
Gross investment business sector
20%
10%
5%
15%
0%
-5%
-15%
-20%
-10%
16. FMCG, retail
and telecom
dominate the
top Dutch
advertisers
No. Advertiser Category Gross spend in € 2013
1 Unilever Nederland FMCG 216.970.985
2 Kruidvat Retail Retail 111.642.246
3 KPN Telecom 96.493.297
4 Lidl Nederland Retail 86.834.465
5 Albert Heijn Retail 86.323.214
6 Vodafone Telecom 76.826.118
7 Procter & Gamble Nederland FMCG 67.069.664
8 C1000 Retail 64.278.694
9 Reckitt Benckiser Nederland FMCG 58.893.014
10 St.Expl.Ned.Staatsloterij Lottery 58.842.764
Source: Nielsen, 2009 – 2013
(NB: Nielsen does not report all digital spend; for example, search, social media advertising and prerolls are excluded)
17. When looking
at individual
brand level,
retailer Kruidvat
comes out top
No. Brand Category Gross spend in € 2013
1 Kruidvat Retail 97.980.026
2 Lidl Retail 86.834.465
3 Albert Heijn Retail 86.284.214
4 KPN Telecom 81.146.155
5 C-1000 Retail 64.278.694
6 Kras Reizen Travel 56.155.267
7 Ziggo Telecom 52.102.563
8 Mcdonalds Fast Food 51.533.679
9 Nationale Postcode Loterij Lottery 46.982.702
10 Corendon Reizen Travel 46.936.551
Overall, retail stores dominate, with 4 retail brands amongst
the top 10. Telecom and travel are next with 2.
Source: Nielsen, 2013
(NB: Nielsen does not report all digital spend; for example, search, social media advertising and prerolls are excluded)
18. TV still claims
the largest
share of gross
media spend
14% 15% 15% 16% 16%
15% 12% 8% 6% 6%
5% 7% 5%
7%
7% 7% 7% 7%
5%
5% 5% 6% 6%
6%
6% 6% 5%
5%
7%
8% 8% 8% 9%
41% 44% 44% 43% 44%
2% 1% 1% 1% 1%
0%
10%
20%
30%
40%
50%
60%
70%
80%
90%
100%
2009 2010 2011 2012 2013
Media mix
Trade press
TV
Sponsored Magazines
Radio
Consumer Magazines
Out Of Home
Door Drops
Internet (Online Display)
Direct Mail
Newspapers
Cinema
Source: Nielsen, 2009 – 2013, data run off on 21st January 2014
(NB: Nielsen does not report all digital spend; for example, search, social media advertising and prerolls are excluded)
19. Afters years of
growth, TV spend
declined in 2012. In
2013, level slightly
increased again. DM
spend continued to
decrease YoY, whilst
Online Display
showed a strong
increase.
0
1.000
2.000
3.000
4.000
€millions
Gross media spend
per medium type across time
2009 2010 2011 2012 2013
Source: Nielsen, 2009 – 2013, data run off on 21st January 2014
(NB: Nielsen does not report all digital spend; for example, search, social media advertising and prerolls are excluded)
20. € 790
€ 954
€ 1.068 € 1.158
16%
19%
22%
25%
0%
10%
20%
30%
0
500
1.000
1.500
2009 2010 2011 2012
%oftotalnetadspend
€millions
Total internet net spend
Share of internet spend (of all net spend)
Internet spend is still steadily increasing YoY. Most of that increase can be
attributed to higher spend behind search.
€ 410 € 460 € 530 € 625
€ 205
€ 302
€ 336
€ 338
€ 175
€ 192
€ 202
€ 195
0
500
1.000
1.500
2009 2010 2011 2012
€millions
Internet net spend per type
Classifieds, Directories, Listings Display Search
Source: Nielsen Annual Net Media Spend Reports 2010, 2011 and 2012. “Classifieds, Directories, Listings” contains spend on
peer-to-peer/2nd hand online shopping sites (e.g. Marktplaats/Ebay) or Yellow Pages-type online directories (e.g. Telefoongids)
21. The first growth
in media spend
is not expected
by agencies
until 2014
3.935
3.967
3.884 3.882
3.919
3.965
3.800
3.900
4.000
2010 2011 2012 2013 2014 2015
€millions Forecast net spend
3,3%
0,8%
-2,1%
0,0%
1,0%
1,2%
-4%
-2%
0%
2%
4%
Forecast net spend
Change (%) to previous year
Source: ZOG Adspend Forecast Netherlands - December 2012 (2010-2011 based on agency estimates, 2012-2015 based on agency forecasts)
0
500
1.000
1.500
Newspapers Magazines TV Radio Cinema Outdoor Internet
€millions
Net spend per medium type
2010
2011
2012
2013
2014
2015
Growth in
spend due to
increasing
levels of
internet
spend
22. In 2013, total sponsor
spend decreased with 6%
(top 100 sponsors)
compared to 2012. This is
mainly caused by less
sponsor spend in sport
Source: SponsorMonitor 2014 (spend is an estimate based on input from advertisers. Only direct sponsor budget is included; any activation budget is excluded)
Total spend top 100 sponsors 2012 2013 Index
Total sponsor spend € 311,805,000 € 293,835,000 94
Average sponsor spend (per brand) € 3,118,050 € 2,938,350 94
-
100
200
300
400
500
600
Sports Art & Culture Entertainment Society Media (non-spot)
Sponsorspendinmio€
Sponsor spend 2010-2013
2010 2011 2012 2013
23. 61%
9%
13%
6,50%
10,50%
Sponsor contracts
Sports Art & Culture Entertainment
Society Media (non-spot) In 2013, 304 (new
and renewed)
contracts were
closed. In 2012,
this number was
slightly higher
(316)
Source: SponsorMonitor 2014 (spend is an estimate based on input from advertisers. Only direct sponsor budget is included; any activation budget is excluded.
The total value of all contracts in 2013 was
€ 205,442,500; average € 675,797 per
contract. This means that fewer contracts
summed up to an approximately equal
amount as 2012 when the total value was €
208,297,500 (average € 659,169).
24. No. Brand Gross sponsor spend in € 2013
1 Rabobank € 26,000,000
2 Nike € 15,000,000
3 AEGON € 12,700,000
4 adidas € 10,000,000
5 ABN AMRO € 8,450,000
6 KPN € 7,600,000
7 Philips € 7,050,000
8 VriendenLoterij € 6,600.000
9 Essent € 6,100,000
10 McGregor € 6,000,000
Rabobank, Nike
and AEGON
have been the
top sponsors for
several years
Source: SponsorMonitor 2014 (spend is an estimate based on input from advertisers. Only direct sponsor budget is included; any activation budget is excluded.
26. A new national Media Time Spend Study is launched. This is a
collaboration between:
• Sociaal en Cultureel Planbureau
• The 3 official media audience ratings: NOM, NLO and SKO
New research study Media:tijd is released in Q2 2014
On top of the Time Spend Study, Media:tijd will
launch another study in Q4 2014:
• A data hub to combine audience ratings in
order to analyze cross media reach
Media: Time is a unique and innovative research on media activities, media formats and
media content. This study is considered the new standard for media activities.
Source: Media:tijd 2014, TA: 13+ (N=2,989)
27. Dutch people
spend more
than 8 hours
per day on
media
8,53
0,59
10,21
0,36
1,33
0,3
3,15
0,14
0,43
2,22
8,11
0,49
11,21
0,31
1,31
0,33
0,35
0,1
0,12
4,19
0 2 4 6 8 10 12
Media
On the go
Sleeping, eating and personal care
Care for others
Housework
Groceries, shopping
Work
Volunteerting
Study, school
Leisure time
Hours per day
Main activities – Average time spent per day
Weekend Weekdays
Source: Media:tijd 2014, TA: 13+ (N=2,989)
28. Dutch people
spend more
than 8 hours
per day on
media
4,29
3,21
1,22
2,11
1,4
1,18
2,49
3,54 3,56
1,39 1,44
2,16
1,06
1,29
0
1
2
3
4
5
Listening
(online or
offline)
Watching
(online or
offline)
Reading
(paper or
electronic)
Communicate
(through
media)
Gaming
(electronic)
Internet other Media otherHoursperday
Media activities – Average time spent per day
Weekdays Weekend
Definitions
Listening: to radio, (own) music/audio – offline, online or apps + live or delayed
Watching: TV-programs, videos or pictures - offline, online or apps + live or delayed
Reading: books, magazines, newspapers, door drops, newsletters – offline, online or apps
Communicate: text messages, chat, e-mail, social media, forums, letters – offline, online or apps
Gaming: consoles or game websites - offline, online or apps – except for board games and gambling
Internet (other): online shopping, e-banking, search information - offline, online or apps
Media (other): administration on computer, installation and use software
Source: Media:tijd 2014, TA: 13+ (N=2,989)
29. Media consumption is high throughout the day but shows strongest peak in the
evening; listening in daytime, watching in the evening
0
10
20
30
40
Minutes
Media activities on an average day
Listening (online or offline) Watching (online or offline) Reading (paper or electronic) Communicate (through media)
Gaming (electronic) Internet other Media other
Source: Media:tijd 2014, TA: 13+ (N=2,989)
30. Internet is only medium where advertising budgets increase in line with time
spend
Source: Trends tijdsbesteding 2010 & 2012 SPOT, Zenith Optimedia, Deloitte analysis
0 -
Share of time spend vs. Share of advertising spend
50 -
40 -
30 -
20 -
10 -
0 10 20 30 40 50
2012
2010
Expected development
ShareofAdvertisingspend(%)
Share of Time spend (%)
Newspapers/ Magazines
As forecasts show, the
advertising revenue in
newspapers and
magazines have been
declining, whilst there is
limited change in time
spend. Given shifts in
consumer behavior this
trend is expected to
continue.
Internet
Time spend online continues to increase,
and is expected to increase even further.
Advertising budgets increase in line with
time spend.
TV
TV remains strong on time
spend, while taking share of
advertising from newspapers
and magazines.
Radio
Traditional radio has declined in its share
of total time spend, SoA had slightly
declined. Upside potential in SoA is limited,
however online radio services can increase
time spend in the future again.
32. Tablet and smartphone ownership still rising, whilst purchase intent for tablets
slightly decreased. Sim Only subscriptions are growing in popularity.
7%
30%
49%
30%
48%
23%
6%
40%
56%
29%
48%
26%
5%
48%
60%
27%
47%
29%
0%
20%
40%
60%
80%
Purchase intent
- Tablet
Ownership
- Tablet
Ownership
- Smartphone
Mobile phone/smartphone
Prepaid
Mobile phone/smartphone
Subscription (include phone)
Mobile phone/smartphone
Subscription (Sim Only)
Device ownership & purchase intent amongst NL13+
2012-I 2012-II 2012-II 2013-I 2013-I 2013-II
Source: NPDM 2012-I 2012-II; 2012-II 2013-I; 2013-I 2013-II
33. ‘Trends in Digitale Media’
shows the same pattern.
Tablet ownership
increased with 0.8 million
new users in 1st HY 2014.
6%
14%14% 14%
23%
14%
34%
14%
44%
11%
53%
9%
56%
7%
Own a Tablet/iPad Intention to purchase Tablet/iPad
Historical development: tablet ownership and purchase intent
June 2011
December 2011
June 2012
December 2012
June 2013
December 2013
June 2014
7.4 million
users
Source: Trends in Digital Media, GfK Intomart, June 2014; base: online population 13+ (N=1,008)
34. 93% of Dutch
households
have internet
access at home.
Internet access
‘on the go’
increase rapidly.
90%
44%
13%
26%
4%
20%
5%
92%
45%
12%
29%
5%
28%
4%
93%
45%
14%
34%
5%
37%
4%
0%
20%
40%
60%
80%
100%
Internet access by location
2011 2012 2013
Source: Media Standard Survey 2011/2012/2013 (n = 5,100); Base = Total NL 13+
35. Radio and internet
popular on the go via
smartphones. TV not jet
popular on the go.
93%
34% 37%
45%
5%
14% 4%
67%
64%
27%
3% 6%
98%
34%
9% 4% 3% 2% 4%
0%
20%
40%
60%
80%
100%
Place of access by medium type
Internet Radio TV
Source: Media Standard Survey 2013 (n = 5,100), Base = Total NL 13+, (* location isn’t asked for each medium type)
36. Watching TV still most popular via traditional TV set, but also occurs a lot via PC/Laptop (34%).
TV via tablet is rising (17%). Internet use via mobile (49%) and tablet (35%) is also very popular
66%
58%
49%
35%
6%
5%
23%
15%
9%
17%
95%
33%
33%
19%
16%
72%
12%
12%
6%
6%
20%
79%
10%
10%
13%
5%
0%
20%
40%
60%
80%
100%
Device use per medium type
Internet
TV
Newspaper
Magazines
Radio
Source: Media Standard Survey 2013 (n = 5,100), Base = Total NL 13+, (* device isn’t asked for each medium type)
37. Smartphone and tablet ownership increased where other devices showed decrease.
Overall, the couch is most favorite location of portable devices
Source: “Trends in Digital Media”, GfK Intomart, Jun 2014, base: online population 13+ (N=1,008) | * Game consoles measured since June 2014
76%
70%
65%
56%
26%
18%
0%
20%
40%
60%
80%
100%
Ownership devices
dec-12 jun-13 dec-13 jun-14
0%
20%
40%
60%
80%
100%
Location of usage
Laptop/netbook Smartphone Tablet E-reader
39. Most people use another screen when watching TV (63%). Mobile phone is getting more popular, where
the usage of laptops while watching TV is decreasing. Playing games, reading the news and chatting with
friends are most popular activities
0% 10% 20% 30% 40%
None Of The Above
Laptop PC
Mobile Phone
Tablet (e.g. iPad)
Desktop PC
E-Reader (e.g.
Kindle)
Multi Tasking while watching TV
Q1 2014 Q4 2013 Q3 2013 Q2 2013
0%
10%
20%
30%
Multi Tasking activities
Q2 2013 Q3 2013 Q4 2013 Q1 2014
Source: GlobalWebIndex, 2013.Q2 - 2014.Q1, Base Internet Users NL16+ (N= 3013)
40. Based on time spend social media, chatting and games are most popular while
watching TV.
0
5
10
15
20
25
30
0
1
2
3
4
Minutesperday
Minutesperday
Multi Tasking Live TV - Time spend
Sociale media, forums
SMS-en, chatten
Online games spelen
Live Radio
Dagblad, krant lezen
E-mailen
Overig gebruik websites, apps
Tijdschrift lezen
Source: Media:tijd 2014, TA: 13+ (N=2,989)
Live TVMultiTask activity
41. Multitasker while watching TV: 16-34 year olds, mostly middle income and
interested in sport, fashion, science and traveling.
51% 49%
20% 22% 23% 20%
15%
0
50
100
150
0%
25%
50%
Source: GlobalWebIndex, 2014.Q1, Base Internet Users NL16+ (N= 751), TA: MultiTasker While watching TV (N=476)
27%
47%
26%
Low (Bottom 25% income) (index 103)
Mid (Mid 50% income) (index 97)
High (Top 25% income) (index 103)
0
50
100
150
0%
20%
40%
60%
% Agree Index
Gender Income
InterestAge
42. SPOT and Remotely.tv introduced Social TV Ratings: a
monthly report of the number of TV related tweets.
May top 10:
Social TV buzz is booming, Starcom uses own tool Echo Listening to analyze social
media buzz. SPOT introduced Social TV Ratings to count tweets around TV content.
Source: http://www.spot.nl/publicaties/social-tv-ratings, data collected 2nd July 2014 Source: Echo Listening, Starcom NL
From Echo Listening analyses we’ve
learned that people like to talk about a
(special) TV campaign. People also like
to talk about a TV campaign via social
media. However social media use while
watching TV is still relatively low and
most of the conversations are not
program related.
Positie Datum Tijd Titel Zender Tweets
1 10-05-2014 21:00 Eurovisie Songfestival NED 1 252.399
2 06-05-2014 21:00 Eurovisie Songfestival halve finale NED 1 101.892
3 24-05-2014 20:00 CL Live, Real Madrid - Atlético Madrid NED 3 19.177
4 17-05-2014 19:50 Oefeninterland NED - Ecuador SBS 6 11.741
5 12-05-2014 22:30 RTL Late Night RTL 4 11.095
6 31-05-2014 19:50 Oefeninterland NED - Ghana SBS 6 7.540
7 14-05-2014 20:30 EL Finale Sevilla - Benfica RTL 7 7.231
8 09-05-2014 21:25 EZ NED 2 2.791
9 04-05-2014 19:50 Dodenherdenking Simulcast 2.681
10 12-05-2014 20:30 Project P: Stop Het Pesten RTL 5 2.443
43. NOT ON TV
REPLACING LIVE VIEWING
RE-WIRING VIEWING NORMS
HOW THEY KEEP UP IN A CONTENT WORLD OF “MORE”
NOT JUST TV: MOVIE SERIES
ABOUT AVOIDING ADS
Trend: Binge Viewing – the back to back to back viewing of a content series in one single
sitting, or over a consecutive period of time – including TV shows, seasons or movie series
Source: SMG Youth HEC, October 2013
45. SKO
audience measurement
in the Netherlands
‘Stichting KijkOnderzoek’ (SKO) is the primary provider of the official
television audience ratings in the Netherlands.
SKO is a non-profit organization, organized as a Joint Industry Committee
(JIC).
The television audience measurement provides information on how many
people watched a program, when they watched and what their
characteristics are. Viewing data is collected second-by-second by means
of a metering system.
Ratings are reported minute-by-minute for channels received in the
Netherlands independent of the way their signal is distributed.
Source: www.kijkonderzoek.nl, 2nd of July 2014
46. CENSUS DATA
By using VAST
technology for online
video (IAB standard)
Introduction by SKO:
1 July’14 – 1 January ‘15
PANNEL DATA
Who is watching?
What is % reach?
Start 2015
DATA FUSION
Mid 2015
ONLINE VIDEO TOTAAL
Early 2016
TV TOTAL (Linear & non-linear; via TV screen)
Existing
AVTotal(Early2016)
SKO ultimate aim:
measure all online
video content (include
online vendors as
Youtube)
The core of the audience measurement is the common
currency (total viewing). The measurement includes guest
viewing in the panel households and time shifted viewing
(on the day of broadcast and the six days that follow).
SKO also investigates new ways of viewing via so-called
‘satellites’ studies that are conducted alongside the
currency measurement. This approach allows SKO to
measure new forms of viewing behaviour (i.e. online video)
without influencing the core currency data.
Source: www.kijkonderzoek.nl, 2nd of July 2014
47. STER (Dutch Government)
RTL
SBS Broadcasting
54 regional channels
Dutch TV channels, with advertising possibilities (I/II)
Source: retriever.nl, July 2014 | http://nos.nl/video/483901-publieke-omroep-wordt-npo.html, 12th March 2013
Note: RTL 7 and RTL Z share a channel; RTL Lounge and RTL Crime are paid (digital) channels
Note: Ned 3 and Zapp share a channel
Radio and TV channels of
Dutch Public Broadcasting
will be rebranded as NPO.
48. The Walt Disney Company
Benelux
Triade Media
BE VIACOM
Discovery Networks Benelux
FOX International Channels
Benelux
Dutch TV channels, with advertising possibilities (II/II)
Source: retriever.nl, July 2014 | http://www.adformatie.nl/nieuws/bericht/ad-sales-samenwerking-fox-international-channels-en-branddeli, 12th November 2013
Note: share a channel with Veronica
Note: mostly paid (digital) channels
Note: all Nick channels share one channel.
49. With no big sport events in 2013, the market share of STER decreased. In 1HY of 2014 the
effect of the soccer World Cup is already visible. Market share RTL and SBS remain stable
through time, as where BrandDeli shows an increase in market share through time
Source: SKO 2012 Jan 2012.Q1 – 2014.Q2, 02.00-26.00 based on all adults 13 +
35%
24%
14%
10%
2%0%
10%
20%
30%
40%
STER RTL SBS BrandDeli Triade
Market share
12q1-12q2 12q3-12q4 13q1-13q2 13q3-13q4 14q1-14q2
50. Thanks to Ned 1 the market share of the public broadcaster (STER) has increased in the
first half year of 2014. Ned 3 shows a big decrease compared to q3/q4 2013.
Source: SKO 2012 Jan 2012 – 17th November 2013, 02.00-26.00 based on all adults 13 +
0%
10%
20%
30%
Market share
13q1-13q2 13q3-13q4 14q1-14q2
STER RTL SBS BrandDeli Triade
51. Clutter of broad family/women’s channels. Kids and male channels have a more
distinct profile.
Male
Young
Old
Female
Source: SKO, 2013, all adults 13+
52. 98%
Households
with TV
1.7
Average # of
TVs per
household
37%
Hard disc-recorder
ownership 2013
76%
82%
Digital TV reception
2012 vs. 2013
Source: SKO TV in the Netherlands 2013 | Media Standaard Survey 2013
TV trends and developments – I
53. Average viewing time per day (6+) in 2013: 195
minutes (196 in 2012). Viewing time appears to
stabilize at the same level as 2005 (nearly 200
minutes per day).
Watching linear TV is still the norm, but Catch-up
TV gains ground with an average viewing time
from 6 minutes in 2012 to 9 minutes per day in
2013 (4,5% of total viewing time).
17% of Dutch households have TV with internet
access
Source: SPOT TV Annual Report 2012 + 2013 | Media Standaard Survey 2013
TV trends and developments – II
Average viewing time in minutes per day
54. TV trends and developments – III
Source: SPOT Annual Report 2012 (based on all adults) | Moving Pictures 2013
98%
2% 1% 1%
98%
1% 1% 0%
98%
0% 1% 1% 0%
0%
25%
50%
75%
100%
TV Desktop Laptop Tablet Smartphone
Watching live TV (minutes) – per device
2011 2012 2013
Although the three main cable
operators offer more opportunities
to watch live TV (Laptop, Tablet,
Smartphone), we haven’t yet seen a
big shift in devices that are used.
56. Definitions
Two options for non-linear TV viewing:
On TV screen (set-top box with hard disk or hard disk-, video- or DVD recorder)
Non-linear TV viewing within 6 days of programming is added to the regular TV viewing ratings.
Online (Laptop/Tablet)
Per January 2015 SKO is planning to deliver the first online video commercial data (census data).
Census data will be available for both traditional as non-traditional broadcasters. The next step in
2015 is to add panel data to the census data.
40% of non-linear
TV viewing is on
the same day;
28% is watched
the day after the
original broadcast
Source: SPOT TV Annual Report 2013
4.5% of total
viewing time
is non-linear
via TV screen.
VIDEO ON DEMAND
TV screen, Laptop, Tablet
and/or Smartphone. Non-linear TV-viewing
(broadcast by traditional broadcasters, i.e. RTL, SBS and Ster)
Broadcast via non-traditional broadcasters
(i.e. Netflix, Youtube, etc)
57. The Dutch online video landscape
Source: comScore Video Metrix, Netherlands, August 2013, Age 6+
58. 0
5
10
15
20
25
NL 13+ Men Women 13-19 year 20-34 year 35-49 year 50-64 year 65+ year
Minutesperday
Non-Linear TV Other professional content User generated/youtube
Average minutes per day on non-linear viewing
Content
Little difference
between men and
woman in content
consumption.
Professional content
most popular, only
the younger target
group spend equal
time on professional
content as user
generated content
Source: Media:tijd 2014, TA: 13+ (N=2,989)
59. Main players
‘traditional’ non-linear
viewing
Harddisk recorder
‘RTL XL’ & ‘SBS Gemist’ (Laptop, Smartphone, Tablet,
Smart TV). A selection of TV content from the RTL/SBS
channels. Also includes previews of shows and a selection
of movies and series (mostly paid content). RTL is
experimenting with subscription instead of pay-per-view.
‘Uitzending Gemist’ (NPO)
TV content from all the public TV channels.
NLziet (NPO, RTL, SBS)
NLziet is a subscription for the three online platforms NPO
Plus, RTLXL and Kijk. Subscribers can watch all content of
Dutch TV up until 365 days after broadcasting.
Source: http://www.adformatie.nl/nieuws/bericht/npo-rtl-en-sbs-samen-in-video-on-demand, 15th November 2013 | Update July 2014
60. Main players
non-traditional
Pathe Thuis (Pathe at Home). Cinema media owner Pathe developed a platform to
watch movies at home (pay-per-movie). Available via Laptop, Tablet and Smart
TV.
Since September 2013 Netflix is active in the Dutch market. For €8.- per month
users have unlimited access to movies and series. Netflix announced to raise the
subscription price to €9,- for new users. When the new price will be introduced
yet to be announced. Available via Laptop, Tablet, Smartphone and Smart TV.
YouTube mostly has user-generated content. The first paid channels have already
been introduced. Not yet in the Netherlands, but is likely that in the near future
paid channels will also be launched in the Netherlands. RTL Nederland has
announced to launch a Multi-Channel Network (MCN) at the end of 2014.
Available via Laptop, Tablet, Smartphone and Smart TV.
Videoland was once the biggest offline movie rental company in the Netherlands.
They now offer a lot of on-demand movies (pay-per-movie). Available via Laptop.
In August 2013 RTL took over Videoland.
61. The increased reach in April is
caused by the addition of
mobile data to DDMM.
Although RTL increased strongly
due to added reach mobile,
YouTube remains main channel
for video on demand
Source: DDMM (TA 13+ N=1800)
0%
10%
20%
30%
40%
50%
60%
70%
sep-13 okt-13 nov-13 dec-13 jan-14 feb-14 mrt-14 apr-14
Monthly Reach Video on Demand
RTL XL KIJK SBS6 / NET5 / Veronica Uitzending gemist (NPO)
Pathe (thuis & App) YouTube
63. Radio audience
measurement
National Luister Onderzoek (National Listening Research)
Based on 7,500 respondents
Since July 2012: use of Media Standard Survey for weighting
Test with media watch (using audio-matching technique)
Aim is to calculate radio reach per minute instead of per 15-minute interval
64. STER
One Media Sales
Sky Radio Group
Q-Music NL
FD Media Factory
Dutch radio stations, with advertising possibilities (I/II)
Source: retriever.nl, July 2014
65. Flux Media Factory
Groot Nieuws Radio
94 regional stations
18 online stations
Dutch radio stations, with advertising possibilities (II/II)
Note: ORN (government) and E Power (commercial) take care of the sales of approximately 30 stations
Note: Sales via E Power, but with national coverage
Source: retriever.nl, July 2014
66. Based on the first five months 3FM is market leader. The sales house of local radio stations
(ORN) is losing market share. Radio 10 shows increasing figures
Source: NLO, based on audience of 13+ (*Sales house for regional stations form the government; **Sales house for commercial regional stations), Note: % is July-Dec ‘13 vs Jan-May ‘14
0%
5%
10%
15%
Market share (%)
Jan-June 2013 July-Dec 2013 Jan-May 2014
-9%
+ 13%
-6%
67. For the older audience there is some clutter, mostly in public broadcasting stations.
A young and more female station is missing in the radio landscape
Male Female
Source: NLO, 2013, based on 13+
Old
Young
68. All commercial national radio stations are completely digital since 1st September
2013. Next to FM, these stations will also be aired on DAB+ (Digital Audio
Broadcasting)
In 2014, public broadcasting stations will also switch to DAB+ (already on DAB).
DAB+ offers better, noise-free quality and extra possibilities like a pause-button.
This opportunity makes radio more on-demand than before.
All national stations on DAB+; awareness level is still very low
Source: RAB Radioplatforms 2013, GfK Intomart, May 2013, base: internet population 13+ (N=5,001)
5%
17%
78%
0%
25%
50%
75%
100%
Awareness
DAB+
No idea
Only by name
I know exactly
what it is
69. Listening to radio via PC
and laptop is declining,
whilst listening via
smartphone or tablet is
on the increase.
Source: Trends in Digital Media, GfK Intomart, December 2012, base: online population 13+ (N=854)
PC (Desktop)
Laptop/netbook
Smartphone
Tablet
32%
27%
14%
4%
30% 29%
25% 24%
15% 16%
6% 8%
TV set-top box 23%
Dec 2011 Dec 2012June 2012
TV set-top boxes are a popular
way of listening to the radio
70. Desktop and laptop getting
less popular for radio usage.
Mobile phone and tablets
show an increasing trend as
device for digital radio
0%
5%
10%
15%
20%
25%
30%
35%
Dec '11 June '12 Dec '12 June '13 Dec '13 June '13
Digital radio listening*
Desktop Laptop Smartphone Tablet SettopBox
Source: Trends in Digital Media 2014, GfK Intomart, Juni 2014, base: online population 13+ (N=1,008) * Listen sometimes
71. Most time spend on radio listening via SettopBox, followed by Desktop. Radio station
apps getting popular, although Spotify is way ahead
Source: Trends in Digital Media, GfK Intomart, June 2014, base: online population 13+ who own a tablet and/or smartphone
36
71
20
22
30
63
0
50
100
150
200
250
Average minutes per week
Streaming-/network player
SettopBox
Tablet
Smartphone
Laptop
Desktop
0% 5% 10% 15% 20%
Spotify
3FM
Radio 538
Q-music
Radio 2
Sky Radio
Nederland.fm
Radio 1
Tune in FM
100% NL
Classic Radio Apps (downloaded)
Tablet (n=575)
Smartphone (n=681)
72. Streaming music
Application-based (laptop &
smartphone) music
streaming service.
5.5 million free users
1.5 million monthly active
free users
Source: Spotify
Web-based music streaming
service. Also available on
smartphone (partner with
telecom provider T-Mobile)
Spot advertising within
playlist possible.
Personalised radio station,
introduced in 2012 by Sky
Radio Group.
Club Judge (online Party/Event
platform) offers non-stop DJ-
set via My Radio
74. STIR has stopped as the
official audience
measurement currency
in the Netherlands
STIR was the primary provider of the official audience ratings for online in
the Netherlands. As of June 2013, the Joint Industry Committee (JIC) has
stopped measuring reach figures of websites.
Dutch Digital Media Measurement (DDMM) is the new provider of the
official audience ratings for online. On 12th November, the new data for
digital media is presented.
DDMM is an initiative of VINEX (online vendors) and PMA (media agencies)
using the panel and methodology of GfK.
Source: www.stir.nl, 25th September 2013 | http://www.vinex.nl/nieuws/eerste-meetresultaten-digitaal-bereiksonderzoek-ddmm/, 12th November 2013
75. DDMM reach data is
not comparable with
previous figures due to
differences in
technology
The methodology of DDMM is different than the digital measurement of
STIR (which means reach data can not be compared).
The main differences are:
- DDMM data is weekly available in stead of monthly
- Online reach is measured from 6 years old in stead of 13 years old
- Online usage is limited to private use, not at work
In June, mobile (tablet and smartphone) data will be integrated to the
panel. Also, many extra demographics are available to analyze the online
behavior of more detailed target audience.
Source: http://www.vinex.nl/nieuws/eerste-meetresultaten-digitaal-bereiksonderzoek-ddmm/, 12th November 2013
76. The Standard Ad Units
Source: IAB: http://www.iab.nl/onze-kennis/standaarden-en-richtlijnen/display-advertising/iab-rising-star-ad-units/, data collected on 10th December 2013
At this moment, 80% of the
display advertisements follow
the IAB standards.
To stimulate the industry and
create new possibilities for
dynamic brand advertising, IAB
US launched a new portfolio of
Standard Ad Units in February
2012. This portfolio includes
new interactive ad units which
are designed and tested by
premium vendors and agencies
of the digital world.
77. The Netherlands has the 3rd highest internet penetration worldwide. Only
Iceland and Norway have higher penetration levels.
95% 94% 92% 91% 90% 89%
86%
80%
77% 77% 77% 75% 74% 73% 73% 72% 70% 68%
65% 65%
62% 61% 59%
55% 54% 53%
50% 49%
45% 42%
39% 38%
36%
24%
21%
18%
9% 7%
Iceland
Norway
Netherlands
Sweden
Denmark
Finland
NewZealand
Austria
SouthKorea
Ireland
Canada
Japan
UnitedStates
CzechRepublic
UnitedKingdom
Slovenia
Australia
Germany
Lithuania
Poland
Spain
France
Hungary
Portugal
Chile
Greece
Argentina
Italy
Russia
Turkey
Brazil
China
Mexico
Thailand
SouthAfrica
Indonesia
Pakistan
India
Internet penetration in 2012
Source: eMarketer Global Digital Atlas 2012; penetration based on total population
78. 21%
11% 12%
32%
25%
13% 13%
36%
27%
14% 14%
36%
33%
14%
15%
37%
40%
14%
17%
38%
42%
14%
18%
38%
Social Networks Buying/selling Streaming video Searching for info
2010 II - 2011 I 2011 I - 2011 II 2011 II - 2012 I 2012 I - 2012 II 2012 II - 2013 I 2013 I - 2013 II
Over the last two years all online activities have shown an increase in usage.
Social networking became very popular: frequent usage doubled in 2.5 years
Source: NPDM releases: 2010 II – 2011 I to 2013 I – 2013 II, base: total NL 13+
Online activities done ‘often’ – across time
79. 28
28
29
29
29
30
36
42
42
42
0 10 20 30 40 50
Brazil
Taiwan
Turkey
Thailand
France
Poland
Netherlands
UK
Canada
United States
Average hours per visitor (per month)
Countries with highest time
spent online by women
Online population is slightly more male, but on a global level Dutch women spent more time
online than in most other countries. Internet penetration only stays behind amongst 65+ and
lower educated (though showing strong growth).
Internet penetration NL 2011 2012 2013 Index (13/11)
Male 90.1% 91.1% 92.2% 102
Female 84.4% 86.7% 88.1% 104
13-17 years old 100.0% 99.6% 98.9% 99
18-24 years old 99.4% 97.6% 99.5% 100
25-34 years old 98.2% 98.0% 98.8% 101
35-49 years old 95.3% 97.8% 98.1% 103
50-64 years old 86.9% 90.0% 92.1% 106
65+ 55.0% 57.9% 61.2% 111
Low education 62.7% 66.3% 70.5% 112
Medium education 90.6% 92.5% 93.3% 103
High education 96.7% 97.4% 97.7% 101
Source: Media Standard Survey 2013 (N= 5,100)
Source: comScore data gem, based on comScore MMX, Jan 2013,
worldwide, females aged 15+
80. Devices used to go online and frequency of online usage at home and at work
0%
25%
50%
75%
100%
Honderden
Online access in %
2012 I- 2012 II 2012 II - 2013 I 2013 I - 2013 II 71%
9% 6% 2% 0% 0% 0% 3% 1% 7%
(Almost)
daily
4-5 days
a wk
2-3 days
a wk
Once a
wk
Once
every 2
wks
Once a
month
< once a
month
Never Don't
know
No
access at
home
Online access - At home
9% 19% 10% 4% 1% 1% 1% 2% 1%
52%
(Almost)
daily
4-5 days
a wk
2-3 days
a wk
Once a
wk
Once
every 2
wks
Once a
month
< once a
month
Never Don't
know
No
access at
work
Online access - At work
Source: NPDM releases: 2012 I – 2012 II to 2013 I – 2013 II, base: total NL 13+ Source: NPDM 2013 I – 2013 II, base: total NL 13+
81. 35%
39%
21%
3%
27%
40%
24%
7%
29%
34%
27%
9%
21%
32%
27%
20%
15%
29%
30%
26%
12%
28%
30% 29%
13%
24%
33%
30%
1 device 2 devices 3 devices 4+ devices
Number of owned devices
June 2011 Dec 2011 June 2012 Dec 2012 June 2013 Dec 2013 June 2014
In two years time, having more than four devices is more common than owning
one. On average, consumers own 2.9 devices.
Source: “Trends in Digital Media”, GfK Intomart, Jun 2014, base: online population 13+ (N=1,008)
Consumers own 2.9
of these devices on
average:
- PC (desktop)
- Laptop/netbook
- Smartphone
- Tablet
- e-reader*
* e-reader is
measured since
December 2012
82. Google and Facebook are leading in terms of reach for both websites as online
video
# Top 10 Websites Reach (%) Reach (‘000) # Visits (‘000) Frequency
1 Google.nl 73.2 11,272 380,748 33.8
2 Facebook.com 55.8 8,593 312,039 36.3
3 Youtube.com 44.7 6,886 69,816 10.1
4 Google.com 44.3 6,825 97,430 14.3
5 Live.com 34.1 5,254 95,344 18.1
6 Marktplaats.nl 31.8 4,892 49,983 10.2
7 Bol.com 26.3 4,048 14,358 3.5
8 Wikipedia.org 26.1 4,029 14,256 3.5
9 Ing.nl 25.2 3,888 34,662 8.9
10 Rabobank.nl 24.3 3,737 17,918 4.8
Source: DDMM, April 2014, PC only, TA: 6+
2
2
2
2
3
3
3
3
5
10
0 4 8 12
Sanoma Group
Warner Music
Telegraaf Media Group
Maker Studios Inc.
RTL Group Sites
Publieke Omroep
VEVO
Vimeo
Facebook
Google Sites
Unique Viewers (000)
Top 10 Online Video Properties
Source: comScore data gem, based on comScore VMX, Jan 2014,
83. Automated trading becomes dominant in impressions served in H1 2013 for
Display. Revenue generated by automated trading continues to grow.
Source: IAB report on Online Ad Spend, the Netherlands H1 2013
Automated Manual
2012
Revenue
H1 2013
Revenue
2012
Impressions
H1 2013
Impressions
Display advertising share of
revenue served per mechanism
Display advertising share of
impressions served per mechanism
71%
29%
43%
57%
54% 46%
39%
61%
84. Online display
advertising
market still
plagued by
high % of
waste*
Percentage website (in-screen vs. not in-screen)
Source: MeMo2, based on MeMo2 benchmark (based on 500 million impressions)
“The first media owner in the Netherlands that is only going to charge if the
banner really is visible: WebAds.”
Source: http://www.adformatie.nl/nieuws/bericht/webads-alleen-vertoonde-banners-afrekenen/
*Waste being defined as served online impressions that were served in an inactive screen (e.g. when multiple browsers or browser tabs are open simultaneously) or above/below the
fold (i.e. when scrolling up/down and banners are served outside the screen that’s in-view)
0%
20%
40%
60%
80%
100%
Website 1 Website 2 Website 3 Website 4 Website 5 Website 6 Website 7 All
% in-screen
% not in-screen
85. Update cookie legislation. After Hasty introduction of EU legislation in june
2012, the Dutch government is probably going to ease the legislation.
No more cookie walls a more subtle approach
seems sufficient. An information bar that tells
the visitors that cookies are placed.
No longer user permission needed for non-privacy breaking
cookies (like analytics cookies).
Website has to inform visitors about all other cookies that
are placed.
A subtle notification is enough. When an user accept the
cookies the notification bar will disappear.
91%
9% Cookie law expectations
No impact
Increasing advertising revenue
Source: IAB report on Online Ad Spend, the Netherlands H1 2013 | Update July 2014: http://www.rijksoverheid.nl/nieuws/2014/03/28/cookiewetgeving-versoepeld.html
87. Facebook seems to have plateaued at very high level. YouTube is (stable)
second network in terms of claimed usage
Source: Newcom, Dutch National Social Media Survey 2014, TA: 15+
Do you use the Social Media listed below?
80%
60%
40%
20%
0%
2011 2012 20132011 2014
53% 47%
Almost 9 out of
10 people use
Social Media
88. Facebook and YouTube are most used platforms in the year 2014
Source: Newcom, Dutch National Social Media Survey 2014, TA: 15+
Social
media in the
Netherlands
in 2012
The absolute numbers are a projection of the results based on the following data:
Number of Dutch people Target population Dutch people15+
16.779.575 0,83
Internet penetration Population
0,94 13.067.554
Main platforms:
Upcoming platforms:
89. 6% 3% 4% 2% 4% 2% 1%
9%
9%
17%
4% 6% 6% 15%
23% 28%
33%
27%
31%
24%
40%
29% 29%
28%
33%
32%
30%
27%
23% 22%
14%
27%
21%
26%
14%
9% 9% 4% 8% 6%
11%
3%
Facebook Twitter Instagram Linkedin Pinterest Google+ Tumblr
Age distribution of social networking sites in NL
65+
50-64
35-49
20-34
13-19
6-12
Instagram and Tumblr are youngest networks
Source: DDMM, April 2014, 6+ (*online website visit, no mobile and tablet)
* Low base
Age Age
distribution
Penetration Average number
of platforms used
15-19 8% 99% 4
20-39 35% 97% 3
40-64 42% 84% 2
65-79 11% 68% 1
80+ 3% 63% 1
Social Media listed usage
Source: Newcom, Dutch National Social Media Survey 2014, TA: 15+
90. Social Media users in the Netherlands: All layers of society use Social Media,
but privacy concerns are still an issue
Hesitants
4.6 million
Convinced
3.5 million
Dedicated
2 million
Sceptic
3 million
Source: Newcom, Dutch National Social Media Survey 2014, TA: 15+
Limited use of Social Media
Neutral attitude towards Social Media
Hesitant about future role
Limited or no use of Social Media
Social Media is a distant concept
No confidence whatsoever
Active on several platforms
Relatively confident
A part of life
More than average use of Social Media
Confident in increasing role Social Media
Open to new developments
91. Within the social media landscape alternative platforms are emerging, focusing
on people’s tastes and interests
Smarts Tastes/InterestsEgo
Source: SMG proprietary qualitative research, Youth Human Experience Centre – Curated Market Places, January 2013
93. Smartphone penetration is further increasing to 70%
39%
45%
48%
58%
65% 67%
70%
0%
20%
40%
60%
80%
Historical development of smartphone penetration in NL
Source: “Trends in Digital Media”, GfK Intomart, Jun 2014, base: online population 13+ (N=1,008)
9
million
Smartphone users
94. 50+ become more mobile through time. Across all groups – except for 13-17 -
an increased tablet penetration is evident
0%
25%
50%
75%
100%
Men
Women
Age 13-34
Age 35-49
Age 50-64
Age 65+
% uses a smartphone jun-11
dec-11
jun-12
dec-12
jun-13
dec-13
jun-14
0%
25%
50%
75%
100%
Men
Women
Age 13-17
Age 18-34Age 35-49
Age 50-64
Age 65+
% uses a tablet
Source: “Trends in Digital Media”, GfK Intomart, Jun 2014, base: online population 13+ (N=1,008)
95. 0
1
2
3
4
5
Averagetimespendinminutes
Smartphone and tablet usage during the day
Tablet and mobile usage show biggest gap during daytime; mobile is used on
the way and at work; tablet mainly at home
Source: Media:tijd 2014, TA: 13+ (N=2,989)
96. Smartphones are used while multi-tasking with other media
Source: “Our Mobile Planet”, Google/Ipsos, May 2013, N=1000
Listening to music
Watching TV
Use internet
Reading mags/newsPlaying games
Watching movies
Reading books
Use their smartphone
during…
97. Main activities are call, text messages, chat, internet, e-mail, camera and social
media
79%
77%
28%
8%
19%
39%
49%
54%
8%
73%4%
43%
71%
17%
84%
77%
30%
74%
Mobile activities
Internet E-mail
Video TV
Radio Navigation
Games Downloading apps
As e-ticket Camera
Books Online banking
Social media Online shopping
Call Text messages
Music Chat
Source: “Trends in Digital Media”, GfK Intomart, Jun 2014, base: online population 13+ (N=1,008)
98. Main activities are internet, e-mail, games and social media
90%
74%
35%
32%
16%
11%
66%53%
4%
42%
20%
41%
67%
38% 6%
3%
17%
8%
Tablet activities
Internet E-mail
Video TV
Radio Navigation
Games Downloading apps
As e-ticket Camera
Books Online banking
Social media Online shopping
Call Text messages
Music Chat
Source: “Trends in Digital Media”, GfK Intomart, Jun 2014, base: online population 13+ (N=1,008)
99. The Standard Ad Units – Mobile and tablet Display
Source: IAB website: http://www.iab.nl/2014/06/12/iab-taskforce-mobile-past-mobile-advertising-standaarden-aan-2/, data collected on 30th June 2014
The usage of mobile internet and
smartphone apps increased significantly in
the past few years. This has led to the fact
that mobile advertising became a
substantial component of the online
advertising market.
As a result of the expanded market, IAB
defined guidelines for standardization.
Display banner Smartphone
Smartphone standard:
Single: 640 x 100
Double size: 640 x 200
Half page: 640 x 500 / 640 x 480
Full page: 640 x 960
Tablet standard:
Medium rectangle: 600x 500
Floor ad: 728 x 60
Full page (portrait): 1536 x 2048
Full page (landscape): 2048 x 1536
Leaderboard: 728 x 90
100. Mobile and In-app is showing high growth this year.
Website/browser
Display advertising revenue per medium Breakdown Mobile website and In-app
H1 2013
Mobile website
& In-app
E-mail
4,6%
6,6%
88,8%
2011 2012 H1 2013
In-app
Mobile website
1,4%
1,2% 1,6%
1,6%
2,7%
3,9%
Source: IAB report on Online Ad Spend, the Netherlands H1 2013
101. Top 10 online activities done last month on PC/laptop, tablet and mobile
43%
44%
44%
49%
53%
58%
60%
61%
62%
77%
Checked info on music/leisure
Uploaded photos
Checked weather
Managed social network profile
Search for product/service to buy
Purchased a product
Used Webmail
Reviewed product/ brand
Watched video clip
Internet banking
% of PC/laptop users
PC/laptop
36%
37%
37%
40%
40%
40%
43%
47%
48%
52%
Checked info on music/leisure
Purchased a product
Used social networking service
Checked weather
Played online game
Search for product/service to buy
Reviewed product or brand
Watched video clip
Used internet banking
Used Webmail
% of tablet users
Tablet
36%
37%
38%
38%
44%
45%
47%
52%
60%
63%
Checked info on music/leisure
Reviewed product/brand
Search for product/service to buy
Checked weather
Used social networking service
Uploaded photos
Managed social network profile
Watched video clip
Used internet banking
Used Webmail
% of mobile users
Mobile
Source: Global Web Index, Wave 12 (Q4 2013), Base: internet users 16+
102. Apps are main platforms for mobile usage, especially for smartphones
Source: DDMM, average monthly reach Q1 2014, TA:13+
15%
17%
18%
18%
19%
19%
28%
32%
Youtube (app)
Gmail (app)
Facebook.com
Google Search (app)
Google Maps (app)
Google.nl
Facebook (app)
Whatsapp (app)
Overall top smartphone titles
Phone reach %
11%
11%
12%
12%
14%
17%
20%
22%
Nu.nl
Youtube.com
Candy Crush Saga (app)
Google Search (app)
Youtube (app)
Facebook.com
Google.nl
Facebook (app)
Overall top tablet titles
Tablet reach %
103. Research that starts on smartphones often leads to purchases across channels
Source: “Our Mobile Planet”, Google/Ipsos, May 2013, N=1000
18%
of smartphone users
have purchased a
product or service on
their smartphone
57%
of these smartphone
shoppers have made
a purchase in the
past month
26%
17%
104. Mobile is often used after seeing an ad in another medium (especially TV and
shops). Mobile advertising is mainly notices in an app or on a website
9%
15%
22%
23%
35%
48%
While on a video website
While on a retailer website
While watching a video
While using a search engine
While on a website
While in an app
Where mobile ads are noticed
Source: “Our Mobile Planet”, Google/Ipsos, May 2013, Base: Private smartphone users who use the internet and who at least rarely notice advertising (N=821)
Mobile search
have performed a
mobile search after
seeing an ad
107. NOM
audience
measurement in the
Netherlands
‘Nationaal Onderzoek Multimedia’ (NOM) is the primary provider of the
official print audience ratings in the Netherlands.
NOM is a non-profit organization, organized as a Joint Industry Committee
(JIC).
The print audience measurement (NPM) provides information on reach and
profile of more than 200 newspapers and magazines. Yearly, a quantitative
research among 21,000 respondents takes place to measure print reach,
but also other (perceived) media-usage.
Source: http://www.nommedia.nl/onderzoek/nom-print-monitor/, 25th September 2013
108. Newspapers print circulation still decreasing (-8% 2013 vs 2012), but e-paper*
gains terrain in newspaper landscape
0
500
1.000
1.500
2.000
2.500
2005 2006 2007 2008 2009 2010 2011 2012 2013
Quarterly circulation figures (in ‘000s)
National newspapers Regional newspapers Free sheets E-paper
Source: HOI, audited circulation figures for all paid-for and free-of-charge titles. Based on print only up until FY 2012. From 2013 unwards based on print total (print only + combi print +
replica)
*E-paper refer to the exact digital copy of a newspaper, e.g. in pdf-format, which can be accessed via the newspaper’s website, via an email download link or via a mobile app. NB: This
does not include a newspaper’s regular website or mobile site (Digital only replica and Digital only non-replica)
109. Title Total circulation
2012
Total circulation
2013
% change total
circulation YoY
Total circulation
2014 Q1
De Telegraaf 582,582 533,227 -8% 502,751
AD 420,977 411,772 -2% 385,421
De Volkskrant 260,708 255,097 -2% 265,829
NRC Handelsblad 199,359 189,979 -5% 176,732
Trouw 104,155 102,768 -1% 104,242
NRC.Next 79,387 62,965 -21% 49,906
Het Financieele Dagblad 54,678 53,861 -1% 50,782
Reformatorisch Dagblad 50,248 48,361 -4% 46,463
Nederlands Dagblad 26,039 23,761 -9% 22,506
1,780,145 1,681,791 -5% 1,604,632
Source: HOI, audited circulation figures. Based on print only (all paid-for and free-of-charge circulation).
All newspapers have dropped in circulation. Despite a 8% drop in circulation,
De Telegraaf remains the biggest newspaper
110. Title Media owner /
Publishing house
Sales house Distribution
Metro
Telegraaf Media Nederland /
Landelijke Media B.V.
Telegraaf Media
Nederland
National distribution & special editions in
Amsterdam, The Hague, Rotterdam
Sp!ts Telegraaf Media Nederland /
Landelijke Media B.V.
Telegraaf Media
Nederland
National distribution
With De Pers having gone out of business, only 2 free sheets are left: both of
which are now owned by Telegraaf Media
= Young adults, positive, provocative
= Overview of news developments, more serious news
Telegraaf Media is aiming to create two more distinct product propositions, i.e.
111. Blendle is a new platform for quality content. For a
small fee subscribers are one click away to buy articles
from several newspapers and magazines.
In June, Blendle has more 60.000 subscriptions. 20% of
the subscribers actually pay for articles.
More than half of the subscribers is under 35 years old.
NRC Handelsblad considers Blendle as “the iTunes for
journalism”.
NEW MEDIA DEVELOPMENT: PAY-PER-ARTICLE
113. Source: Retriever, July 2014 & HOI Q1 2014 (audited circulation figures)
Fact Sheet Consumer
Mags
Circa 1,380 consumer magazine titles registered by Retriever,
only 214 have audited circulation figures by HOI
Based on the 214 audited titles
Total circulation (incl. free circulation) = 24.0 million
Paid circulation = 14.7 million
This can vary strongly by category, e.g.
• Subscriptions important to Management, Sports , Family & Celebrity
and Radio & TV listings
• Newsstand sales important to Culinary, Mind & Body and Women’s
• Beauty care brands are the top magazine advertisers
114. 0
1000
2000
3000
4000
5000
6000
2009 2010 2011 2012 2013
Quarterly circulation figures (in ‘000s)
Culinary mags (incl sponsored)
Family & celebrity
Women's
TV listings
Home decoration, gardening & DIY
Kids & youth
Special interest
Parenting
Sports
Management
Other
Magazine circulation also decreasing slowly but steadily (-6% YoY); home
decoration, gardening and DIY shows uplift in 2013
Source: HOI, audited circulation figures. Based on all paid-for and free-of-charge circulation.
115. Top 10 magazine titles
in terms of circulation
Publication type
Total circulation
2012
Total circulation
2013
% change total
circulation YoY
Total circulation
2014 Q1
Kampioen Family/celebrity 3,540,991 3,529,929 0% 3.507.294
Allerhande* Sponsored mags 2,276,028 2,276,768 0% 2.294.035
Boodschappen* Sponsored mags 1,955,874 1,963,050 0% 1.966.680
SPOOR Sponsored mags 1,306,852 1,302,667 0% -
Eigen Huis magazine Home deco/gardening/DIY 694,817 706,008 2% 706,408
Vrouw Women's 683,466 626,594 -8% 605,448
Veronica Magazine TV listings 707,510 592,725 -16% 493,334
Zorgbelang Special interest 508,935 509,810 0% 511,599
Film1 Sport1 Gids TV listings 465,022 454,524 -2% -
Libelle Women’s 405,558 377,441 -7% 354,069
Total (across all titles) 29,846,651 25,260,696 -15% 24,001,851
Source: HOI, audited circulation figures. Based on all paid-for and free-of-charge circulation.
Sponsored magazines have the highest circulations
116. Source: NOM Print & Doelgroep Monitor 2013-I 2013-II, base: total NL 13+ (N=21,007)
Women’s,
family &
celebrity titles
have highest
reach
Top 10 magazine titles
in terms of audience reach
Publication type
Average issue reach
amongst NL 13+
(in ‘000s)
Average issue reach
amongst NL13+
(%)
Kampioen Family/celebrity 5,392 38.3
Allerhande Sponsored 4,181 29.7
Libelle Women’s 2,002 14.2
Veronica TV listings 1,829 13.0
Donald Duck Kids/youth 1,597 11.3
Privé Family/celebrity 1,365 9.7
Vrouw Women’s 1,363 9.7
Margriet Women’s 1,362 9.7
Quest Popular science 1,087 7.7
Story Family/celebrity 1,081 7.7
117. -
10.000
20.000
30.000
40.000
50.000
60.000
GrossmediaspendX1000
2011 2012 2013
There is a strong seasonality in magazines in which the summer period shows a strong decrease in media spend. It shows
highest spend levels in spring, fall and during the Christmas season.
Seasonality index for consumer magazine titles
Source: Nielsen, 2011 -2013
118. Sanoma Media
Nederland
In October 2013, Publisher Sanoma announced a large reorganization.
- Sanoma will focus on 17 titles:
o Libelle, Margriet, Flair, Viva, LINDA, Flow, Story
o Donald, Tina, Zo Zit Dat, Fashionista
o Ouders van Nu, Kèk Mama
o VT Wonen, Ariadne at Home, Eigen Huis & Interieur
o AutoWeek
- In June 2014, Sanoma announced it has sold 19 titles to New Skool
Media. The transition of the following titles will be finalized Q4 2014:
Home and Garden, Seasons, Knipmode, Knippie, MOTO73, MOTOR, Formule1,
Truckstar, Babygids, Roots, delicious., Vorsten, KIJK, Know How, ZIN, Fiets,
FietsActief, Procycling en Zeilen
- The clusters Men and Glossies still need to be sold or combined.
- Sanoma has ended publication of magazines FAB and Nusport, both
titles are now digitally exploited
Source: Persbericht – Sanoma Media Netherlands bereikt overeenstemming over verkoop 19 titels, 06th June 2014
119. Elsevier Juist, will appear 10 times a year as magazine and e-magazine and offers more
extensive articles and more photography than the regular Elsevier
Circulation: 40.000 | 1/1 page FC € 8.915
Trots, magazine for grandparents/active 50+, appears 6 times a year (controlled
circulation of WIJ database)
Circulation: 50.000 | 1/1 page FC 4.950
Introductions
120. Other developments and shifts
From 2014 exploited by ZPRESS Young (also responsible for a.o. Hitkrant,
MEIDENmagazine), coming from Audax Media
From January 2014, exploted by Weekbladpers (publisher of a.o. Vrij Nederland, Yoga
Magazine), coming from Audax Media
From 9 January 2014, published and exploited by Veen Media (publisher of a.o. Filosofie
Magazine, New Scientist), coming from Weekbladpers
Magazine disappeared, bi-weekly digital app introduced instead
122. In September 2011, the new currency for audience measurement was launched
for OOH: VAC, the visibility adjusted contact.
Compared to former audience measurement approaches,
VAC is based on a new way of measuring:
Inventory and classification of street objects;
Measuring of all traffic;
Field research to travel behaviour;
Measuring 13-75 year olds;
Differentiates between location of objects (near pathway, railway stations, shopping centres,
supermarkets, parking garages, petrol stations and traffic advertisement)
Audience measurement for OOH – from OTS to VAC
Source: Het Buitenreclame Onderzoek 2011
123. For this study the Netherlands was divided
into 30 regions, each one around a city
with at least 75,000 inhabitants.
Each of the individual regions/media owner
packages can be analyzed via specialist
software (CAFAS) that is accessible to all planners.
VAC data available via CAFAS software
Source: Het Buitenreclame Onderzoek 2011
Due to conflicting interests,
Interbest stopped participating
as of 1st March 2013.
124. Fact Sheet
Outdoor
Abri’s (6-sheets), billboards (48s and 96s) and Masts are the most widely used
formats.
Street abri’s (6-sheets) and billboards are in the hands of 4 major players.
Tourism, Food & Drink, Retail and Telecom are the biggest advertisers in terms of
spend.
Seasonality in spending is very limited.
In summer time high(er) discounts are possible whilst advertisers benefit from
more daytime light
(= more people out and about in the streets)
High variety in outdoor media objects and sizes; number of digital objects is
increasing. Growing offer of digital screens and incorporated technology allow
interaction with target audience (e.g. via bluetooth, QR codes and NFC)
125. Company Objects
JCDecaux Ad shells/6s, billboards, odd-sized objects
ExterionMedia Ad shells/6s, billboards, buses/trams, railway stations
Clear Channel Hillenaar Ad shells/6s, city cells, billboards, masts, parking garages, schools, metro stations
Interbest Masts near highways
Azero A0 posters
Centercom Posters and LCD screens in shopping centres and supermarkets and A0 posters
MMD Media Various media at local airports, ad shells in bars, clubs, discotheques, cinemas, sport clubs,
petrol stations, billboards
Schiphol Media Big variety of media at Schiphol Airport Amsterdam
OV Media & Triple Media Buses, A3 posters in buses
Altermedia A3 posters indoor (cafes, bars, cinemas), taxis, sampling, car2go/cargohopper
Boomerang Media Freecards
Outdoor Media Owners
Source: Retriever, June 2014
126. Outdoor market dominated by 2 big players, JCDecaux and CBS. Overall media spend for OOH
increased in 2012. Interestingly, it was mainly the smaller players who benefited.
Source: Nielsen, 2011 - 2013
0%
10%
20%
30%
40%
Share of gross media spend OOH
2011 2012 2013
Total Spend 2011: € 415,235,318
Total Spend 2012: € 468,007,528
Total Spend 2013: € 477,697,912
Others
127. Public transport shows highest reach potential (Triple & OV media). CBS and JC
Decaux have highest reach among younger people (13-34)
Source: CAFAS, October based on September 2013, database version 1.20.745
Reach is based on all packages per vendor available in CAFAS. JC Decaux is split up in shelters and billboards due to the number of packages.
0%
20%
40%
60%
80%
100%
13-29 20-34 35-49 50-64 65-75
OOH reach per vendor per age
Triple Media
CBS
JC Decaux - abri's
OV Media
JC Decaux - billboards
Centercom
MMD
128. Since 21st January 2014, CBS Outdoor is internationally rebranded as Exterion Media.
The change follows the acquisition of CBS Outdoor International in September by Platinum Equity, a private
equity firm specialized in mergers, acquisitions and operations.
CBS Outdoor International to rebrand as Exterion Media
Source: http://www.cbsoutdoorinternational.com/About-Us/Press-Centre/Press-Releases/CBS-Outdoor-International-to-rebrand-as-Exterion-Media/
129. -
10.000
20.000
30.000
40.000
50.000
January February March April May June July August September Oktober November December
GrossmediaspendX1000
2011 2012 2013
Seasonality for OOH: Summer and Christmas season are main periods for OOH
advertising.
Source: Nielsen, 2011 - 2013
130. NFC (Near Field Communication)
By implementing a NFC chip in an
ad shell, consumers are able to
respond directly with their
smartphones. The options to
include are video/audio, buying,
store locator, voucher and apps.
Web enabled objects
Interactive ad shells, like live
video feed, digital screens or
cameras.
The digitalization of OOH offers many opportunities to interact with consumers
Digital Flagship Store or Online
Shopping Ad shells
With apps like Layar or QR codes
consumers can directly buy
products from stickers on a store
or ad shell
131. New digital sites
Blow UP: The WOW,
opposite to Rotterdam CS
ExterionMedia: digital LED screen on Alexandrium and
Westblaak/Karel Doormanstraat, Rotterdam
Ngage: RailTV, digital screens
(32 in total) on Eindhoven CS,
Rotterdam CS, Den Bosch,
Leiden CS, Amsterdam Zuid
WTC
133. 30.8million
cinema visitors in
2013 (+0.8%)
€8.10Average price per
ticket (+1%)
47%visits the cinema
at least once every
6 months
Since 2010, the total number of cinema visitors is at a historically high level
(previously seen in 1978)
Source: Nederlandse Vereniging van Filmdistributeurs (Dutch Film Distributors Association) and Nederlandse Vereniging van Bioscoopexploitanten (Dutch Association of
Cinema Media Owners), press release January 2014 | NOM Print & Doelgroep Monitor 2013 I – 2013 II, N= 21,007
134. Number of cinema visitors is increasing in line with the number of film releases
per year
-
100
200
300
400
0
5
10
15
20
25
30
35
2003 2004 2005 2006 2007 2008 2009 2010 2011 2012
#Cinemas&FilmReleases
Visitorsinmillion
# Visitors (million) # Film releases # Cinemas
Source: Nederlandse Vereniging van Filmdistributeurs (Dutch Film Distributors Association) and Nederlandse Vereniging van Bioscoopexploitanten (Dutch Association of
Cinema Media Owners), annual report 2012. *annual report 2013 not available yet
135. Seasonality in media spend does not show same pattern as number of visitors
through the year.
Source: Average seasonality cinema visits Jean Mineur Network 2007-2011, Gross media spend: Nielsen
-
20
40
60
80
100
120
140
0
500
1.000
1.500
2.000
2.500
Jan Feb March Apr May June July Aug Sep Oct Nov Dec
Visitorsindex
Grossmediaspendx1000
Gross media spend 2013 Average vistors index 2007-2011
136. Adventure, family and Dutch films are most popular in 2013
The Hobbit: The Desolation of Smaug
(3D) was the most profitable movie in
2013 with a return of 8,1 million Euro
(777.553 visitors)
Despicable Me 2 was the most
popular movie, 914.893 visitors have
seen this film (OV and Dutch) on
screen
Verliefd op Ibiza was the most popular
Dutch movie; 714.853 visitors
Market share of Dutch movies
increased to 20,5% (2012: 14,18 %)
Source: Nederlandse Vereniging van Filmdistributeurs (Dutch Film Distributors Association), Press release January 2014
137. REACH CINEMA PER WEEK
Target audience Reach per week (x 1,000) %
Total 13+ 670 4.8
Men 347 5.0
Women 323 4.5
Age
13-19 123 8.8
20-34 229 7.5
35-49 156 4.3
50+ 163 2.7
Level of wealth
1 (high) 199 6.2
2 119 5.2
3 187 5.7
4 148 3.8
5 (low) 17 1.3
Cinemas attract
a younger
audience and a
higher level of
wealth
Source: NOM Print & Doelgroep Monitor 2013 I – 2013 II, base: total NL 13+ (N=21,007)