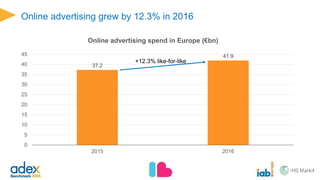
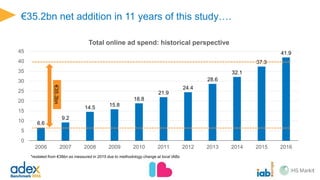
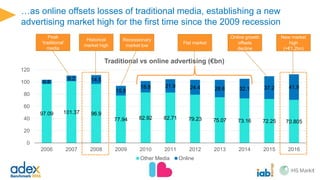
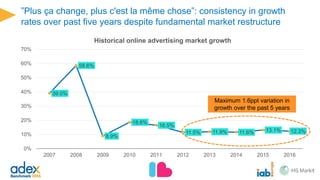
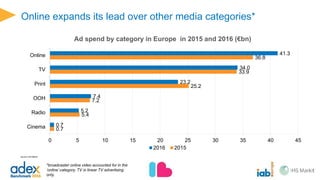
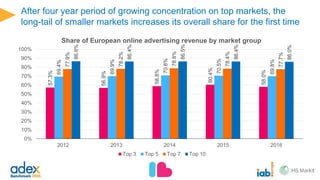
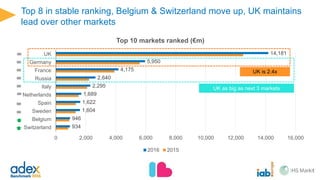
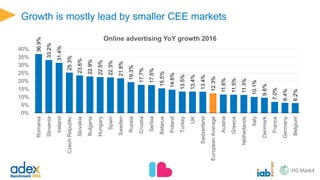
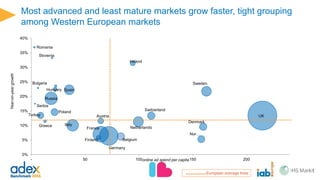
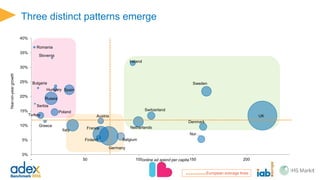
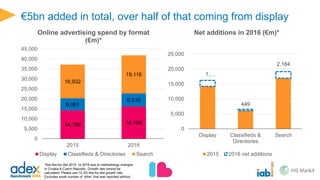
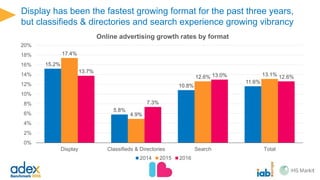
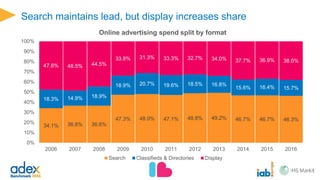
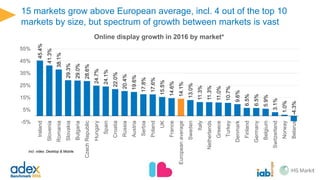
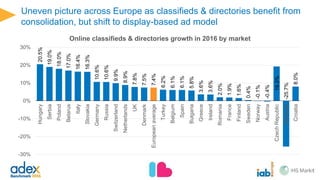
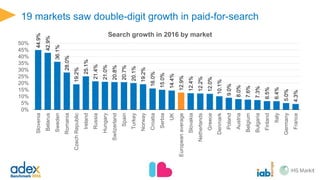
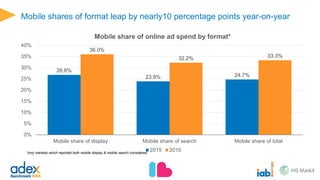
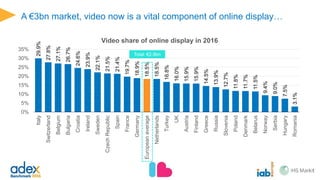
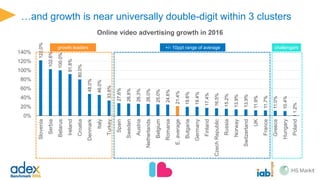
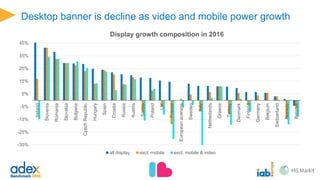
May 2017
The data and charts shown in this
report cannot be used without the
expressed permission of IAB Europe
and IHS Markit
About the study
A meta-analysis of online ad spend in Europe
RATECARD
Campaigns x
Ratecard
GROSS
Spend Billed
NET
Revenue Billed
No Agency commissions
Data for 27 countries in Europe
• Austria
• Belarus
• Belgium
• Bulgaria
• Czech Republic
• Croatia
• Denmark
• Finland
• France
• Germany
• Greece
• Hungary
• Ireland
• Italy
• Netherlands
• Norway
• Poland
• Russia
• Romania
• Serbia
• Slovakia
• Slovenia
• Spain
• Sweden
• Switzerland
• Turkey
• UK
About the data
This market sizing is based on the following methods:
• Reported data from national IABs
• Estimates by national IABs based on local insight
• Estimates by national IABs in collaboration with IHS Markit
• Estimates & actuals by IHS Markit based on the IHS Advertising Intelligence Service & macro-
economic research group
Big Picture
Europe: the value of online advertising in 2016
€41.9bn
Eurozone macroeconomic environment has stabilised after two recessions
and holds firm despite political uncertainty
-8%
-6%
-4%
-2%
0%
2%
4%
6%
8%
2004Q1
2004Q3
2005Q1
2005Q3
2006Q1
2006Q3
2007Q1
2007Q3
2008Q1
2008Q3
2009Q1
2009Q3
2010Q1
2010Q3
2011Q1
2011Q3
2012Q1
2012Q3
2013Q1
2013Q3
2014Q1
2014Q3
2015Q1
2015Q3
2016Q1
2016Q3
2017Q1
Eurozone France Germany Italy Spain
GDP growth in Eurozone (%)
Source: IHS Markit © 2017 IHS Markit
Growth
Online advertising grew by 12.3% in 2016
37.2
41.9
0
5
10
15
20
25
30
35
40
45
2015 2016
Online advertising spend in Europe (€bn)
+12.3% like-for-like
€35.3bn net addition in 11 years of this study….
6.6
9.2
14.5 15.8
18.8
21.9
24.4
28.6
32.1
37.3
41.9
0
5
10
15
20
25
30
35
40
45
2006 2007 2008 2009 2010 2011 2012 2013 2014 2015 2016
Total online ad spend: historical perspective
€35.3bn
*restated from €36bn as measured in 2015 due to methodology change at local IABs
…as online offsets losses of traditional media, establishing a new
advertising market high for the first time since the 2009 recession
97.09 101.37 96.9
77.94 82.92 82.71 79.23 75.07 73.16 72.25 70.81
6.6
9.2 14.5
15.8
18.8 21.9 24.4 28.6 32.1 37.3 41.9
0
20
40
60
80
100
120
2006 2007 2008 2009 2010 2011 2012 2013 2014 2015 2016
Traditional vs online advertising (€bn)
Other Media Online €112.6bn
Peak
‘traditional’
media
New market
high (+€1.2bn)
Recessionary
market low
Historical
market high
Flat market
Online growth
offsets decline
”Plus ça change, plus c'est la même chose”: consistency in growth rates
over past five years despite fundamental market restructure
39.0%
58.6%
8.9%
18.6%
16.5%
11.5% 11.9% 11.6% 13.0% 12.3%
0%
10%
20%
30%
40%
50%
60%
70%
2007 2008 2009 2010 2011 2012 2013 2014 2015 2016
Historical online advertising market growth
Maximum 1.6ppt variation in
growth over the past 5 years
Online expands its lead over other media categories*
0.7
5.4
7.2
25.2
33.9
36.8
0.7
5.2
7.4
23.2
34.0
41.9
0 5 10 15 20 25 30 35 40 45
Cinema
Radio
OOH
Print
TV
Online
2016 2015
Ad spend by category in Europe in 2015 and 2016 (€bn)
Source: IHS Markit
*broadcaster online video accounted for in the
‘online’ category. TV is linear TV advertising only.
Markets
After four year period of growing concentration on top markets, the long-
tail of smaller markets increases its overall share for the first time
57.3%
56.9%
58.8%
60.4%
58.0%
69.4%
69.9%
70.8%
70.5%
69.8%
77.9%
78.2%
78.8%
78.4%
77.7%
86.6%
86.4%
86.5%
86.4%
86.0%
0%
10%
20%
30%
40%
50%
60%
70%
80%
90%
100%
2012 2013 2014 2015 2016
Share of European online advertising revenue by market group
Top 3 Top 5 Top 7 Top 10
934
946
1,604
1,622
1,689
2,295
2,640
4,175
5,950
14,181
0 2,000 4,000 6,000 8,000 10,000 12,000 14,000 16,000
Switzerland
Belgium
Sweden
Spain
Netherlands
Italy
Russia
France
Germany
UK
Top 10 markets ranked (€m)
2016 2015
UK is 2.4x Germany
UK as big as next 3 markets combined
Top 8 in stable ranking, Belgium & Switzerland move up, UK maintains
lead over other markets
Growth is mostly lead by smaller CEE markets
36.9%
33.2%
31.4%
25.3%
23.6%
22.9%
22.5%
22.3%
21.8%
19.3%
17.7%
17.5%
15.5%
14.6%
13.5%
13.4%
13.4%
12.3%
11.6%
11.5%
11.3%
10.1%
9.6%
7.0%
6.4%
6.2%
0%
5%
10%
15%
20%
25%
30%
35%
40%
Romania
Slovenia
Ireland
CzechRepublic
Slovakia
Bulgaria
Hungary
Spain
Sweden
Russia
Croatia
Serbia
Belarus
Poland
Turkey
UK
Switzerland
EuropeanAverage
Austria
Greece
Netherlands
Italy
Denmark
France
Germany
Belgium
Online advertising YoY growth 2016
Most advanced and least mature markets grow faster, tight grouping
among Western European markets
Year-on-yeargrowth
European average lines
online ad spend per capita
Bulgaria
Belarus
Croatia
Czech Republic
Denmark
Finland
France
Germany
Greece
Hungary
Ireland
Italy
Netherlands
Norway
Poland
Romania
RussiaSerbia
Slovenia
Spain
Austria
Belgium
Sweden
SwitzerlandTurkey UK
Slovakia
0%
5%
10%
15%
20%
25%
30%
35%
40%
0 10 20 30 40 50 60 70 80 90 100 110 120 130 140 150 160 170 180 190 200 210 220 230 240 250
Three distinct patterns emerge
Year-on-yeargrowth
European average lines
online ad spend per capita
Bulgaria
Belarus
Croatia
Czech Republic
Denmark
Finland
France
Germany
Greece
Hungary
Ireland
Italy
Netherlands
Norway
Poland
Romania
RussiaSerbia
Slovenia
Spain
Austria
Belgium
Sweden
SwitzerlandTurkey UK
Slovakia
0%
5%
10%
15%
20%
25%
30%
35%
40%
0 10 20 30 40 50 60 70 80 90 100 110 120 130 140 150 160 170 180 190 200 210 220 230 240 250
What enables & hinders growth according to national IABs?
Drivers
• Programmatic & automation
• e- and m-commerce
• Rise of online video consumption
• Premium video inventory
• Improvement in ad quality
• Mobile-first advertiser mentality
• Social platforms
• Native
• E-Sports
• Consolidation
Hurdles
• Ad blocking
• Fraud
• Complexity of value chain
• Brand safety
• Privacy & regulation
• Measurement (esp. omniscreen video)
• Cross-funnel and cross-media attribution
• Turning data into insight
• Adapting desktop ads to mobile
– High production costs
– Structural barriers
• Platform distribution & monetization
• Macroeconomic environment and adverse political
conditions
Formats
€5bn added in total, over half of that coming from display
14,199 16,196
6,061
6,510
16,932
19,116
0
5,000
10,000
15,000
20,000
25,000
30,000
35,000
40,000
45,000
2015 2016
Online advertising spend by format
(€m)*
Display Classifieds & Directories Search
1,997
449
2,184
0
5,000
10,000
15,000
20,000
25,000
Display Classifieds &
Directories
Search
Net additions in 2016 (€m)*
2015 2016 net additions
*Not like-for-like 2015 vs 2016 due to methodology changes in
Croatia & Czech Republic. Growth rate cannot be calculated.
Please use 12.3% like-for-like growth rate. Excludes small
number of ‘other’ that was reported without format designation.
Display has been the fastest growing format for the past three years, but
classifieds & directories and search experience growing vibrancy
15.2%
5.8%
10.8%
11.6%
17.2%
4.9%
12.5% 13.0%
14.1%
7.4%
12.9%
12.3%
0%
2%
4%
6%
8%
10%
12%
14%
16%
18%
20%
Display Classifieds & Directories Search Total
Online advertising growth rates by format
2014 2015 2016
Search maintains lead, but display increases share
34.1% 36.6% 36.6%
47.3% 48.0% 47.1% 48.8% 49.2% 46.7% 46.7% 45.6%
18.3% 14.9% 18.9%
18.9% 20.7% 19.6% 18.5% 16.8%
15.6% 16.4% 15.6%
47.6% 48.5% 44.5%
33.8% 31.3% 33.3% 32.7% 34.0% 37.7% 36.9% 38.6%
0%
10%
20%
30%
40%
50%
60%
70%
80%
90%
100%
2006 2007 2008 2009 2010 2011 2012 2013 2014 2015 2016
Online advertising spend split by format
Search Classifieds & Directories Display
15 markets grow above European average, incl. 4 out of the top 10
markets by size, but spectrum of growth between markets is vast
45.4%
41.3%
38.1%
29.3%
29.0%
28.6%
24.7%
24.1%
22.0%
20.4%
19.6%
17.8%
17.6%
15.5%
14.6%
14.1%
13.0%
11.3%
11.3%
11.0%
10.7%
9.6%
6.5%
6.5%
5.9%
3.1%
1.0%
-4.3%
-5%
5%
15%
25%
35%
45%
55%
Ireland
Slovenia
Romania
Slovakia
Bulgaria
CzechRepublic
Hungary
Spain
Croatia
Russia
Austria
Serbia
Poland
UK
France
Europeanaverage
Sweden
Italy
Netherlands
Greece
Turkey
Denmark
Finland
Germany
Belgium
Switzerland
Norway
Belarus
Online display growth in 2016 by market*
incl. video. Desktop & Mobile.
Uneven picture across Europe as classifieds & directories benefit from
consolidation, but shift to display-based ad model
20.5%
19.3%
19.0%
18.0%
17.0%
16.4%
16.3%
10.6%
10.6%
9.9%
8.9%
8.0%
7.8%
7.5%
7.4%
6.2%
6.1%
6.1%
5.8%
3.6%
3.6%
2.0%
1.9%
1.6%
0.4%
-0.1%
-0.4%
-25.7%
-30%
-20%
-10%
0%
10%
20%
30%
Hungary
CzechRepublic
Serbia
Poland
Belarus
Italy
Slovakia
Germany
Russia
Switzerland
Netherlands
Croatia
UK
Denmark
Europeanaverage
Turkey
Belgium
Spain
Bulgaria
Greece
Ireland
Romania
France
Finland
Sweden
Norway
Austria
Slovenia
Online classifieds & directories growth in 2016 by market
19 markets saw double-digit growth in paid-for-search
44.9%
42.9%
36.1%
28.0%
25.1%
21.4%
21.0%
20.8%
20.7%
20.1%
19.2%
19.2%
16.0%
15.0%
14.4%
12.9%
12.4%
12.2%
12.0%
10.1%
9.0%
8.0%
7.6%
7.3%
6.5%
6.4%
5.0%
4.3%
0%
5%
10%
15%
20%
25%
30%
35%
40%
45%
50%
Slovenia
Belarus
Sweden
Romania
Ireland
Russia
Hungary
Switzerland
Spain
Turkey
Norway
CzechRepublic
Croatia
Serbia
UK
Europeanaverage
Slovakia
Netherlands
Greece
Denmark
Poland
Austria
Belgium
Bulgaria
Finland
Italy
Germany
France
Search growth in 2016 by market
Mobile shares of format leap by nearly10 percentage points year-on-year
26.8%
23.9% 24.7%
36.0%
32.2% 33.3%
0%
5%
10%
15%
20%
25%
30%
35%
40%
Mobile share of display Mobile share of search Mobile share of total
Mobile share of online ad spend by format*
2015 2016
*only markets which reported both mobile display & mobile search considered
A €3bn market, video now is a vital component of online display…
29.9%
27.8%
27.1%
26.7%
24.6%
23.9%
22.1%
21.5%
21.4%
19.7%
18.9%
18.5%
18.5%
16.8%
16.0%
15.6%
15.9%
14.5%
13.9%
12.7%
11.8%
11.7%
11.5%
9.4%
9.0%
7.5%
3.1%
0%
5%
10%
15%
20%
25%
30%
35%
Italy
Switzerland
Belgium
Bulgaria
Croatia
Ireland
Sweden
CzechRepublic
Spain
France
Germany
Europeanaverage
Netherlands
Turkey
UK
Austria
Finland
Greece
Russia
Slovenia
Poland
Denmark
Belarus
Norway
Serbia
Hungary
Romania
Video share of online display in 2016
Total: €2.9bn
…and growth is near universally double-digit within 3 clusters
122.0%
102.6%
100.0%
91.8%
80.0%
48.0%
46.0%
33.6%
27.6%
26.8%
26.3%
26.0%
25.0%
24.6%
21.4%
19.6%
19.4%
17.4%
16.5%
15.2%
13.9%
13.9%
11.9%
11.7%
11.0%
10.4%
1.2%
0%
20%
40%
60%
80%
100%
120%
140%
Slovenia
Serbia
Belarus
Ireland
Croatia
Denmark
Italy
Turkey
Spain
Sweden
Austria
Netherlands
Belgium
Romania
E.average
Bulgaria
Germany
Finland
CzechRepublic
Russia
Norway
Switzerland
UK
France
Greece
Hungary
Poland
Online video advertising growth in 2016
growth leaders +/- 10ppt range of average challengers
Mobile display is highly concentrated, but 14 out of 22 countries
measured grew faster than the market leader*
2,645
677
606
258
178
168
139
129
124
107
100
66
51
49
39
25
24
5
4
1.4
0.9
0.5
0
500
1,000
1,500
2,000
2,500
3,000
UK
Italy
Norway
Netherlands
Turkey
Ireland
CzechRepublic
Denmark
Austria
Romania
Croatia
Mobile display advertising 2016 (€bn)
327.0%
191.3%
156.3%
107.7%
95.0%
89.5%
86.6%
85.1%
79.7%
72.6%
66.7%
64.4%
52.9%
51.9%
51.6%
45.3%
37.3%
36.7%
34.7%
33.4%
30.9%
26.6%
26.5%
0%
50%
100%
150%
200%
250%
300%
350%
Serbia
Romania
Turkey
France
Croatia
Ireland
Russia
Bulgaria
CzechRepublic
Hungary
Belarus
Poland
Europeanaverage
Denmark
Italy
UK
Sweden
Austria
Netherlands
Finland
Spain
Norway
Germany
Mobile display advertising growth in 2016
*5 countries did not report mobile display
0
500
1,000
1,500
2,000
2,500
3,000
UK
France
Italy
Germany
Norway
Sweden
Netherlands
Russia
Turkey
Poland
Top mobile display
+2 ranks vs all
display
Market leaders are not created equal: the top 10 ranking by display
market size looks different in mobile and video
0
100
200
300
400
500
600
700
800
900
UK
Italy
Germany
France
Spain
Belgium
Netherlands
Sweden
Russia
CzechRepublic
Top video
0
1,000
2,000
3,000
4,000
5,000
6,000
UK
Germany
France
Italy
Spain
Russia
Netherlands
Sweden
Belgium
Poland
Top all display
Only in
mobile Only in
mobile
+1 rank vs
all display
-2 ranks vs
all display
+1 rank vs
all display
Only in
video
-3 ranks vs
all display
+2 ranks vs all
display
+3 ranks vs all
display
Not in top
mobile
Not in top
video
Not in top
mobile
Desktop banner is decline as video and mobile power growth
-35%
-25%
-15%
-5%
5%
15%
25%
35%
45%
Ireland
Slovenia
Romania
Slovakia
Bulgaria
CzechRepublic
Hungary
Spain
Croatia
Russia
Austria
Serbia
Poland
UK
France
Europeanaverage
Sweden
Italy
Netherlands
Greece
Turkey
Denmark
Finland
Germany
Belgium
Switzerland
Norway
Belarus
Display growth composition in 2016
all display
Desktop banner is decline as video and mobile power growth
-35%
-25%
-15%
-5%
5%
15%
25%
35%
45%
Ireland
Slovenia
Romania
Slovakia
Bulgaria
CzechRepublic
Hungary
Spain
Croatia
Russia
Austria
Serbia
Poland
UK
France
Europeanaverage
Sweden
Italy
Netherlands
Greece
Turkey
Denmark
Finland
Germany
Belgium
Switzerland
Norway
Belarus
Display growth composition in 2016
all display excl. mobile
Desktop banner is decline as video and mobile power growth
-35%
-25%
-15%
-5%
5%
15%
25%
35%
45%
Ireland
Slovenia
Romania
Slovakia
Bulgaria
CzechRepublic
Hungary
Spain
Croatia
Russia
Austria
Serbia
Poland
UK
France
Europeanaverage
Sweden
Italy
Netherlands
Greece
Turkey
Denmark
Finland
Germany
Belgium
Switzerland
Norway
Belarus
Display growth composition in 2016
all display excl. mobile excl. mobile & video
Outlook for 2017
• Expect approximately +10% growth over 2016
• Concentration of growth among fewer players will accelerate
• Video will become the primary battleground for consumer attention
• Live video set to focus on sports and UGC
• E-Sports advertising is gaining traction
• Audio is increasingly attractive to marketers
• Mobile-first becomes AI-first (but promise & practice are far apart)
• Regulation will have a material impact on the future health of the market
Contact:
Alison Fennah – fennah@iabeurope.eu
Marie-Clare Puffett – puffett@iabeurope.eu
Daniel Knapp – daniel.knapp@ihsmarkit.com
Qingzhen (Jessie) Chen – jessie.chen@ihsmarkit.com
Connect with us:
@IABEurope IAB Europe
www.iabeurope.eu www.technology.ihs.com
@IHS4Tech

AdEx Benchmark 2016 Study

  • 1.
  • 2.
    The data andcharts shown in this report cannot be used without the expressed permission of IAB Europe and IHS Markit
  • 3.
  • 4.
    A meta-analysis ofonline ad spend in Europe RATECARD Campaigns x Ratecard GROSS Spend Billed NET Revenue Billed No Agency commissions
  • 5.
    Data for 27countries in Europe • Austria • Belarus • Belgium • Bulgaria • Czech Republic • Croatia • Denmark • Finland • France • Germany • Greece • Hungary • Ireland • Italy • Netherlands • Norway • Poland • Russia • Romania • Serbia • Slovakia • Slovenia • Spain • Sweden • Switzerland • Turkey • UK
  • 6.
    About the data Thismarket sizing is based on the following methods: • Reported data from national IABs • Estimates by national IABs based on local insight • Estimates by national IABs in collaboration with IHS Markit • Estimates & actuals by IHS Markit based on the IHS Advertising Intelligence Service & macro- economic research group
  • 7.
  • 8.
    Europe: the valueof online advertising in 2016 €41.9bn
  • 9.
    Eurozone macroeconomic environmenthas stabilised after two recessions and holds firm despite political uncertainty -8% -6% -4% -2% 0% 2% 4% 6% 8% 2004Q1 2004Q3 2005Q1 2005Q3 2006Q1 2006Q3 2007Q1 2007Q3 2008Q1 2008Q3 2009Q1 2009Q3 2010Q1 2010Q3 2011Q1 2011Q3 2012Q1 2012Q3 2013Q1 2013Q3 2014Q1 2014Q3 2015Q1 2015Q3 2016Q1 2016Q3 2017Q1 Eurozone France Germany Italy Spain GDP growth in Eurozone (%) Source: IHS Markit © 2017 IHS Markit Growth
  • 10.
    Online advertising grewby 12.3% in 2016 37.2 41.9 0 5 10 15 20 25 30 35 40 45 2015 2016 Online advertising spend in Europe (€bn) +12.3% like-for-like
  • 11.
    €35.3bn net additionin 11 years of this study…. 6.6 9.2 14.5 15.8 18.8 21.9 24.4 28.6 32.1 37.3 41.9 0 5 10 15 20 25 30 35 40 45 2006 2007 2008 2009 2010 2011 2012 2013 2014 2015 2016 Total online ad spend: historical perspective €35.3bn *restated from €36bn as measured in 2015 due to methodology change at local IABs
  • 12.
    …as online offsetslosses of traditional media, establishing a new advertising market high for the first time since the 2009 recession 97.09 101.37 96.9 77.94 82.92 82.71 79.23 75.07 73.16 72.25 70.81 6.6 9.2 14.5 15.8 18.8 21.9 24.4 28.6 32.1 37.3 41.9 0 20 40 60 80 100 120 2006 2007 2008 2009 2010 2011 2012 2013 2014 2015 2016 Traditional vs online advertising (€bn) Other Media Online €112.6bn Peak ‘traditional’ media New market high (+€1.2bn) Recessionary market low Historical market high Flat market Online growth offsets decline
  • 13.
    ”Plus ça change,plus c'est la même chose”: consistency in growth rates over past five years despite fundamental market restructure 39.0% 58.6% 8.9% 18.6% 16.5% 11.5% 11.9% 11.6% 13.0% 12.3% 0% 10% 20% 30% 40% 50% 60% 70% 2007 2008 2009 2010 2011 2012 2013 2014 2015 2016 Historical online advertising market growth Maximum 1.6ppt variation in growth over the past 5 years
  • 14.
    Online expands itslead over other media categories* 0.7 5.4 7.2 25.2 33.9 36.8 0.7 5.2 7.4 23.2 34.0 41.9 0 5 10 15 20 25 30 35 40 45 Cinema Radio OOH Print TV Online 2016 2015 Ad spend by category in Europe in 2015 and 2016 (€bn) Source: IHS Markit *broadcaster online video accounted for in the ‘online’ category. TV is linear TV advertising only.
  • 15.
  • 16.
    After four yearperiod of growing concentration on top markets, the long- tail of smaller markets increases its overall share for the first time 57.3% 56.9% 58.8% 60.4% 58.0% 69.4% 69.9% 70.8% 70.5% 69.8% 77.9% 78.2% 78.8% 78.4% 77.7% 86.6% 86.4% 86.5% 86.4% 86.0% 0% 10% 20% 30% 40% 50% 60% 70% 80% 90% 100% 2012 2013 2014 2015 2016 Share of European online advertising revenue by market group Top 3 Top 5 Top 7 Top 10
  • 17.
    934 946 1,604 1,622 1,689 2,295 2,640 4,175 5,950 14,181 0 2,000 4,0006,000 8,000 10,000 12,000 14,000 16,000 Switzerland Belgium Sweden Spain Netherlands Italy Russia France Germany UK Top 10 markets ranked (€m) 2016 2015 UK is 2.4x Germany UK as big as next 3 markets combined Top 8 in stable ranking, Belgium & Switzerland move up, UK maintains lead over other markets
  • 18.
    Growth is mostlylead by smaller CEE markets 36.9% 33.2% 31.4% 25.3% 23.6% 22.9% 22.5% 22.3% 21.8% 19.3% 17.7% 17.5% 15.5% 14.6% 13.5% 13.4% 13.4% 12.3% 11.6% 11.5% 11.3% 10.1% 9.6% 7.0% 6.4% 6.2% 0% 5% 10% 15% 20% 25% 30% 35% 40% Romania Slovenia Ireland CzechRepublic Slovakia Bulgaria Hungary Spain Sweden Russia Croatia Serbia Belarus Poland Turkey UK Switzerland EuropeanAverage Austria Greece Netherlands Italy Denmark France Germany Belgium Online advertising YoY growth 2016
  • 19.
    Most advanced andleast mature markets grow faster, tight grouping among Western European markets Year-on-yeargrowth European average lines online ad spend per capita Bulgaria Belarus Croatia Czech Republic Denmark Finland France Germany Greece Hungary Ireland Italy Netherlands Norway Poland Romania RussiaSerbia Slovenia Spain Austria Belgium Sweden SwitzerlandTurkey UK Slovakia 0% 5% 10% 15% 20% 25% 30% 35% 40% 0 10 20 30 40 50 60 70 80 90 100 110 120 130 140 150 160 170 180 190 200 210 220 230 240 250
  • 20.
    Three distinct patternsemerge Year-on-yeargrowth European average lines online ad spend per capita Bulgaria Belarus Croatia Czech Republic Denmark Finland France Germany Greece Hungary Ireland Italy Netherlands Norway Poland Romania RussiaSerbia Slovenia Spain Austria Belgium Sweden SwitzerlandTurkey UK Slovakia 0% 5% 10% 15% 20% 25% 30% 35% 40% 0 10 20 30 40 50 60 70 80 90 100 110 120 130 140 150 160 170 180 190 200 210 220 230 240 250
  • 21.
    What enables &hinders growth according to national IABs? Drivers • Programmatic & automation • e- and m-commerce • Rise of online video consumption • Premium video inventory • Improvement in ad quality • Mobile-first advertiser mentality • Social platforms • Native • E-Sports • Consolidation Hurdles • Ad blocking • Fraud • Complexity of value chain • Brand safety • Privacy & regulation • Measurement (esp. omniscreen video) • Cross-funnel and cross-media attribution • Turning data into insight • Adapting desktop ads to mobile – High production costs – Structural barriers • Platform distribution & monetization • Macroeconomic environment and adverse political conditions
  • 22.
  • 23.
    €5bn added intotal, over half of that coming from display 14,199 16,196 6,061 6,510 16,932 19,116 0 5,000 10,000 15,000 20,000 25,000 30,000 35,000 40,000 45,000 2015 2016 Online advertising spend by format (€m)* Display Classifieds & Directories Search 1,997 449 2,184 0 5,000 10,000 15,000 20,000 25,000 Display Classifieds & Directories Search Net additions in 2016 (€m)* 2015 2016 net additions *Not like-for-like 2015 vs 2016 due to methodology changes in Croatia & Czech Republic. Growth rate cannot be calculated. Please use 12.3% like-for-like growth rate. Excludes small number of ‘other’ that was reported without format designation.
  • 24.
    Display has beenthe fastest growing format for the past three years, but classifieds & directories and search experience growing vibrancy 15.2% 5.8% 10.8% 11.6% 17.2% 4.9% 12.5% 13.0% 14.1% 7.4% 12.9% 12.3% 0% 2% 4% 6% 8% 10% 12% 14% 16% 18% 20% Display Classifieds & Directories Search Total Online advertising growth rates by format 2014 2015 2016
  • 25.
    Search maintains lead,but display increases share 34.1% 36.6% 36.6% 47.3% 48.0% 47.1% 48.8% 49.2% 46.7% 46.7% 45.6% 18.3% 14.9% 18.9% 18.9% 20.7% 19.6% 18.5% 16.8% 15.6% 16.4% 15.6% 47.6% 48.5% 44.5% 33.8% 31.3% 33.3% 32.7% 34.0% 37.7% 36.9% 38.6% 0% 10% 20% 30% 40% 50% 60% 70% 80% 90% 100% 2006 2007 2008 2009 2010 2011 2012 2013 2014 2015 2016 Online advertising spend split by format Search Classifieds & Directories Display
  • 26.
    15 markets growabove European average, incl. 4 out of the top 10 markets by size, but spectrum of growth between markets is vast 45.4% 41.3% 38.1% 29.3% 29.0% 28.6% 24.7% 24.1% 22.0% 20.4% 19.6% 17.8% 17.6% 15.5% 14.6% 14.1% 13.0% 11.3% 11.3% 11.0% 10.7% 9.6% 6.5% 6.5% 5.9% 3.1% 1.0% -4.3% -5% 5% 15% 25% 35% 45% 55% Ireland Slovenia Romania Slovakia Bulgaria CzechRepublic Hungary Spain Croatia Russia Austria Serbia Poland UK France Europeanaverage Sweden Italy Netherlands Greece Turkey Denmark Finland Germany Belgium Switzerland Norway Belarus Online display growth in 2016 by market* incl. video. Desktop & Mobile.
  • 27.
    Uneven picture acrossEurope as classifieds & directories benefit from consolidation, but shift to display-based ad model 20.5% 19.3% 19.0% 18.0% 17.0% 16.4% 16.3% 10.6% 10.6% 9.9% 8.9% 8.0% 7.8% 7.5% 7.4% 6.2% 6.1% 6.1% 5.8% 3.6% 3.6% 2.0% 1.9% 1.6% 0.4% -0.1% -0.4% -25.7% -30% -20% -10% 0% 10% 20% 30% Hungary CzechRepublic Serbia Poland Belarus Italy Slovakia Germany Russia Switzerland Netherlands Croatia UK Denmark Europeanaverage Turkey Belgium Spain Bulgaria Greece Ireland Romania France Finland Sweden Norway Austria Slovenia Online classifieds & directories growth in 2016 by market
  • 28.
    19 markets sawdouble-digit growth in paid-for-search 44.9% 42.9% 36.1% 28.0% 25.1% 21.4% 21.0% 20.8% 20.7% 20.1% 19.2% 19.2% 16.0% 15.0% 14.4% 12.9% 12.4% 12.2% 12.0% 10.1% 9.0% 8.0% 7.6% 7.3% 6.5% 6.4% 5.0% 4.3% 0% 5% 10% 15% 20% 25% 30% 35% 40% 45% 50% Slovenia Belarus Sweden Romania Ireland Russia Hungary Switzerland Spain Turkey Norway CzechRepublic Croatia Serbia UK Europeanaverage Slovakia Netherlands Greece Denmark Poland Austria Belgium Bulgaria Finland Italy Germany France Search growth in 2016 by market
  • 29.
    Mobile shares offormat leap by nearly10 percentage points year-on-year 26.8% 23.9% 24.7% 36.0% 32.2% 33.3% 0% 5% 10% 15% 20% 25% 30% 35% 40% Mobile share of display Mobile share of search Mobile share of total Mobile share of online ad spend by format* 2015 2016 *only markets which reported both mobile display & mobile search considered
  • 30.
    A €3bn market,video now is a vital component of online display… 29.9% 27.8% 27.1% 26.7% 24.6% 23.9% 22.1% 21.5% 21.4% 19.7% 18.9% 18.5% 18.5% 16.8% 16.0% 15.6% 15.9% 14.5% 13.9% 12.7% 11.8% 11.7% 11.5% 9.4% 9.0% 7.5% 3.1% 0% 5% 10% 15% 20% 25% 30% 35% Italy Switzerland Belgium Bulgaria Croatia Ireland Sweden CzechRepublic Spain France Germany Europeanaverage Netherlands Turkey UK Austria Finland Greece Russia Slovenia Poland Denmark Belarus Norway Serbia Hungary Romania Video share of online display in 2016 Total: €2.9bn
  • 31.
    …and growth isnear universally double-digit within 3 clusters 122.0% 102.6% 100.0% 91.8% 80.0% 48.0% 46.0% 33.6% 27.6% 26.8% 26.3% 26.0% 25.0% 24.6% 21.4% 19.6% 19.4% 17.4% 16.5% 15.2% 13.9% 13.9% 11.9% 11.7% 11.0% 10.4% 1.2% 0% 20% 40% 60% 80% 100% 120% 140% Slovenia Serbia Belarus Ireland Croatia Denmark Italy Turkey Spain Sweden Austria Netherlands Belgium Romania E.average Bulgaria Germany Finland CzechRepublic Russia Norway Switzerland UK France Greece Hungary Poland Online video advertising growth in 2016 growth leaders +/- 10ppt range of average challengers
  • 32.
    Mobile display ishighly concentrated, but 14 out of 22 countries measured grew faster than the market leader* 2,645 677 606 258 178 168 139 129 124 107 100 66 51 49 39 25 24 5 4 1.4 0.9 0.5 0 500 1,000 1,500 2,000 2,500 3,000 UK Italy Norway Netherlands Turkey Ireland CzechRepublic Denmark Austria Romania Croatia Mobile display advertising 2016 (€bn) 327.0% 191.3% 156.3% 107.7% 95.0% 89.5% 86.6% 85.1% 79.7% 72.6% 66.7% 64.4% 52.9% 51.9% 51.6% 45.3% 37.3% 36.7% 34.7% 33.4% 30.9% 26.6% 26.5% 0% 50% 100% 150% 200% 250% 300% 350% Serbia Romania Turkey France Croatia Ireland Russia Bulgaria CzechRepublic Hungary Belarus Poland Europeanaverage Denmark Italy UK Sweden Austria Netherlands Finland Spain Norway Germany Mobile display advertising growth in 2016 *5 countries did not report mobile display
  • 33.
    0 500 1,000 1,500 2,000 2,500 3,000 UK France Italy Germany Norway Sweden Netherlands Russia Turkey Poland Top mobile display +2ranks vs all display Market leaders are not created equal: the top 10 ranking by display market size looks different in mobile and video 0 100 200 300 400 500 600 700 800 900 UK Italy Germany France Spain Belgium Netherlands Sweden Russia CzechRepublic Top video 0 1,000 2,000 3,000 4,000 5,000 6,000 UK Germany France Italy Spain Russia Netherlands Sweden Belgium Poland Top all display Only in mobile Only in mobile +1 rank vs all display -2 ranks vs all display +1 rank vs all display Only in video -3 ranks vs all display +2 ranks vs all display +3 ranks vs all display Not in top mobile Not in top video Not in top mobile
  • 34.
    Desktop banner isdecline as video and mobile power growth -35% -25% -15% -5% 5% 15% 25% 35% 45% Ireland Slovenia Romania Slovakia Bulgaria CzechRepublic Hungary Spain Croatia Russia Austria Serbia Poland UK France Europeanaverage Sweden Italy Netherlands Greece Turkey Denmark Finland Germany Belgium Switzerland Norway Belarus Display growth composition in 2016 all display
  • 35.
    Desktop banner isdecline as video and mobile power growth -35% -25% -15% -5% 5% 15% 25% 35% 45% Ireland Slovenia Romania Slovakia Bulgaria CzechRepublic Hungary Spain Croatia Russia Austria Serbia Poland UK France Europeanaverage Sweden Italy Netherlands Greece Turkey Denmark Finland Germany Belgium Switzerland Norway Belarus Display growth composition in 2016 all display excl. mobile
  • 36.
    Desktop banner isdecline as video and mobile power growth -35% -25% -15% -5% 5% 15% 25% 35% 45% Ireland Slovenia Romania Slovakia Bulgaria CzechRepublic Hungary Spain Croatia Russia Austria Serbia Poland UK France Europeanaverage Sweden Italy Netherlands Greece Turkey Denmark Finland Germany Belgium Switzerland Norway Belarus Display growth composition in 2016 all display excl. mobile excl. mobile & video
  • 37.
    Outlook for 2017 •Expect approximately +10% growth over 2016 • Concentration of growth among fewer players will accelerate • Video will become the primary battleground for consumer attention • Live video set to focus on sports and UGC • E-Sports advertising is gaining traction • Audio is increasingly attractive to marketers • Mobile-first becomes AI-first (but promise & practice are far apart) • Regulation will have a material impact on the future health of the market
  • 38.
    Contact: Alison Fennah –fennah@iabeurope.eu Marie-Clare Puffett – puffett@iabeurope.eu Daniel Knapp – daniel.knapp@ihsmarkit.com Qingzhen (Jessie) Chen – jessie.chen@ihsmarkit.com Connect with us: @IABEurope IAB Europe www.iabeurope.eu www.technology.ihs.com @IHS4Tech

Editor's Notes

  • #9 Double dip Stabilisation Slight slowdown in 2016 but still solid
  • #10 In this macro…consumer shifts, data, mobile, video. Not linear consumption/spend
  • #11 But despite macro-turmoil, no year in which online ad declined. 10 year history of adex. Rewind to understand significance of numbers. Would be This is size of entire tv ad market today. Like-for-like. More markets have been added, but we have retropolated growth. Online ad moved from afterthought in media buying to a pivotal set of channels for reaching and engaging consumers.