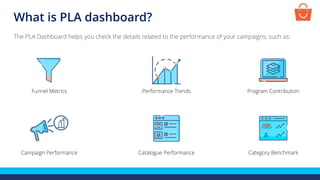
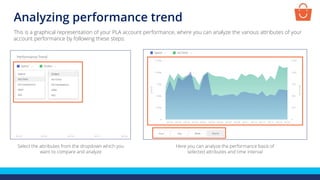
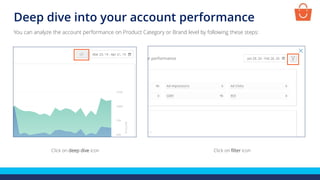
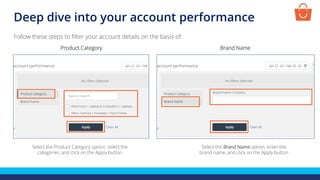
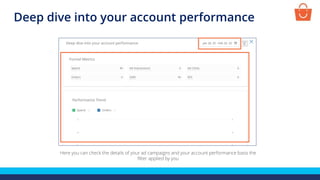
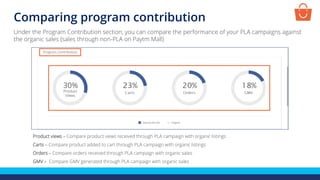
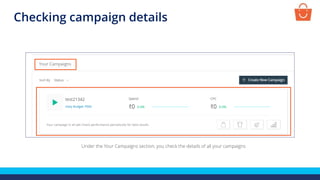
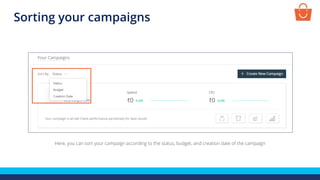
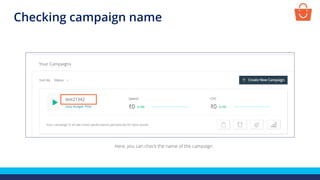
Understanding The
Product Listing Ads
Dashboard
What is PLA dashboard?
The PLA Dashboard helps you check the details related to the performance of your campaigns, such as:
Funnel Metrics Performance Trends Program Contribution
Catalogue PerformanceCampaign Performance Category Benchmark
Checking PLA dashboard
To check your PLA dashboard, login to the Paytm Mall seller panel and follow these steps -
Click on PLA Dashboard
Selecting the date range
Select the date range for which you want to check the details of your ad
campaigns and your PLA account performance
Funnel Metrics
Understanding funnel metrics
In the Funnel Metrics section, you can check your overall account
performance for the selected time period such as:
Spend- Total amount spent from your PLA wallet
Ad impressions- Number of times your product ad is displayed to the
customers
Ad Clicks- Number of clicks your product ads have received
Orders- Total number of received orders
GMV- Total revenue generated through product ads.
ROI- Total ROI achieved
The Orders and GMV are attributed over a 14 day period. This means
that if a customer clicks on a PLA ad and buys the product within the
next 14 days, then that order and GMV is attributed to the PLA ad.
Performance Trend
Analyzing performance trend
This is a graphical representation of your PLA account performance, where you can analyze the various attributes of your
account performance by following these steps:
Select the attributes from the dropdown which you
want to compare and analyze
Here you can analyze the performance basis of
selected attributes and time interval
Deep dive into your account performance
Click on deep dive icon
You can analyze the account performance on Product Category or Brand level by following these steps:
Click on filter icon
Deep dive into your account performance
Select the Product Category option, select the
categories, and click on the Apply button
Follow these steps to filter your account details on the basis of:
Select the Brand Name option, enter the
brand name, and click on the Apply button
Product Category Brand Name
Deep dive into your account performance
Here you can check the details of your ad campaigns and your account performance basis the
filter applied by you
Program Contribution
Comparing program contribution
Product views – Compare product views received through PLA campaign with organic listings
Carts – Compare product added to cart through PLA campaign with organic listings
Orders – Compare orders received through PLA campaign with organic sales
GMV – Compare GMV generated through PLA campaign with organic sales
Under the Program Contribution section, you can compare the performance of your PLA campaigns against
the organic sales (sales through non-PLA on Paytm Mall)
Campaign Performance
Checking campaign details
Under the Your Campaigns section, you check the details of all your campaigns
Sorting your campaigns
Here, you can sort your campaign according to the status, budget, and creation date of the campaign
Checking campaign name
Here, you can check the name of the campaign
Checking campaign status
This icon means your campaign is active.
If you want to pause the campaign, you can do so by
clicking on this icon
Here, you can check the status of a campaign - whether it is active or paused
This icon means your campaign is paused.
If you want to relaunch the campaign, you can do so
by clicking on this icon
Checking campaign daily budget details
Here, you can check the daily budget for a
particular campaign
Here, you can check the total amount spent till date
on a particular campaign
Analyzing campaign performance
Here, you can check the total CPC charged/ROI achieved till date (based on the bid you set for
the campaign)
Analyzing campaign performance
Here, you can check the performance of a particular campaign
Analyzing campaign performance
Here, you can check the campaign
performance for a selected date
range via graphical representation
Analyzing campaign performance
Here, you can see the campaign performance metrics according to the categories,
brands, and products
Updating campaign details
This notification shows that you can make some changes
in your campaign to improve its performance
This notification shows some important parameters which
you can change to improve your campaign performance.
You can check the same by clicking on View Suggestion
Updating campaign details
You can implement the suggestion prompts marked in red-colored font to improve your
campaigns performance. The green-colored font means that no change is required
You will get a window suggesting the ways to improve the performance for the selected campaign -
Updating campaign details
Here, you can update the budget details, exclusion of products and bidding rate
Catalogue Performance
Understanding product wise performance
To view product-level details, click on the Products tab
Under the Catalog Performance section, you can view the product-level and category-level details of
your PLA campaigns
Understanding category wise performance
To view category-level details, click on the Categories tab
Downloading SKU analytics report
Click here to download these details in Excel format
Understanding SKU analytics report
Sample of an SKU analytics report
Category Benchmark
Understanding Category Benchmark
Overall Score:
It is your overall competitive score as compared to the other Paytm Mall sellers who all are dealing in the same product category
Benefits of higher score:
• Improves your online visibility
• Help you attract potential customers
• Boost sales of your product
• Increase revenue in your business
Category benchmark helps you to compare your PLA campaign performance against the performance of other sellers who
are also selling the same products on the Paytm Mall platform
Understanding Category Benchmark
Average Daily Budget
An average daily budget of all your PLA
campaigns
Learn More
Here, the system will recommend in
case of enhancements required to set a
daily budget
You/Industry
Here, you can compare your average
daily budget with your competitors
Discounted Product Percentage
The percentage of products in your
catalogue with a discounted price
Learn More
Here, the system will recommend in
case of enhancements required to set a
competitive price to attract buyers
You & Industry
Here, you can compare your discounted
product percentage with your
competitors dealing in the same product
category
Avg Views per SKU
An average view of all your products in
the PLA campaign
Learn More
Here, the system will recommend in
case of enhancements required to
improve your visibility
Industry
Here, you can compare your average
view per product with your competitors
Understanding Category Benchmark
Average Product Price
The average selling price of the product
in your catalogue
Learn More
Here, the system will recommend in
case of enhancements required to set a
competitive price
You and Industry
Here, you can compare your average
product price with your competitors
dealing in the same product category
Avg Conversion Rate
It is the ratio of your average product
views to your sales (number of orders)
Learn More
Here, the system will recommend in
case of enhancements required to
increase your revenue
You and Industry
Here, you can compare your average
conversion rate with your competitors
dealing in the same product category
Avg Discount %
The average discount you are offering to
your customers
Learn More
Here, the system will recommend you in
case of enhancements required to set
the competitive prices so that your
customer can get a better discount on
your products
You and Industry
Here, you can compare your average
discount offered with your competitors
Thanks everyone!
For any query, please raise a ticket using the Support tab on
your seller panel.

PLA - Dashboard

  • 1.
  • 2.
    What is PLAdashboard? The PLA Dashboard helps you check the details related to the performance of your campaigns, such as: Funnel Metrics Performance Trends Program Contribution Catalogue PerformanceCampaign Performance Category Benchmark
  • 3.
    Checking PLA dashboard Tocheck your PLA dashboard, login to the Paytm Mall seller panel and follow these steps - Click on PLA Dashboard
  • 4.
    Selecting the daterange Select the date range for which you want to check the details of your ad campaigns and your PLA account performance
  • 5.
  • 6.
    Understanding funnel metrics Inthe Funnel Metrics section, you can check your overall account performance for the selected time period such as: Spend- Total amount spent from your PLA wallet Ad impressions- Number of times your product ad is displayed to the customers Ad Clicks- Number of clicks your product ads have received Orders- Total number of received orders GMV- Total revenue generated through product ads. ROI- Total ROI achieved The Orders and GMV are attributed over a 14 day period. This means that if a customer clicks on a PLA ad and buys the product within the next 14 days, then that order and GMV is attributed to the PLA ad.
  • 7.
  • 8.
    Analyzing performance trend Thisis a graphical representation of your PLA account performance, where you can analyze the various attributes of your account performance by following these steps: Select the attributes from the dropdown which you want to compare and analyze Here you can analyze the performance basis of selected attributes and time interval
  • 9.
    Deep dive intoyour account performance Click on deep dive icon You can analyze the account performance on Product Category or Brand level by following these steps: Click on filter icon
  • 10.
    Deep dive intoyour account performance Select the Product Category option, select the categories, and click on the Apply button Follow these steps to filter your account details on the basis of: Select the Brand Name option, enter the brand name, and click on the Apply button Product Category Brand Name
  • 11.
    Deep dive intoyour account performance Here you can check the details of your ad campaigns and your account performance basis the filter applied by you
  • 12.
  • 13.
    Comparing program contribution Productviews – Compare product views received through PLA campaign with organic listings Carts – Compare product added to cart through PLA campaign with organic listings Orders – Compare orders received through PLA campaign with organic sales GMV – Compare GMV generated through PLA campaign with organic sales Under the Program Contribution section, you can compare the performance of your PLA campaigns against the organic sales (sales through non-PLA on Paytm Mall)
  • 14.
  • 15.
    Checking campaign details Underthe Your Campaigns section, you check the details of all your campaigns
  • 16.
    Sorting your campaigns Here,you can sort your campaign according to the status, budget, and creation date of the campaign
  • 17.
    Checking campaign name Here,you can check the name of the campaign
  • 18.
    Checking campaign status Thisicon means your campaign is active. If you want to pause the campaign, you can do so by clicking on this icon Here, you can check the status of a campaign - whether it is active or paused This icon means your campaign is paused. If you want to relaunch the campaign, you can do so by clicking on this icon
  • 19.
    Checking campaign dailybudget details Here, you can check the daily budget for a particular campaign Here, you can check the total amount spent till date on a particular campaign
  • 20.
    Analyzing campaign performance Here,you can check the total CPC charged/ROI achieved till date (based on the bid you set for the campaign)
  • 21.
    Analyzing campaign performance Here,you can check the performance of a particular campaign
  • 22.
    Analyzing campaign performance Here,you can check the campaign performance for a selected date range via graphical representation
  • 23.
    Analyzing campaign performance Here,you can see the campaign performance metrics according to the categories, brands, and products
  • 24.
    Updating campaign details Thisnotification shows that you can make some changes in your campaign to improve its performance This notification shows some important parameters which you can change to improve your campaign performance. You can check the same by clicking on View Suggestion
  • 25.
    Updating campaign details Youcan implement the suggestion prompts marked in red-colored font to improve your campaigns performance. The green-colored font means that no change is required You will get a window suggesting the ways to improve the performance for the selected campaign -
  • 26.
    Updating campaign details Here,you can update the budget details, exclusion of products and bidding rate
  • 27.
  • 28.
    Understanding product wiseperformance To view product-level details, click on the Products tab Under the Catalog Performance section, you can view the product-level and category-level details of your PLA campaigns
  • 29.
    Understanding category wiseperformance To view category-level details, click on the Categories tab
  • 30.
    Downloading SKU analyticsreport Click here to download these details in Excel format
  • 31.
    Understanding SKU analyticsreport Sample of an SKU analytics report
  • 32.
  • 33.
    Understanding Category Benchmark OverallScore: It is your overall competitive score as compared to the other Paytm Mall sellers who all are dealing in the same product category Benefits of higher score: • Improves your online visibility • Help you attract potential customers • Boost sales of your product • Increase revenue in your business Category benchmark helps you to compare your PLA campaign performance against the performance of other sellers who are also selling the same products on the Paytm Mall platform
  • 34.
    Understanding Category Benchmark AverageDaily Budget An average daily budget of all your PLA campaigns Learn More Here, the system will recommend in case of enhancements required to set a daily budget You/Industry Here, you can compare your average daily budget with your competitors Discounted Product Percentage The percentage of products in your catalogue with a discounted price Learn More Here, the system will recommend in case of enhancements required to set a competitive price to attract buyers You & Industry Here, you can compare your discounted product percentage with your competitors dealing in the same product category Avg Views per SKU An average view of all your products in the PLA campaign Learn More Here, the system will recommend in case of enhancements required to improve your visibility Industry Here, you can compare your average view per product with your competitors
  • 35.
    Understanding Category Benchmark AverageProduct Price The average selling price of the product in your catalogue Learn More Here, the system will recommend in case of enhancements required to set a competitive price You and Industry Here, you can compare your average product price with your competitors dealing in the same product category Avg Conversion Rate It is the ratio of your average product views to your sales (number of orders) Learn More Here, the system will recommend in case of enhancements required to increase your revenue You and Industry Here, you can compare your average conversion rate with your competitors dealing in the same product category Avg Discount % The average discount you are offering to your customers Learn More Here, the system will recommend you in case of enhancements required to set the competitive prices so that your customer can get a better discount on your products You and Industry Here, you can compare your average discount offered with your competitors
  • 36.
    Thanks everyone! For anyquery, please raise a ticket using the Support tab on your seller panel.