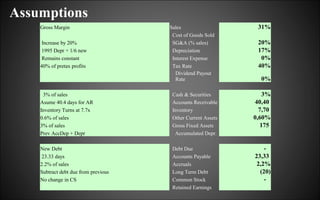
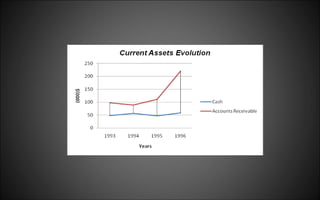
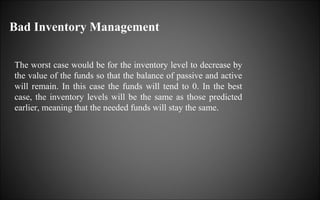
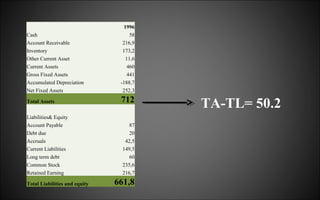
The Topeka Adhesives

Nino Burnadze
Ekaterine Khaburzania
Nino Bazhunaishvili
07.12.2013
The issues that Topeka faces:
•Financing methods for the upcoming 3-4 years: what method
to use in order to cover upcoming forecasted growth
•Improving the companies accounts receivable;
•Make forecasts and see if the short-term growth of the
company is sustainable
Assumptions
Gross Margin
Increase by 20%
1995 Depr + 1/6 new
Remains constant
40% of pretax profits

Sales
Cost of Goods Sold
SG&A (% sales)
Depreciation
Interest Expense
Tax Rate
Dividend Payout
Rate

31%
20%
17%
0%
40%
0%

3% of sales
Asume 40.4 days for AR
Inventory Turns at 7.7x
0.6% of sales
3% of sales
Prev AccDep + Depr

Cash & Securities
Accounts Receivable
Inventory
Other Current Assets
Gross Fixed Assets
Accumulated Depr.

3%
40,40
7,70
0,60%
175

New Debt
23.33 days
2.2% of sales
Subtract debt due from previous
No change in CS

Debt Due
Accounts Payable
Accruals
Long Term Debt
Common Stock
Retained Earnings

23,33
2,2%
(20)
-
Pro Forma Income Statement
1993
Sales
Cost of Goods Sold

1994

1995

1 347,0 1 448,0 1 546,5
956,4 1 010,7 1 076,4

1996

1997

1998

1 933,1 2609,7 3131,6
1 333,8 1 800,7 2 160,8

Gross Profit
Selling, General & Admin.
Depreciation

390,6
323,3
29,6

437,3
350,4
31,9

470,1
368,1
34,0

599,3
441,7
63,2

809,0
530,1
63,2

971,0
636,1
63,2

EBIT
Interest Expense (Income)

37,7
14,0

55,0
12,0

68,0
10,0

94,4
8,0

215,8
6,0

271,8
4,0

Earnings before Taxes
Taxes

23,7
9,5

43,0
17,2

58,0
23,2

86,4
34,5

209,8
83,9

267,8
107,1

Net Income

14,2

25,8

34,8

51,8

125,9

160,7
Average Collection Periods
Percentage
%

Days

%

Weighte
Days
d
0,2
40
32,0
0,1
55
46,0

0,4
ACP30
0,8
30
0,6
ACP45
0,9
45
40,4
40% ACP30 = .80 (30) + .20 (40) = 32 days
60% ACP45 = .90 (45) + .10 (55) = 46 days
The "overall ACP" equals .40(32) + .60(46) = 40.4 days .

Level of A/R = 216.9
Level of A/P= 86.4
Cash Vs Retained Earnings
Retained Earnings do not represent surplus of cash
or cash left over after the dividends payments.
Retained Earnings demonstrate what company did
with its profits; they are the amount of profit the
company has reinvested in business since its
inception.
Bad Inventory Management
The worst case would be for the inventory level to decrease by
the value of the funds so that the balance of passive and active
will remain. In this case the funds will tend to 0. In the best
case, the inventory levels will be the same as those predicted
earlier, meaning that the needed funds will stay the same.
Cash
Account Receivable
Inventory
Other Current Asset
Current Assets
Gross Fixed Assets
Accumulated Depreciation
Net Fixed Assets

1996
58
216,9
173,2
11,6
460
441
-188,7
252,3

Total Assets

712

Liabilities& Equity
Account Payable
Debt due
Accruals
Current Liabilities
Long term debt
Common Stock
Retained Earning

87
20
42,5
149,5
60
235,6
216,7

Total Liabilities and equity

661,8

TA-TL= 50.2
Funds Needed Vs Percentage Sales Method

Comparing two results the 97 value generate by the percentage of sales
method is higher that the initial value for funds of 50.22. The difference
comes from the fact that the percentage of sales method brings in the sales
figures for the current year as being in relation with the previous year’s
sales figure. Also the percentage of sales method is a method of estimating
cash requirements by expressing revenues and expenses as percentages of
sales, and using these percentages to construct a pro forma income
statement.
Cash Flow
1996
EBIT
less Taxes on EBIT
add Depreciation
Working Capital:
Receivables
Inventory
less Accounts Payable
less Accurals
Adjusted Working Capital
less Change in AWC
less Capital Spending
Free Cash Flow
Dividends
less: Dividends
less: Interest (1-tax rate)
add: New Equity
add: Net Debt

Total Cash Generated

1997

1998

94
(38)
63

216
(86)
63

272
(109)
63

217
173
(86)
(43)
261
261
(175)

293
234
(117)
(57)
353
91

351
281
(140)
(69)
423
71

(316)

101

156

(20)

(20)

(20)

(336)

81

136

If free cash flow is
negative, it could be a sign
that a company is making
large investments. If these
investments earn a high
return, the strategy has the
potential to pay off in the
long run.
Recommendations:
•Debt financing
•Although company officials think that the net 30 term is better,
which is actually true from an economic point of view, the net 45 is
better if it justifies not losing the sale
•To take discounts from suppliers, which is the additional saving of
money for the company
 case 12 ( the topeka Adhesives)

case 12 ( the topeka Adhesives)

  • 1.
    The Topeka Adhesives NinoBurnadze Ekaterine Khaburzania Nino Bazhunaishvili 07.12.2013
  • 2.
    The issues thatTopeka faces: •Financing methods for the upcoming 3-4 years: what method to use in order to cover upcoming forecasted growth •Improving the companies accounts receivable; •Make forecasts and see if the short-term growth of the company is sustainable
  • 3.
    Assumptions Gross Margin Increase by20% 1995 Depr + 1/6 new Remains constant 40% of pretax profits Sales Cost of Goods Sold SG&A (% sales) Depreciation Interest Expense Tax Rate Dividend Payout Rate 31% 20% 17% 0% 40% 0% 3% of sales Asume 40.4 days for AR Inventory Turns at 7.7x 0.6% of sales 3% of sales Prev AccDep + Depr Cash & Securities Accounts Receivable Inventory Other Current Assets Gross Fixed Assets Accumulated Depr. 3% 40,40 7,70 0,60% 175 New Debt 23.33 days 2.2% of sales Subtract debt due from previous No change in CS Debt Due Accounts Payable Accruals Long Term Debt Common Stock Retained Earnings 23,33 2,2% (20) -
  • 4.
    Pro Forma IncomeStatement 1993 Sales Cost of Goods Sold 1994 1995 1 347,0 1 448,0 1 546,5 956,4 1 010,7 1 076,4 1996 1997 1998 1 933,1 2609,7 3131,6 1 333,8 1 800,7 2 160,8 Gross Profit Selling, General & Admin. Depreciation 390,6 323,3 29,6 437,3 350,4 31,9 470,1 368,1 34,0 599,3 441,7 63,2 809,0 530,1 63,2 971,0 636,1 63,2 EBIT Interest Expense (Income) 37,7 14,0 55,0 12,0 68,0 10,0 94,4 8,0 215,8 6,0 271,8 4,0 Earnings before Taxes Taxes 23,7 9,5 43,0 17,2 58,0 23,2 86,4 34,5 209,8 83,9 267,8 107,1 Net Income 14,2 25,8 34,8 51,8 125,9 160,7
  • 7.
    Average Collection Periods Percentage % Days % Weighte Days d 0,2 40 32,0 0,1 55 46,0 0,4 ACP30 0,8 30 0,6 ACP45 0,9 45 40,4 40%ACP30 = .80 (30) + .20 (40) = 32 days 60% ACP45 = .90 (45) + .10 (55) = 46 days The "overall ACP" equals .40(32) + .60(46) = 40.4 days . Level of A/R = 216.9 Level of A/P= 86.4
  • 8.
    Cash Vs RetainedEarnings Retained Earnings do not represent surplus of cash or cash left over after the dividends payments. Retained Earnings demonstrate what company did with its profits; they are the amount of profit the company has reinvested in business since its inception.
  • 9.
    Bad Inventory Management Theworst case would be for the inventory level to decrease by the value of the funds so that the balance of passive and active will remain. In this case the funds will tend to 0. In the best case, the inventory levels will be the same as those predicted earlier, meaning that the needed funds will stay the same.
  • 10.
    Cash Account Receivable Inventory Other CurrentAsset Current Assets Gross Fixed Assets Accumulated Depreciation Net Fixed Assets 1996 58 216,9 173,2 11,6 460 441 -188,7 252,3 Total Assets 712 Liabilities& Equity Account Payable Debt due Accruals Current Liabilities Long term debt Common Stock Retained Earning 87 20 42,5 149,5 60 235,6 216,7 Total Liabilities and equity 661,8 TA-TL= 50.2
  • 11.
    Funds Needed VsPercentage Sales Method Comparing two results the 97 value generate by the percentage of sales method is higher that the initial value for funds of 50.22. The difference comes from the fact that the percentage of sales method brings in the sales figures for the current year as being in relation with the previous year’s sales figure. Also the percentage of sales method is a method of estimating cash requirements by expressing revenues and expenses as percentages of sales, and using these percentages to construct a pro forma income statement.
  • 12.
    Cash Flow 1996 EBIT less Taxeson EBIT add Depreciation Working Capital: Receivables Inventory less Accounts Payable less Accurals Adjusted Working Capital less Change in AWC less Capital Spending Free Cash Flow Dividends less: Dividends less: Interest (1-tax rate) add: New Equity add: Net Debt Total Cash Generated 1997 1998 94 (38) 63 216 (86) 63 272 (109) 63 217 173 (86) (43) 261 261 (175) 293 234 (117) (57) 353 91 351 281 (140) (69) 423 71 (316) 101 156 (20) (20) (20) (336) 81 136 If free cash flow is negative, it could be a sign that a company is making large investments. If these investments earn a high return, the strategy has the potential to pay off in the long run.
  • 13.
    Recommendations: •Debt financing •Although companyofficials think that the net 30 term is better, which is actually true from an economic point of view, the net 45 is better if it justifies not losing the sale •To take discounts from suppliers, which is the additional saving of money for the company