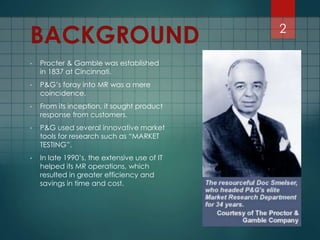
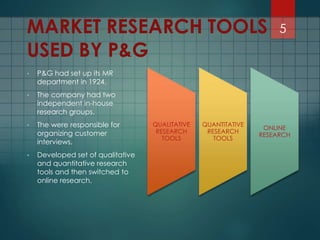
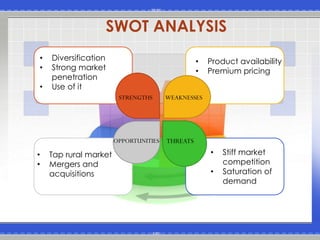
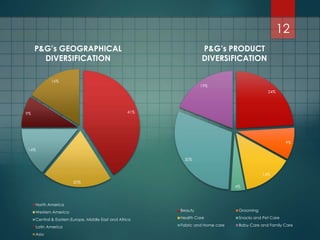
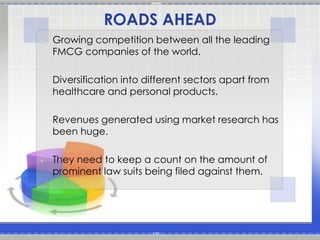
MARKET
RESEARCH
AT P&G
-THE ART OF UNDERSTANDING THE MARKET
BY DEV CHANDAN
1
BACKGROUND
• Procter & Gamble was established
in 1837 at Cincinnati.
• P&G’s foray into MR was a mere
coincidence.
• From its inception, it sought product
response from customers.
• P&G used several innovative market
tools for research such as “MARKET
TESTING”.
• In late 1990’s, the extensive use of IT
helped its MR operations, which
resulted in greater efficiency and
savings in time and cost.
2
• Emphasis on PRODUCT.
• It emphasizes on quality, safety, investment in new
technology.
• Failed to understand the changing needs of their
customers.
3PRODUCT ORIENTED FIRMS
• Emphasis on MARKET.
• It organises its activities, products and services.
• Focusses on wants and needs of its customers.
4MARKET ORIENTED FIRMS
MARKET RESEARCH TOOLS
USED BY P&G
QUALITATIVE
RESEARCH
TOOLS
QUANTITATIVE
RESEARCH
TOOLS
ONLINE
RESEARCH
• P&G had set up its MR
department in 1924.
• The company had two
independent in-house
research groups.
• The were responsible for
organizing customer
interviews.
• Developed set of qualitative
and quantitative research
tools and then switched to
online research.
5
QUANITATIVE RESEARCH
ANALYSIS
• It refers to the systematic
investigation of social
phenomenon via statistical,
mathematical or numerical
data
• Helped in generating new
product ideas for P&G.
• The major tools used are:
• Blind tests
• Concept aided usage test
• Habits and Practices
• Quality monitoring
6
BLIND TESTS:
• Used whenever items are to be
compared without influences
from testers preferences or
expectations.
• Comparative testing of
commercial products to asses
user preference without being
influenced by branding.
CONCEPT AIDED USAGE TEST:
• To evaluate consumer response
before the introduction of the
product.
• Consumers were pre educated
about a product and then their
reactions are recorded.
7QUANITATIVE TOOLS
HABITS AND PRACTICES:
• To capture user’s unmet needs.
• It uses opportunity index scores
which identifies key areas of
unmet needs.
QUALITY MONITORING:
• To check whether the products
bought by the customers
actually met their needs and the
product design criteria.
8QUANITATIVE TOOLS
Bar Graph
Page Layout
9
Line Graph
Page Layout
0
5
10
15
Chart Title
Series 1 Series 2 Series 3
Here is the description of the
chart. You may change or
delete this text as you wish.
This chart is compatible with
PowerPoint 97 to 2007.
Here is a placeholder for
more text and description of
the chart. Changing this text
will not interfere with the
formatting of this template.
10
SWOT ANALYSIS
• Diversification
• Strong market
penetration
• Use of it
• Product availability
• Premium pricing
• Tap rural market
• Mergers and
acquisitions
• Stiff market
competition
• Saturation of
demand
STRENGTHS WEAKNESSES
OPPORTUNITIES THREATS
12
24%
9%
14%
4%
30%
19%
Beauty Grooming
Health Care Snacks and Pet Care
Fabric and Home care Baby Care and Family Care
41%
20%
14%
9%
16%
North America
Western America
Central & Eastern Europe, Middle East and Africa
Latin America
Asia
P&G’s GEOGRAPHICAL
DIVERSIFICATION
P&G’s PRODUCT
DIVERSIFICATION
• Growing competition between all the leading
FMCG companies of the world.
• Diversification into different sectors apart from
healthcare and personal products.
• Revenues generated using market research has
been huge.
• They need to keep a count on the amount of
prominent law suits being filed against them.
ROADS AHEAD
THANK YOU

Market Research at P&G.

  • 1.
    MARKET RESEARCH AT P&G -THE ARTOF UNDERSTANDING THE MARKET BY DEV CHANDAN 1
  • 2.
    BACKGROUND • Procter &Gamble was established in 1837 at Cincinnati. • P&G’s foray into MR was a mere coincidence. • From its inception, it sought product response from customers. • P&G used several innovative market tools for research such as “MARKET TESTING”. • In late 1990’s, the extensive use of IT helped its MR operations, which resulted in greater efficiency and savings in time and cost. 2
  • 3.
    • Emphasis onPRODUCT. • It emphasizes on quality, safety, investment in new technology. • Failed to understand the changing needs of their customers. 3PRODUCT ORIENTED FIRMS
  • 4.
    • Emphasis onMARKET. • It organises its activities, products and services. • Focusses on wants and needs of its customers. 4MARKET ORIENTED FIRMS
  • 5.
    MARKET RESEARCH TOOLS USEDBY P&G QUALITATIVE RESEARCH TOOLS QUANTITATIVE RESEARCH TOOLS ONLINE RESEARCH • P&G had set up its MR department in 1924. • The company had two independent in-house research groups. • The were responsible for organizing customer interviews. • Developed set of qualitative and quantitative research tools and then switched to online research. 5
  • 6.
    QUANITATIVE RESEARCH ANALYSIS • Itrefers to the systematic investigation of social phenomenon via statistical, mathematical or numerical data • Helped in generating new product ideas for P&G. • The major tools used are: • Blind tests • Concept aided usage test • Habits and Practices • Quality monitoring 6
  • 7.
    BLIND TESTS: • Usedwhenever items are to be compared without influences from testers preferences or expectations. • Comparative testing of commercial products to asses user preference without being influenced by branding. CONCEPT AIDED USAGE TEST: • To evaluate consumer response before the introduction of the product. • Consumers were pre educated about a product and then their reactions are recorded. 7QUANITATIVE TOOLS
  • 8.
    HABITS AND PRACTICES: •To capture user’s unmet needs. • It uses opportunity index scores which identifies key areas of unmet needs. QUALITY MONITORING: • To check whether the products bought by the customers actually met their needs and the product design criteria. 8QUANITATIVE TOOLS
  • 9.
  • 10.
    Line Graph Page Layout 0 5 10 15 ChartTitle Series 1 Series 2 Series 3 Here is the description of the chart. You may change or delete this text as you wish. This chart is compatible with PowerPoint 97 to 2007. Here is a placeholder for more text and description of the chart. Changing this text will not interfere with the formatting of this template. 10
  • 11.
    SWOT ANALYSIS • Diversification •Strong market penetration • Use of it • Product availability • Premium pricing • Tap rural market • Mergers and acquisitions • Stiff market competition • Saturation of demand STRENGTHS WEAKNESSES OPPORTUNITIES THREATS
  • 12.
    12 24% 9% 14% 4% 30% 19% Beauty Grooming Health CareSnacks and Pet Care Fabric and Home care Baby Care and Family Care 41% 20% 14% 9% 16% North America Western America Central & Eastern Europe, Middle East and Africa Latin America Asia P&G’s GEOGRAPHICAL DIVERSIFICATION P&G’s PRODUCT DIVERSIFICATION
  • 13.
    • Growing competitionbetween all the leading FMCG companies of the world. • Diversification into different sectors apart from healthcare and personal products. • Revenues generated using market research has been huge. • They need to keep a count on the amount of prominent law suits being filed against them. ROADS AHEAD
  • 14.