Downloaded 25 times

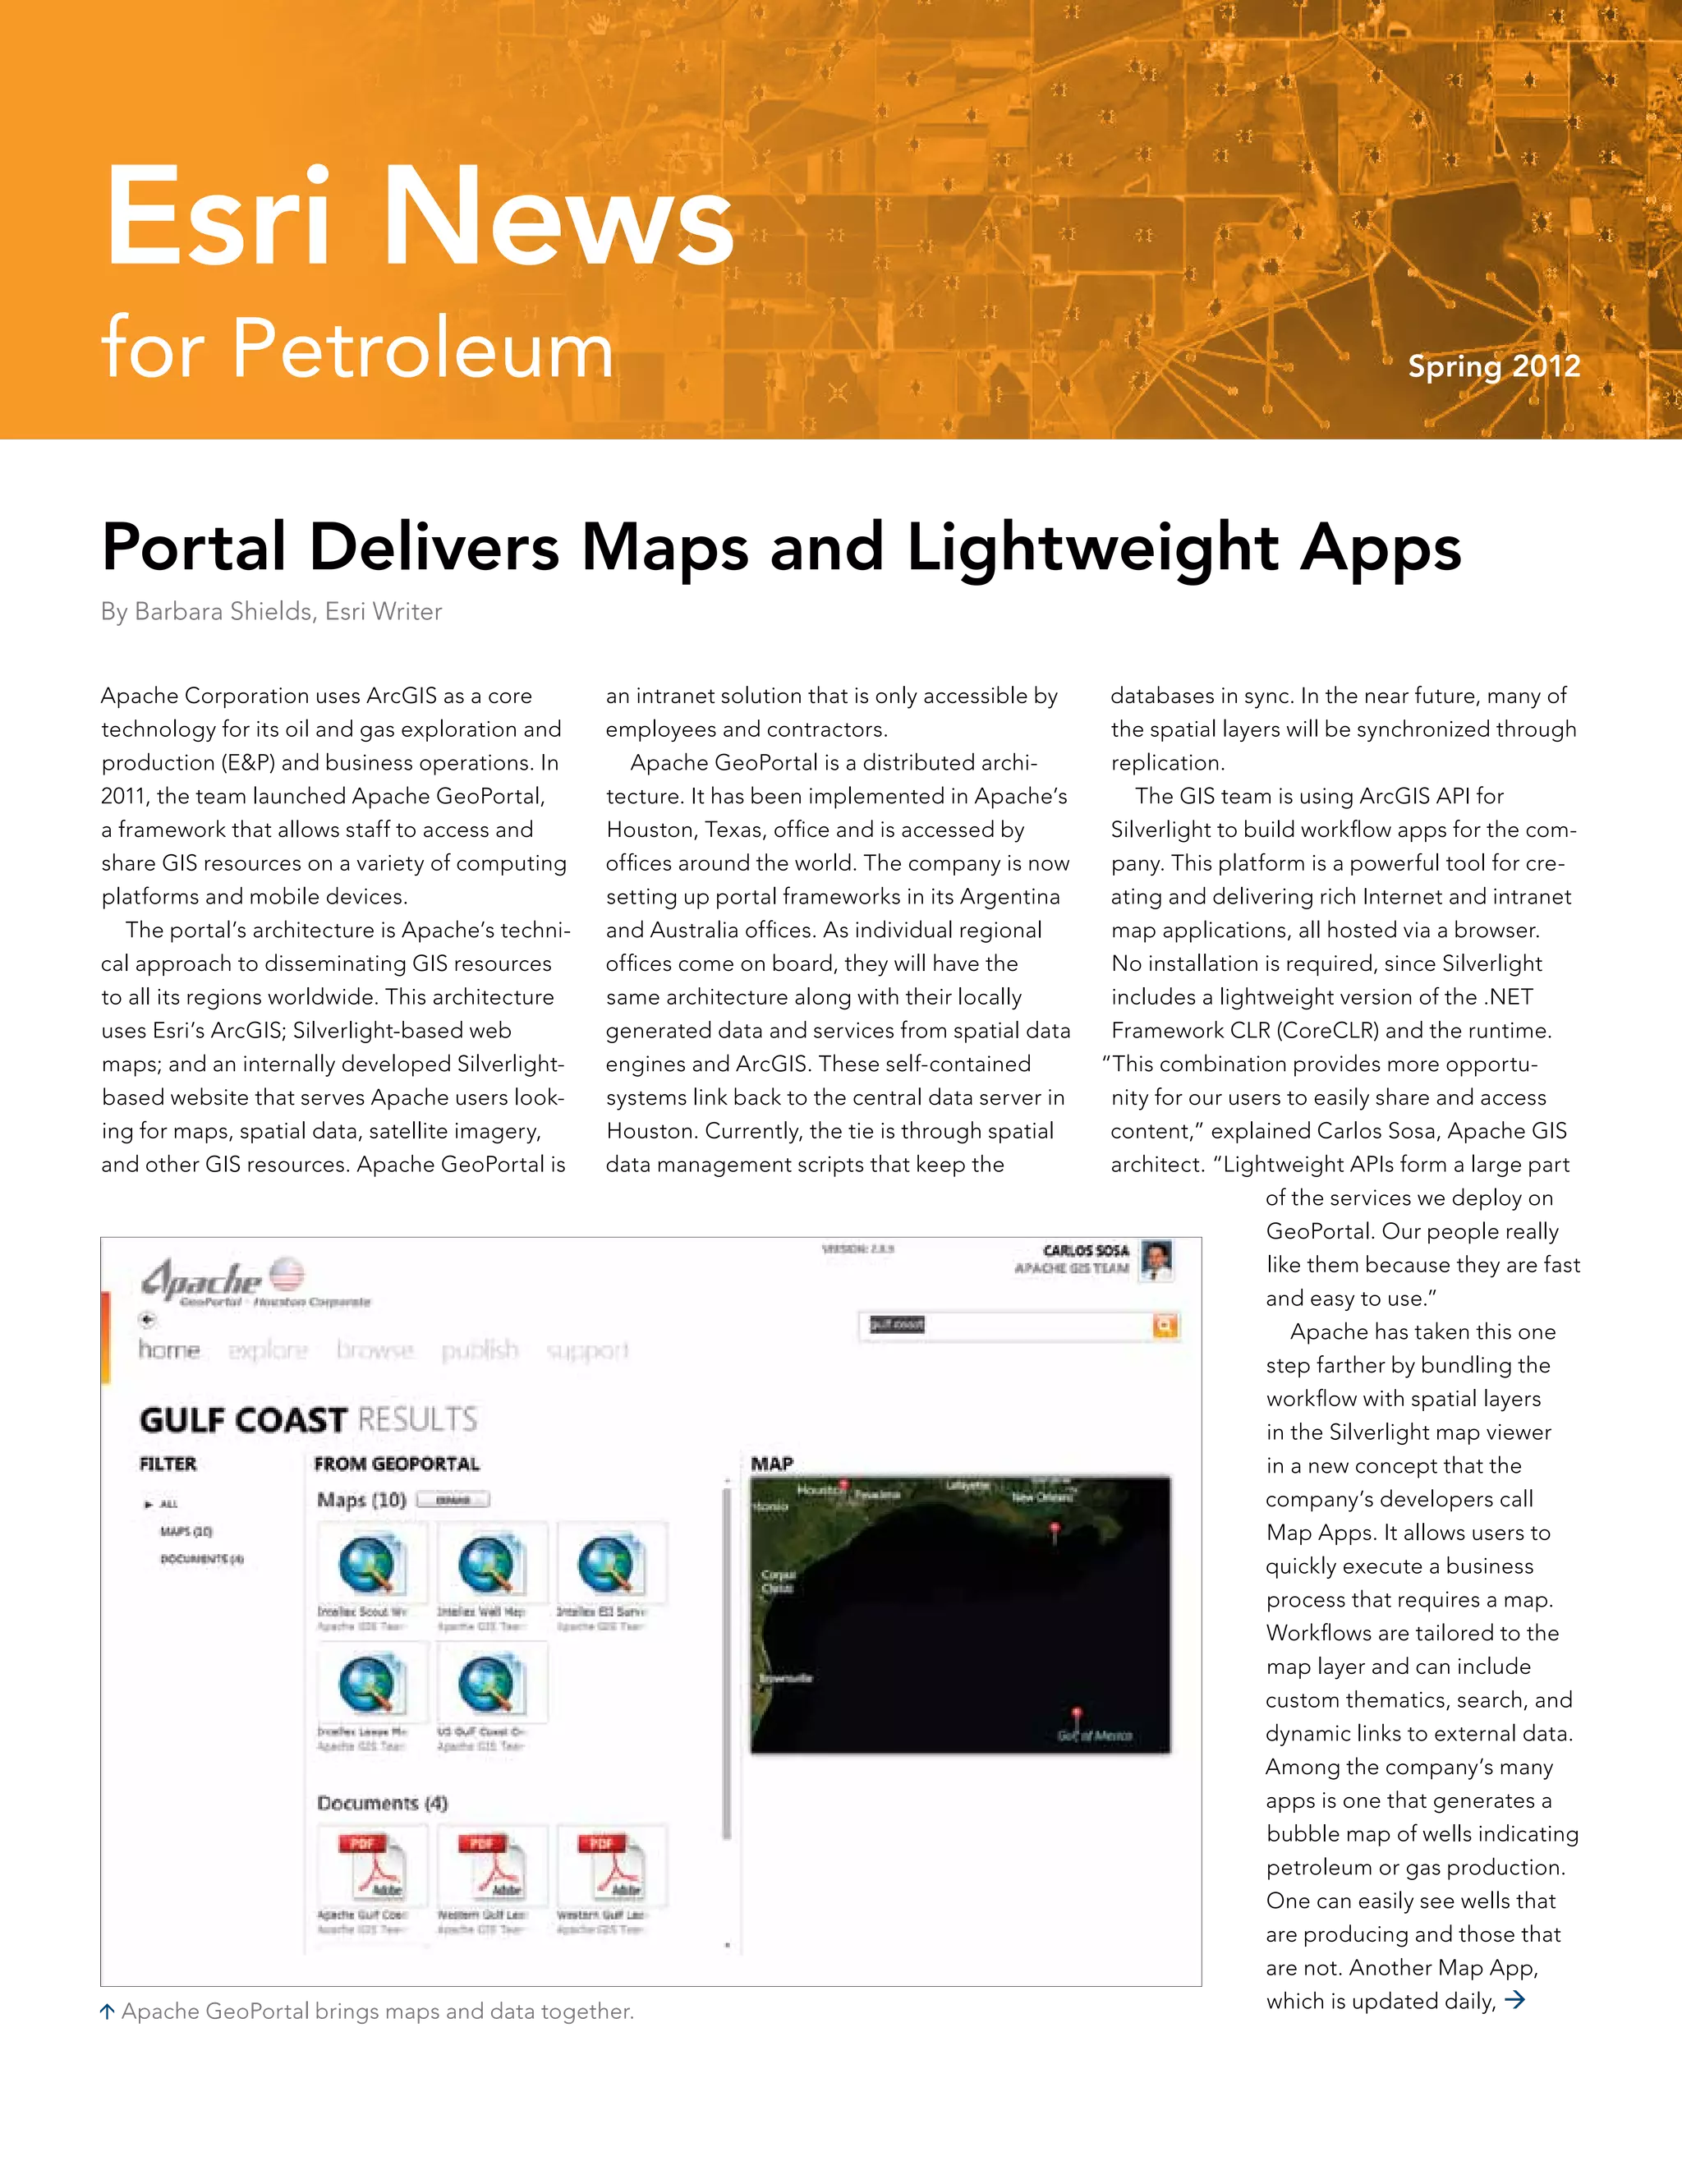
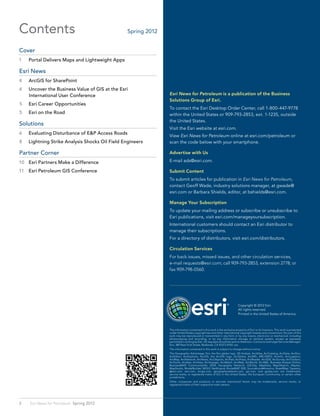
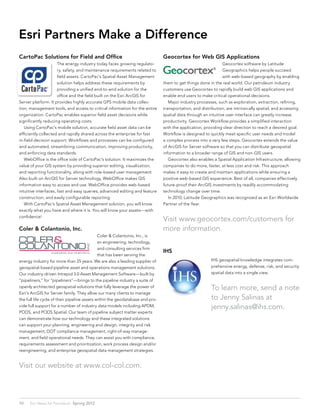
![Portal Delivers Maps and Lightweight Apps continued from page 1
shows permits to drill held by Apache and
its competitors, the target formation, and Apache GeoPortal
whether the well is horizontal or vertical. A
Map App designed for Apache’s land lease
group extracts data from a tabular database
and converts it into a map of Apache’s leased
areas. Lease analysts can use a search tool to Web Services
find a specific lease, compare its information
with other geographic data, and verify its
accuracy.
Users find the Map Apps they need by
using the robust search capability that ArcGIS
is built into the portal. They can search
Image Services Geoprocessing
for map applications using a keyword Map Services WMS Services
or geographic search or simply brows-
ing through the various categories
such as featured maps, types, and
departments. They must have con- Aerial and
nectivity to the internal-facing website Satellite Imagery Data Services
but do not need software installed
on the device. The experience of ac-
cessing Apache Map Apps is similar to
that of popular app stores. Users open
a browser from a desktop or mobile
device, log in to the system, go to the Map
App store, find the app needed, and apply it Geospatial
Database
to the mapping concept. In addition, users
can rate content and add comments.
“We could not have done this project five
Apache’s Enterprise GIS Architecture
years ago—maybe not even two years ago,”
explained Bruce Sanderson, Apache GIS team
manager. “We tried ArcIMS five years ago and
found it just didn’t have the horsepower or and documents, and resources such as infor-
scalability for what we wanted to do. Our next mation about training and upcoming events.
attempt was ArcGIS for Server using Web Users can publish content either individually
ADFs [Application Developer Frameworks], or as part of a team and can restrict access as
and still it was too slow and clunky. Esri needed.
technology began incorporating popular web Through the content socialization tools,
concepts into its services and pumped up its users rate the published items and help “When the lightweight
product performance in ArcGIS 10. Because promote the quality of the content being
Apache is committed to being on the edge of disseminated. Similar to social media sites,
ArcGIS APIs came out, we
technology, we kept our system up-to-date users can establish communities around this first went with Flex and
with these technology changes, and now our content, thus encouraging its use. Apache
enterprise GIS works the way we initially envi- GeoPortal and data are secured because the
then quickly changed to
sioned it. The system is scalable and can be entire system is behind the company’s firewall, Silverlight.”
used in the field on thin clients such as mobile and the server platform is accessible only
Bruce Sanderson,
workstations and ultrathin smartphones. through granted privileges and credentials.
Apache GIS Team Manager
When the lightweight ArcGIS APIs came Nothing is accessible outside the firewall.
out, we first went with Flex and then quickly “It is an interesting and exciting time for us,
changed to Silverlight.” because we are reaping the benefit of all this
Users also go to the portal to find content investment that Esri has made in this technol-
including ArcGIS map projects and spatial ogy,” said Sanderson.
layers, satellite imagery, geotagged photos
Spring 2012 esri.com/petroleum 3](https://image.slidesharecdn.com/petrol-spring-20121-120427144028-phpapp02/85/Esri-News-for-Petroleum-Spring-2012-3-320.jpg)


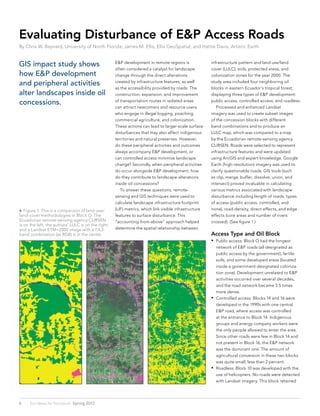
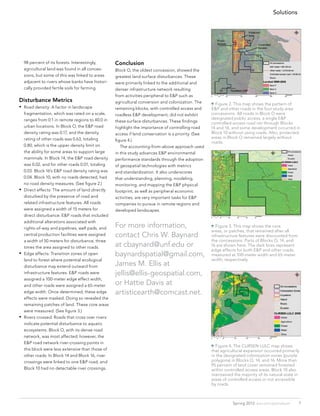


This study used remote sensing and GIS techniques to evaluate the impact of oil and gas exploration and production (E&P) access roads on landscape disturbance. The researchers analyzed four oil blocks in Ecuador to determine how controlled versus public access to E&P roads affected peripheral activities like logging, farming, and settlement. They found that blocks with public road access, like Block O, had much higher road densities and more landscape changes unrelated to E&P. Controlled access blocks had lower disturbance, showing that limiting access can help minimize impacts from peripheral activities accompanying E&P development. The analysis demonstrated how GIS metrics can quantify the relationship between infrastructure development and surface changes inside oil concessions.