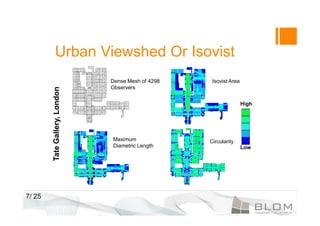
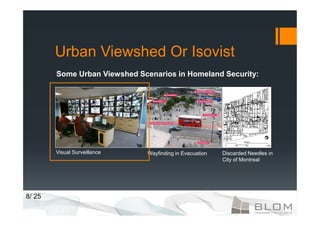
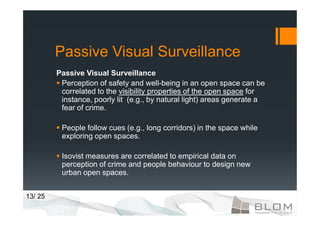
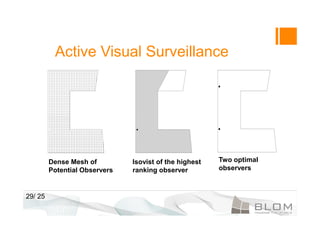
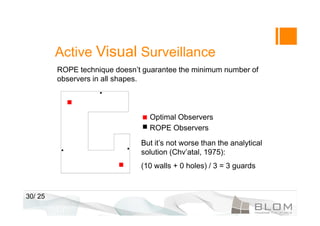
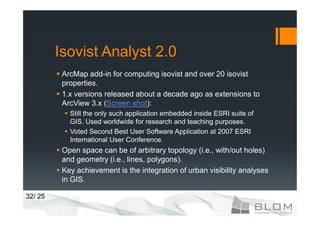
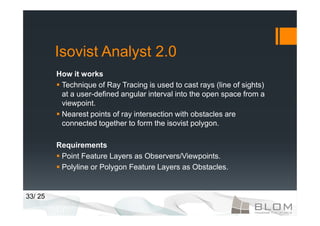
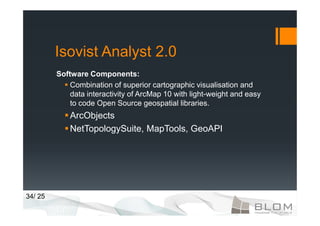
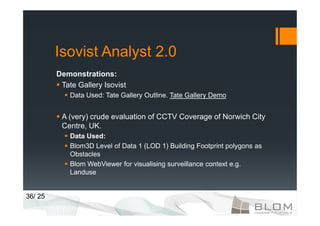
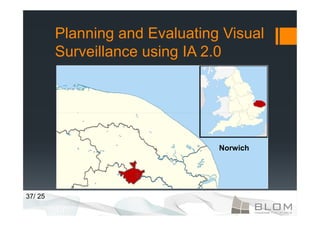
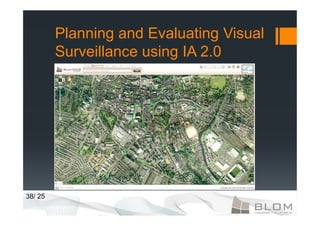
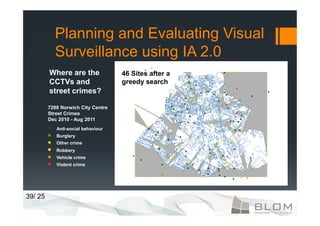
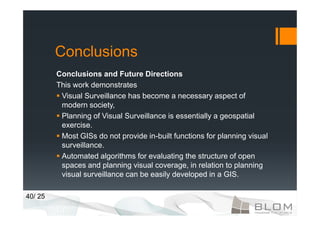
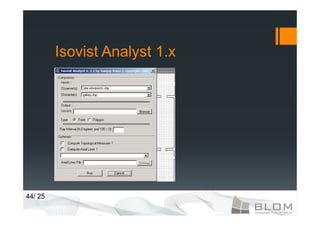
Isovist Analyst 2.0 is an ArcMap add-in that allows users to compute isovists and related properties to evaluate visual accessibility and surveillance of open spaces. It is an updated version of the earlier Isovist Analyst 1.x tool. The tool can analyze arbitrary space geometries and topologies using a ray-tracing technique. It integrates urban visibility analysis into GIS and demonstrates planning and evaluating visual surveillance of an area like Norwich, UK using metrics like isovist area and potential CCTV coverage.
Integration and Automation in Practice: CI/CD in Mule Integration and Automat...
Isovist Analyst 2.0 for Urban Viewshed Analyses
1. Isovist Analyst 2.0
An ArcMap 10 Add-In for Urban Viewshed
Analyses : Visual Surveillance
Sanjay Rana
Ideas and Improvement Group @ BLOM (UK)
2. Topics
Brief Overview of Urban Viewshed Analysis and its
application in Visual Surveillance
Isovist Analyst 2.0
Visual Surveillance Planning and Evaluation using
Isovist Analyst 2.0
2/ 25
4. Urban Viewshed Or Isovist
Definition
An urban viewshed or isovist is (typically a 2D) area visible
from a location in an indoor or outdoor urban environment.
Purpose
Evaluating “Visual” Accessibility of Open Spaces is vital for
various applications e.g. visual surveillance, evacuation,
crime pattern analyses, pedestrian wayfinding, and so on.
Example of an Isovist
Tate Britain Gallery, London, UK
4/ 25
5. Urban Viewshed Or Isovist
Brief History
Proposed by Tandy (1967) and popularised by Benedikt
(1979) for studies in architecture, urban design, urban
planning, transport planning.
Research on this theme now come under the field of “Space
Syntax”.
Relevant Wikipedia Entries: isovist space syntax visibility
graph analysis space network analysis software
5/ 25
6. Urban Viewshed Or Isovist
Properties of Isovists
Geometrical measures
Shortest/Longest line of sights
Area
Shape Ratios
r d
Topological measures
Clustering Coefficient
Control
6/ 25
7. Urban Viewshed Or Isovist
Dense Mesh of 4298 Isovist Area
Observers
Tate Gallery, London
High
Maximum Circularity
Diametric Length Low
7/ 25
8. Urban Viewshed Or Isovist
Some Urban Viewshed Scenarios in Homeland Security:
Visual Surveillance Wayfinding in Evacuation Discarded Needles in
City of Montreal
8/ 25
10. Visual Surveillance
Two types of visual surveillance
Passive or Natural Visual Surveillance
Design of urban open spaces so as to ensure that
occupants can self-regulate themselves and reduce the
fear of crime.
Cheap, long lasting but involves a risk.
Active or Artificial Visual Surveillance
Direct and intrusive remote monitoring via devices such
as CCTV or human observers.
Potentially more effective but costly.
10/ 25
12. Passive Visual Surveillance
Passive Visual Surveillance
The aim is to create the perception of being observed or
feeling safe by suitable architectural design of an open
space:
Occupants can see other occupants and entry/exist points in
space, so that they can self-regulate themselves, e.g., in
public spaces,
Occupants always feel being watched by an invisible
observer.
Measures include removal of blind spots, dark alleys,
installing one-way screens (Venetian blinds) etc.
12/ 25
13. Passive Visual Surveillance
Passive Visual Surveillance
Perception of safety and well-being in an open space can be
correlated to the visibility properties of the open space for
instance, poorly lit (e.g., by natural light) areas generate a
fear of crime.
People follow cues (e.g., long corridors) in the space while
exploring open spaces.
Isovist measures are correlated to empirical data on
perception of crime and people behaviour to design new
urban open spaces.
13/ 25
14. Passive Visual Surveillance
Natural Visual Surveillance
Greene, M., and Greene, R., 2004, Urban safety in residential areas, Space
Syntax Conference.
14/ 25
15. Passive Visual Surveillance
Famous Example of Passive Visual Surveillance: The Panopticon
Prison Design by Jeremy Bentham
A central guard tower, surrounded
by prison cells but the prisoners can
neither see each other nor the
prison guards therefore creating the
perception of being under constant
invisible observation.
Examples include Twin Towers
Correctional Facility (Los Angeles)
and Pentonville Prison (England).
15/ 25
17. Active Visual Surveillance
Active Visual Surveillance
The use of visual surveillance has dramatically increased in
recent years, as demands arose for monitoring,
Criminal behaviour in public space,
Traffic,
etc. etc.
Several thousand millions of pounds are spent on sales and
rental of CCTV and other types of visual surveillance.
17/ 25
19. Active Visual Surveillance
Active Visual Surveillance
The aim is to ensure complete/maximum visual coverage
of an open space.
It involves an iterative, manual and gut-feel process of
trying various layouts until a satisfactory solution has been
found.
Traditionally done by architects, security consultants and
urban planners using CAD software.
19/ 25
20. Active Visual Surveillance
Example Of Active
Visual Surveillance
Identification of the
Four Suspects In London
Transport Network
Bombings (July, 2005)
20/ 25
21. Active Visual Surveillance
Active Visual Surveillance
Challenges:
Costs of installation and maintenance, and coverage of CCTV
cameras need to be addressed.
The problem of ensuring maximum visual coverage with a
minimum number of CCTV/observers is broadly similar to
Location-Allocation, Chinese Postman/Travelling Salesman
problems in GIS, and most importantly closely similar to the Art
Gallery Problem in Computer Science.
21/ 25
23. Active Visual Surveillance
Art Gallery Problem (AGP)
Proposed by Victor Klee in 1973.
What’s the minimum number of guards necessary to provide
complete visual coverage of an art gallery?
Solution of the AGP is going to be relevant for an affordable
and effective CCTV network.
However, there are no robust algorithms that guarantee a
general purpose solution.
Mathematically, the problem is NP-hard. Thus, it is
analytically and computationally non-trivial and unsolvable at
present therefore approximate solutions are used.
23/ 25
24. Active Visual Surveillance
Art Gallery Problem
Most existing algorithms assume a certain topology of the art
gallery e.g., rectilinear, convex. A well known formula to solve
the AGP is by Chv’atal (1975),
For a gallery with n walls and h holes, at most (n+h/3)
number of guards are sufficient to provide complete visual
coverage,
This solution doesn’t guarantee the minimum number in all
shapes but definitely yields a number enough for complete
visual coverage e.g.
24/ 25
25. How Many Guards Are Sufficient to
Cover the Gallery ?
71 Walls + 0 Holes
(n+h)/3 = 23?
9
25/ 25
27. Active Visual Surveillance
Rank and Overlap Elimination (ROPE) For Solving AGP
It is essentially a greedy-search method.
The open space is discretised with a dense mesh of potential
observers.
Each observer is assigned a rank based on the number of other
observers seen by it. Higher rank means higher visibility.
Starting with the highest ranking observer (observer with largest
isovist area), an iterative process selects the optimal observers
27/ 25
28. Active Visual Surveillance
START
Pick highest ranking observer
remaining in potential observers
ROPE Selection Remove all potential observers
Process Flowchart visible to highest ranking observer
Yes Potential observers left in open
space ?
No
STOP
28/ 25
29. Active Visual Surveillance
Dense Mesh of Isovist of the highest Two optimal
Potential Observers ranking observer observers
29/ 25
30. Active Visual Surveillance
ROPE technique doesn’t guarantee the minimum number of
observers in all shapes.
Optimal Observers
ROPE Observers
But it’s not worse than the analytical
solution (Chv’atal, 1975):
(10 walls + 0 holes) / 3 = 3 guards
30/ 25
32. Isovist Analyst 2.0
ArcMap add-in for computing isovist and over 20 isovist
properties.
1.x versions released about a decade ago as extensions to
ArcView 3.x (Screen shot):
Still the only such application embedded inside ESRI suite of
GIS. Used worldwide for research and teaching purposes.
Voted Second Best User Software Application at 2007 ESRI
International User Conference.
Open space can be of arbitrary topology (i.e., with/out holes)
and geometry (i.e., lines, polygons).
Key achievement is the integration of urban visibility analyses
in GIS.
32/ 25
33. Isovist Analyst 2.0
How it works
Technique of Ray Tracing is used to cast rays (line of sights)
at a user-defined angular interval into the open space from a
viewpoint.
Nearest points of ray intersection with obstacles are
connected together to form the isovist polygon.
Requirements
Point Feature Layers as Observers/Viewpoints.
Polyline or Polygon Feature Layers as Obstacles.
33/ 25
34. Isovist Analyst 2.0
Software Components:
Combination of superior cartographic visualisation and
data interactivity of ArcMap 10 with light-weight and easy
to code Open Source geospatial libraries.
ArcObjects
NetTopologySuite, MapTools, GeoAPI
34/ 25
36. Isovist Analyst 2.0
Demonstrations:
Tate Gallery Isovist
Data Used: Tate Gallery Outline. Tate Gallery Demo
A (very) crude evaluation of CCTV Coverage of Norwich City
Centre, UK.
Data Used:
Blom3D Level of Data 1 (LOD 1) Building Footprint polygons as
Obstacles
Blom WebViewer for visualising surveillance context e.g.
Landuse
36/ 25
37. Planning and Evaluating Visual
Surveillance using IA 2.0
Disclaimer: Solely to demonstrate the application context and
doesn’t in any way indicate any actual issue being studied.
Norwich is an important city in East of England.
City was basically chosen because CCTV and Crime data
was found on the internet, and BLOM contains good
coverage of the city in aerial photographs and vector data
Norwich
37/ 25
38. Planning and Evaluating Visual
Surveillance using IA 2.0
Current distribution of CCTV in Norwich City Centre.
Source: http://sites.google.com/site/norwichpolicecctv/, last
accessed 23rd October 2011.
38/ 25
39. Planning and Evaluating Visual
Surveillance using IA 2.0
Where are the 46 Sites after a
6400
CCTVs and 717 for full
Potentialsearch
greedy
66%
street crimes? coverage
CCTV
uncovered
Locations
7288 Norwich City Centre
Street Crimes
Dec 2010 - Aug 2011
Anti-social behaviour
Burglary
Other crime
Robbery
Vehicle crime
Violent crime
39/ 25
40. Conclusions
Conclusions and Future Directions
This work demonstrates
Visual Surveillance has become a necessary aspect of
modern society,
Planning of Visual Surveillance is essentially a geospatial
exercise.
Most GISs do not provide in-built functions for planning visual
surveillance.
Automated algorithms for evaluating the structure of open
spaces and planning visual coverage, in relation to planning
visual surveillance can be easily developed in a GIS.
40/ 25
41. Disclaimer and Credits
All views and work expressed are solely my own. Blom has
no responsibility for any errors or opinions.
Images:
http://www.chelmsford.gov.uk/media/image/m/d/Monitor_wall_%2
8o%29_large.jpg
http://urbandesign.tfl.gov.uk/Design-Guidance/London-
Rail/Crossrail/Underground-Rail-%281%29/Routes-
%281%29.aspx
BLOM for access to building footprints and Blom WebViewer data
www. isee.com for the CCTV coverage of Manhattan image.
Conroy and Dalton (1999) for the Tate Gallery outline.
www.police.uk for crime data
41/ 25