Downloaded 15 times


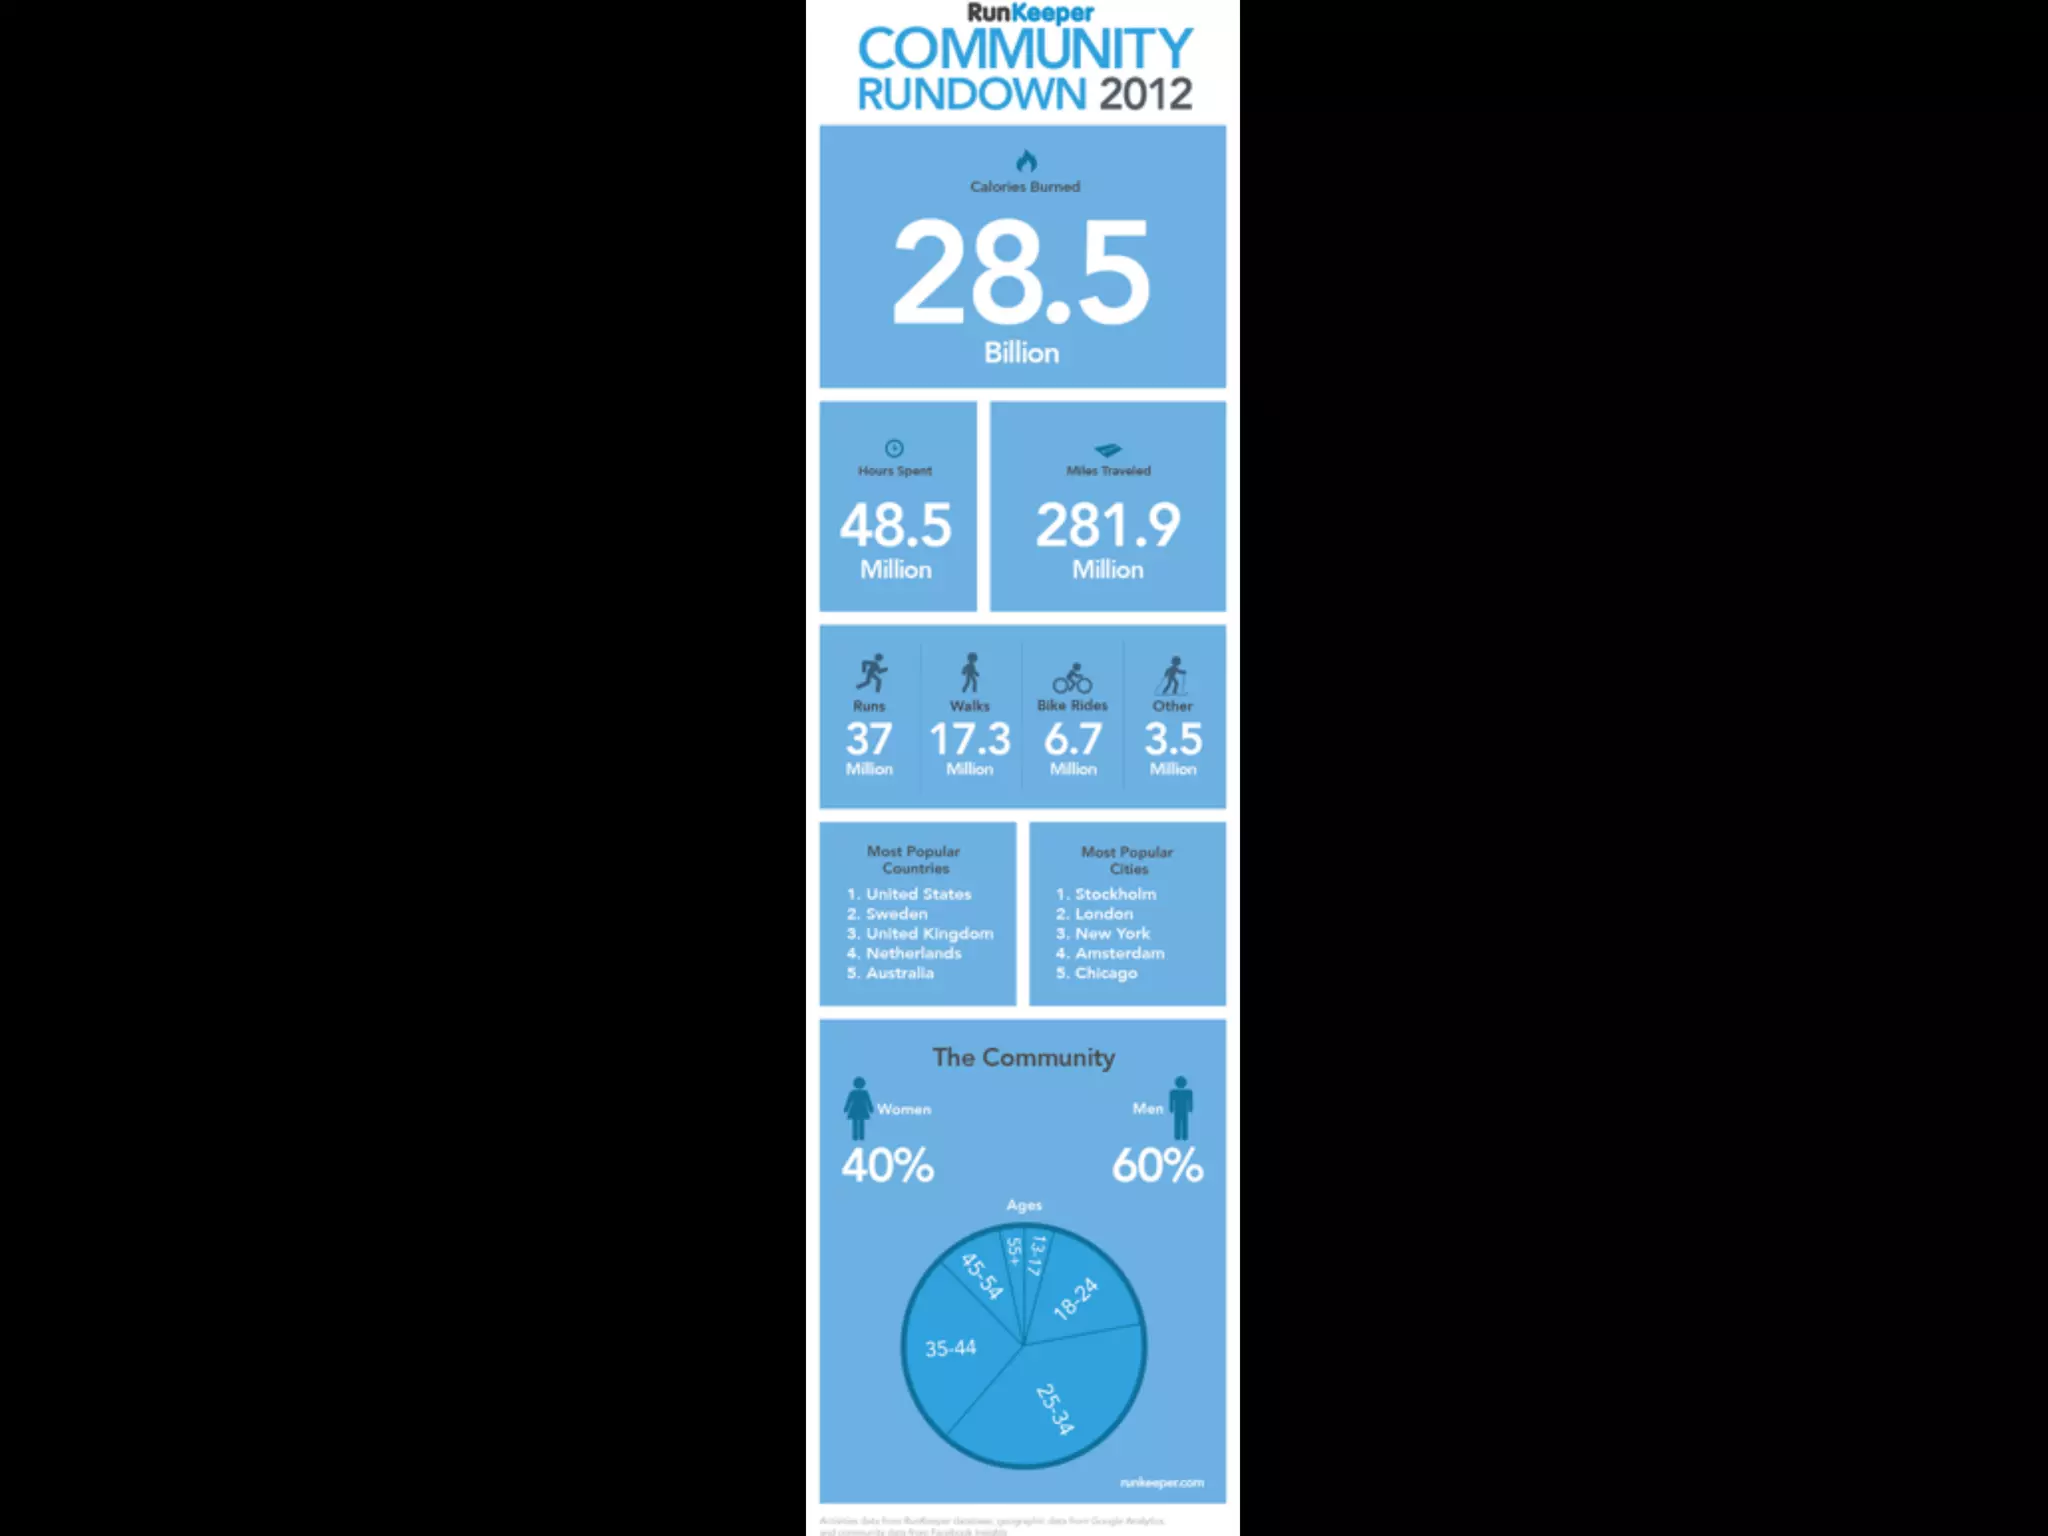
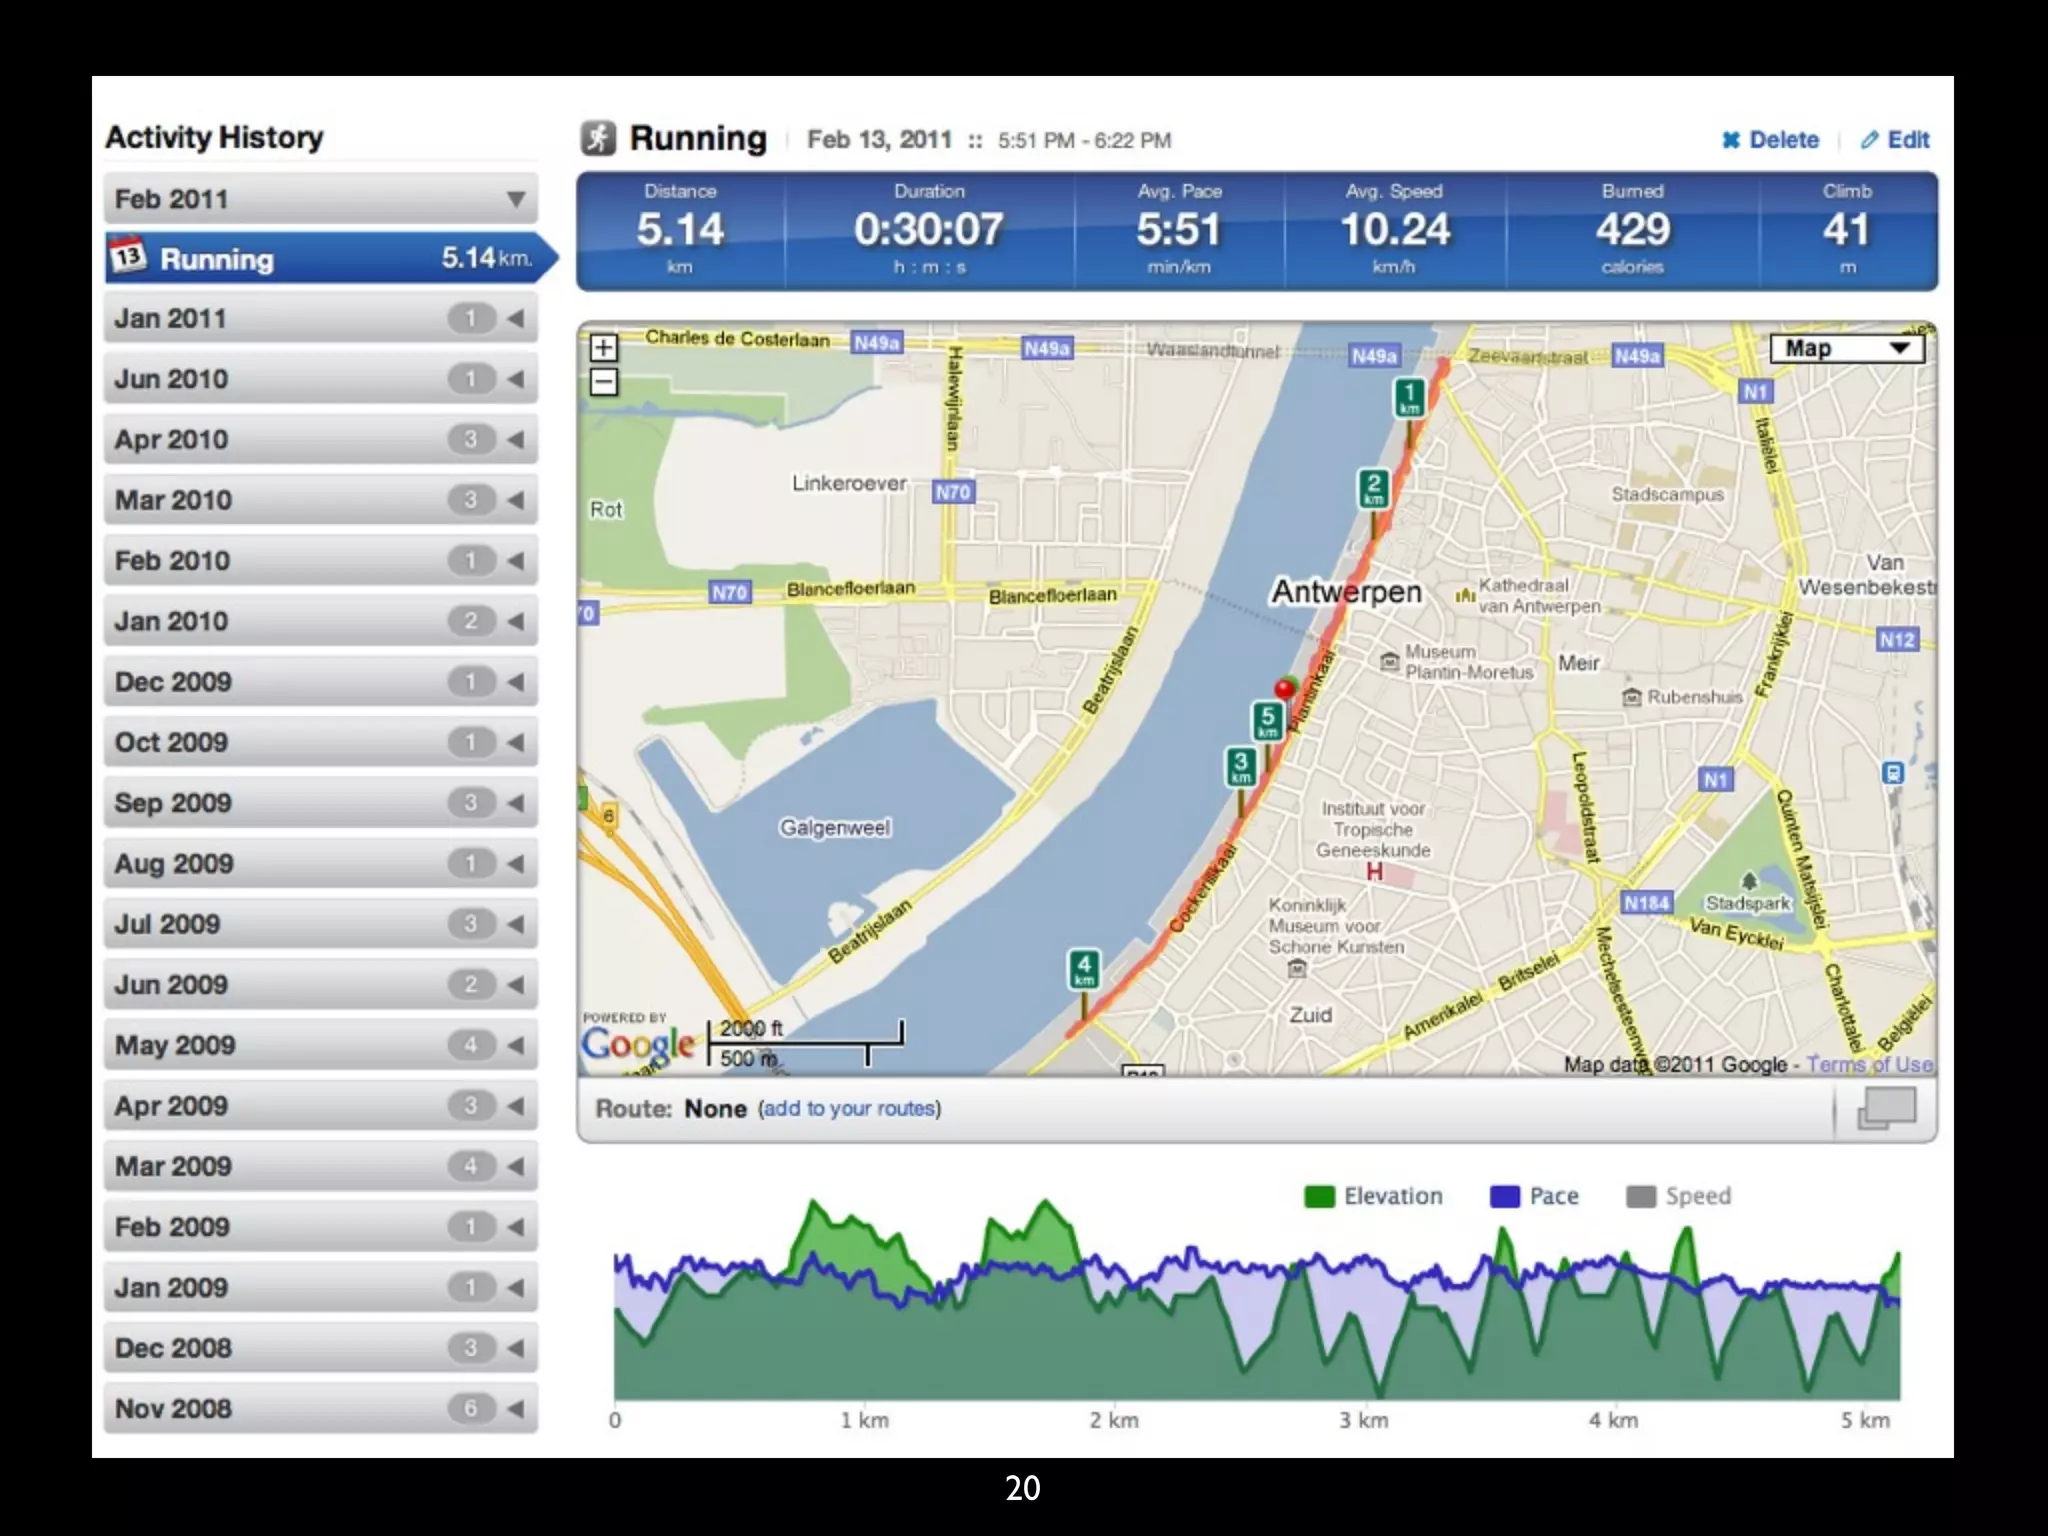
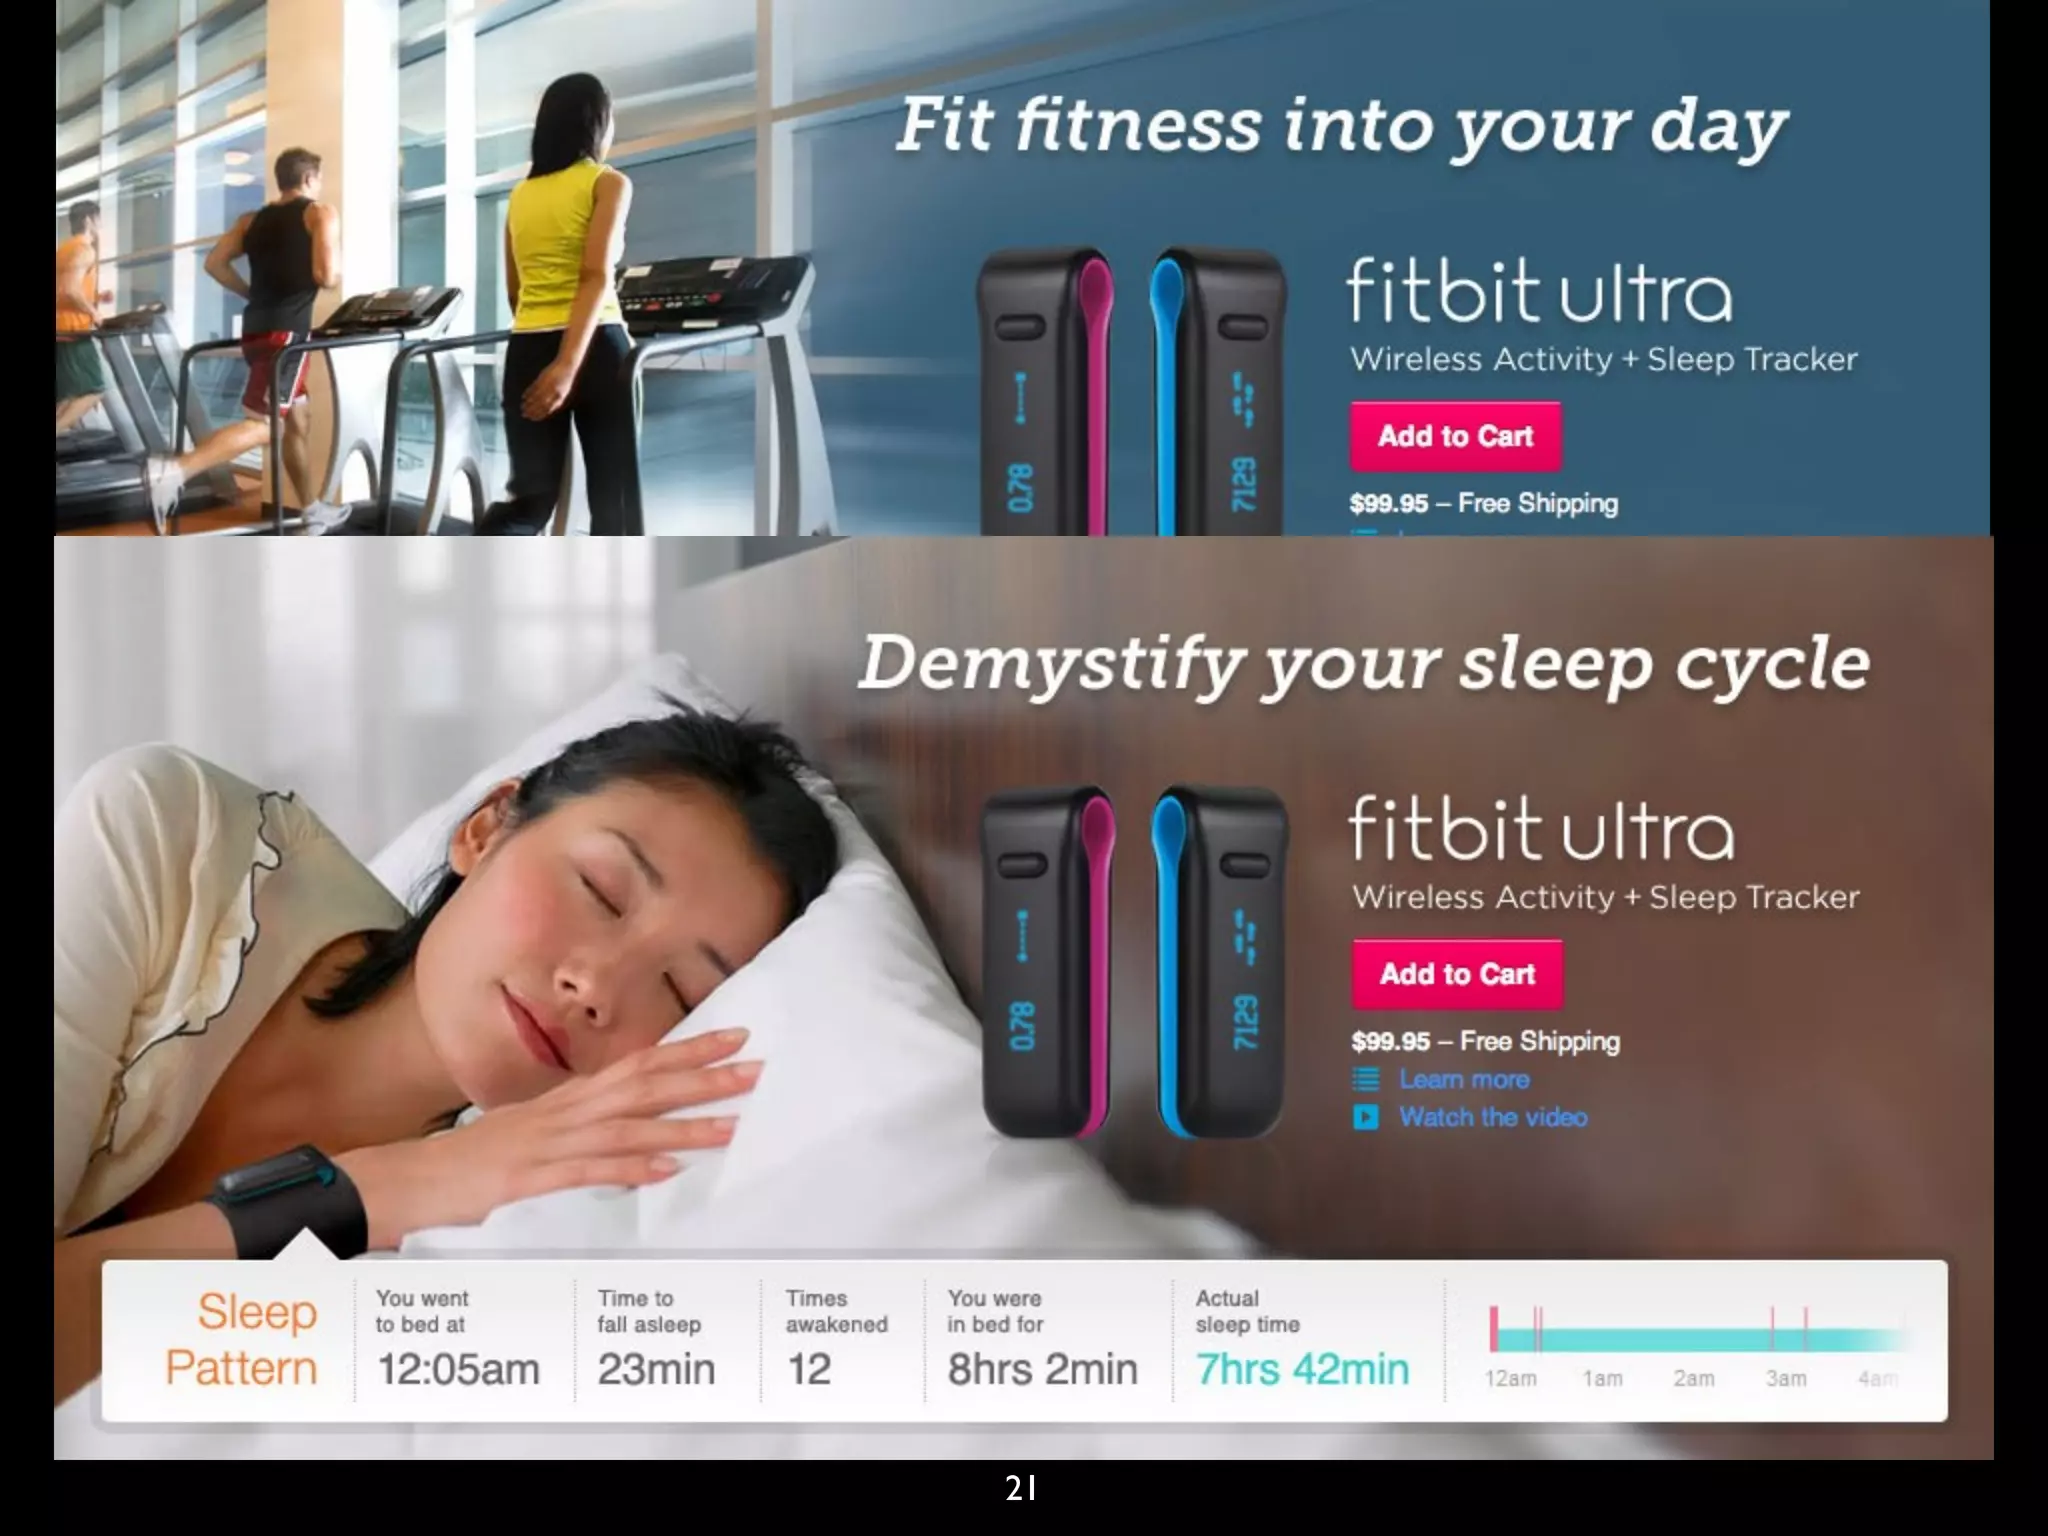
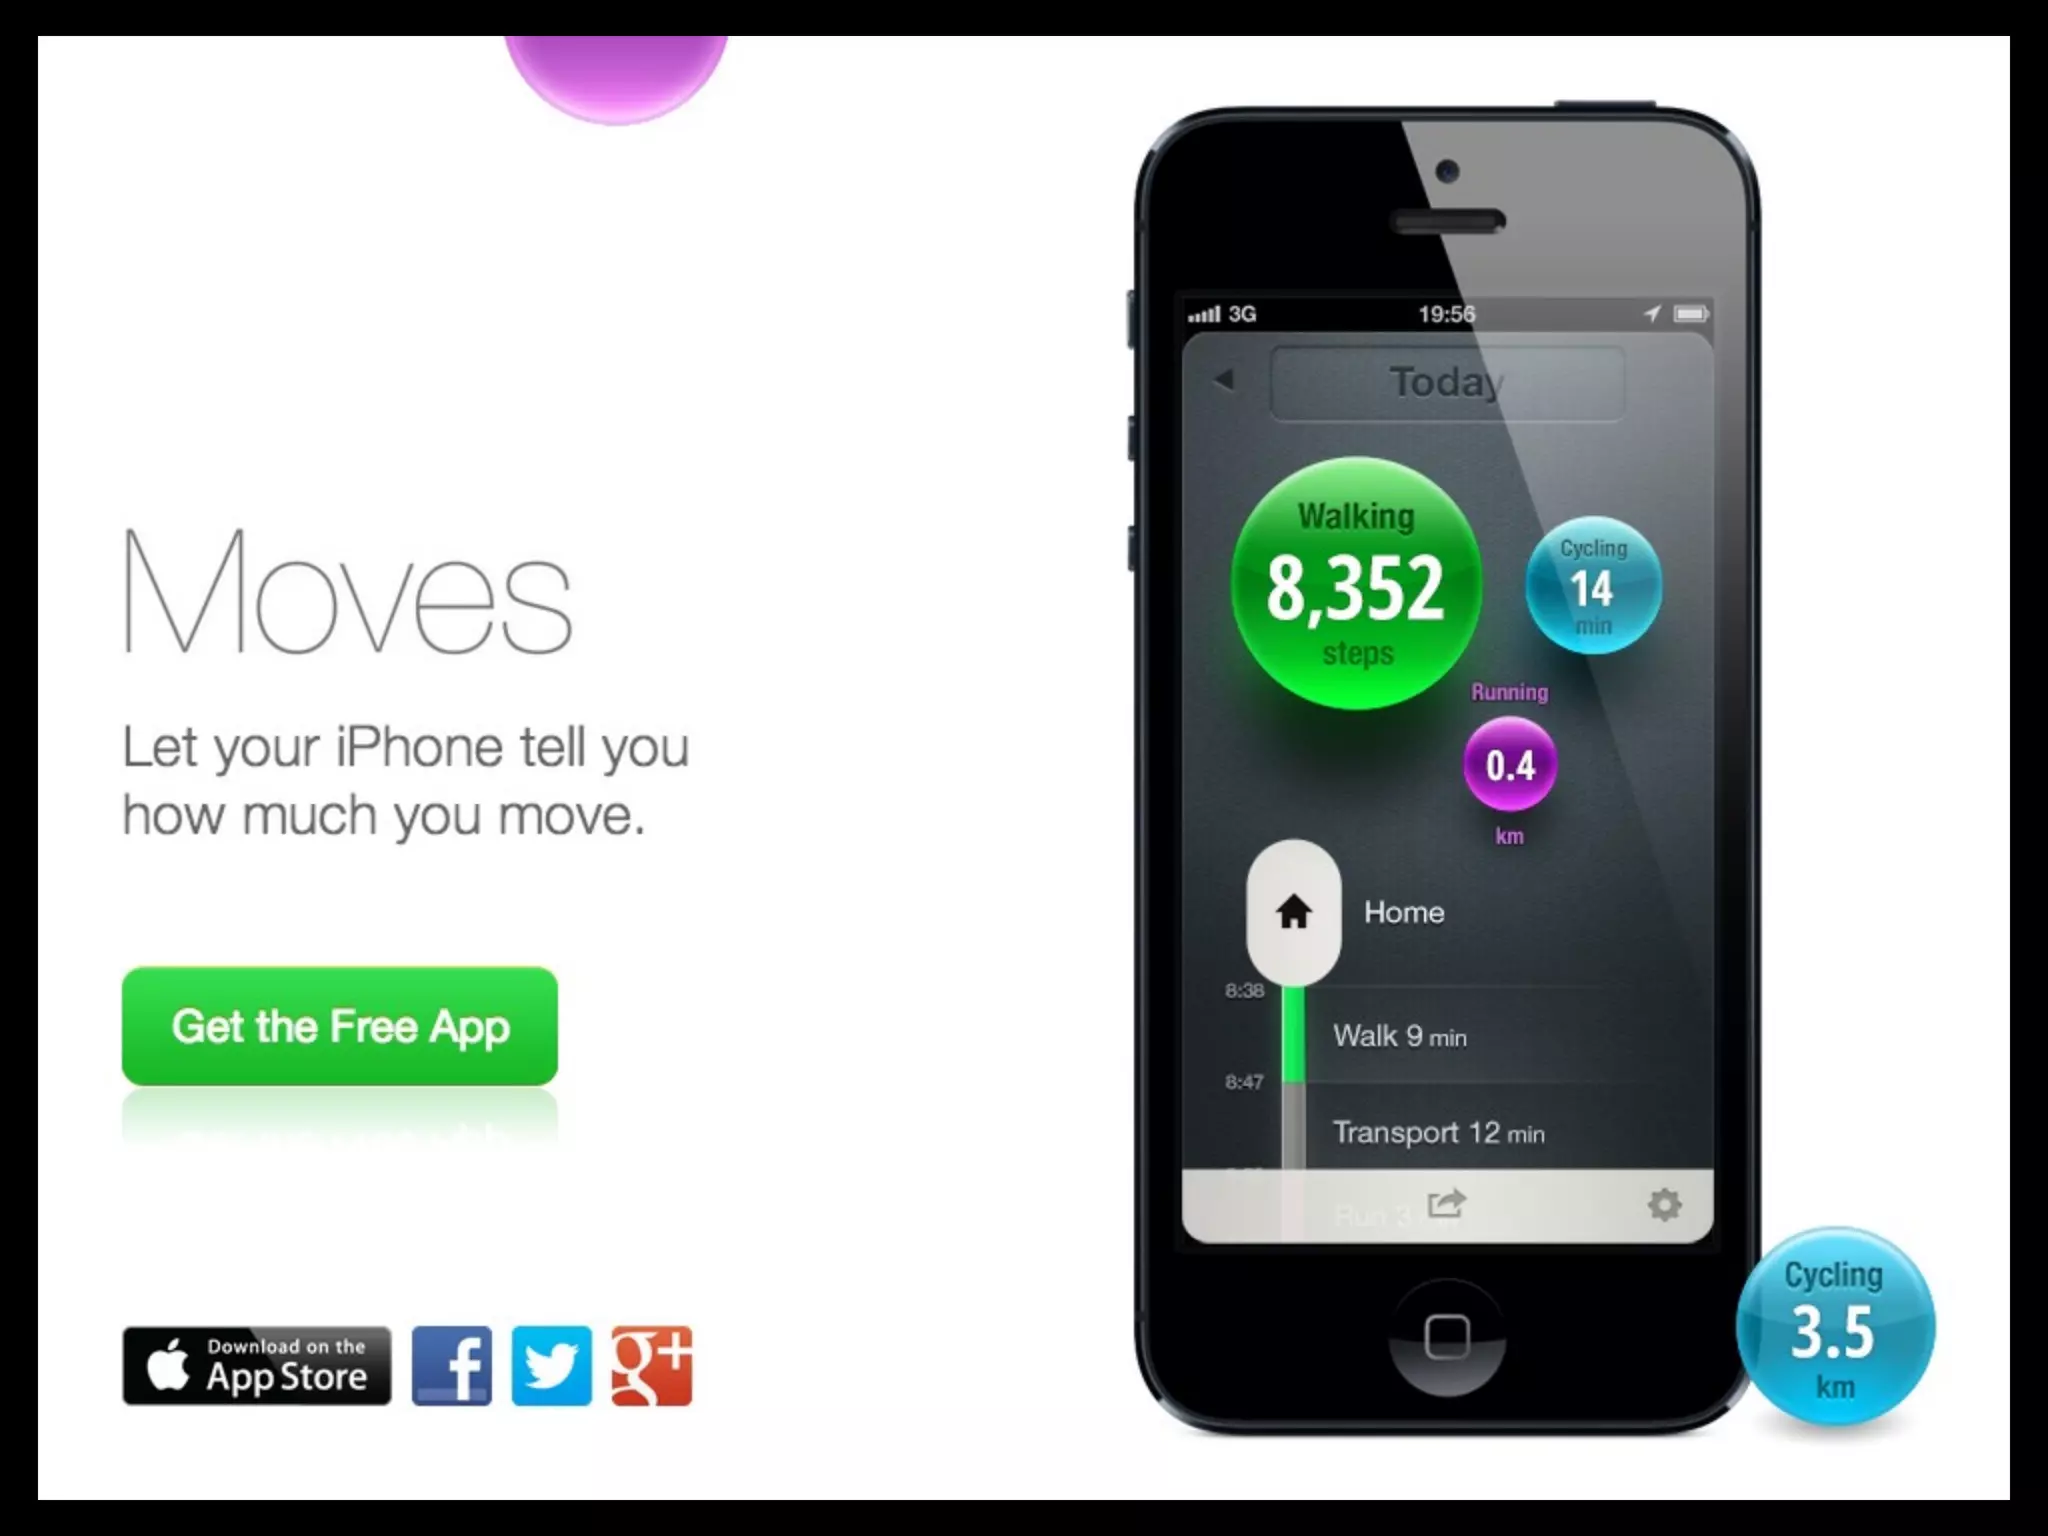
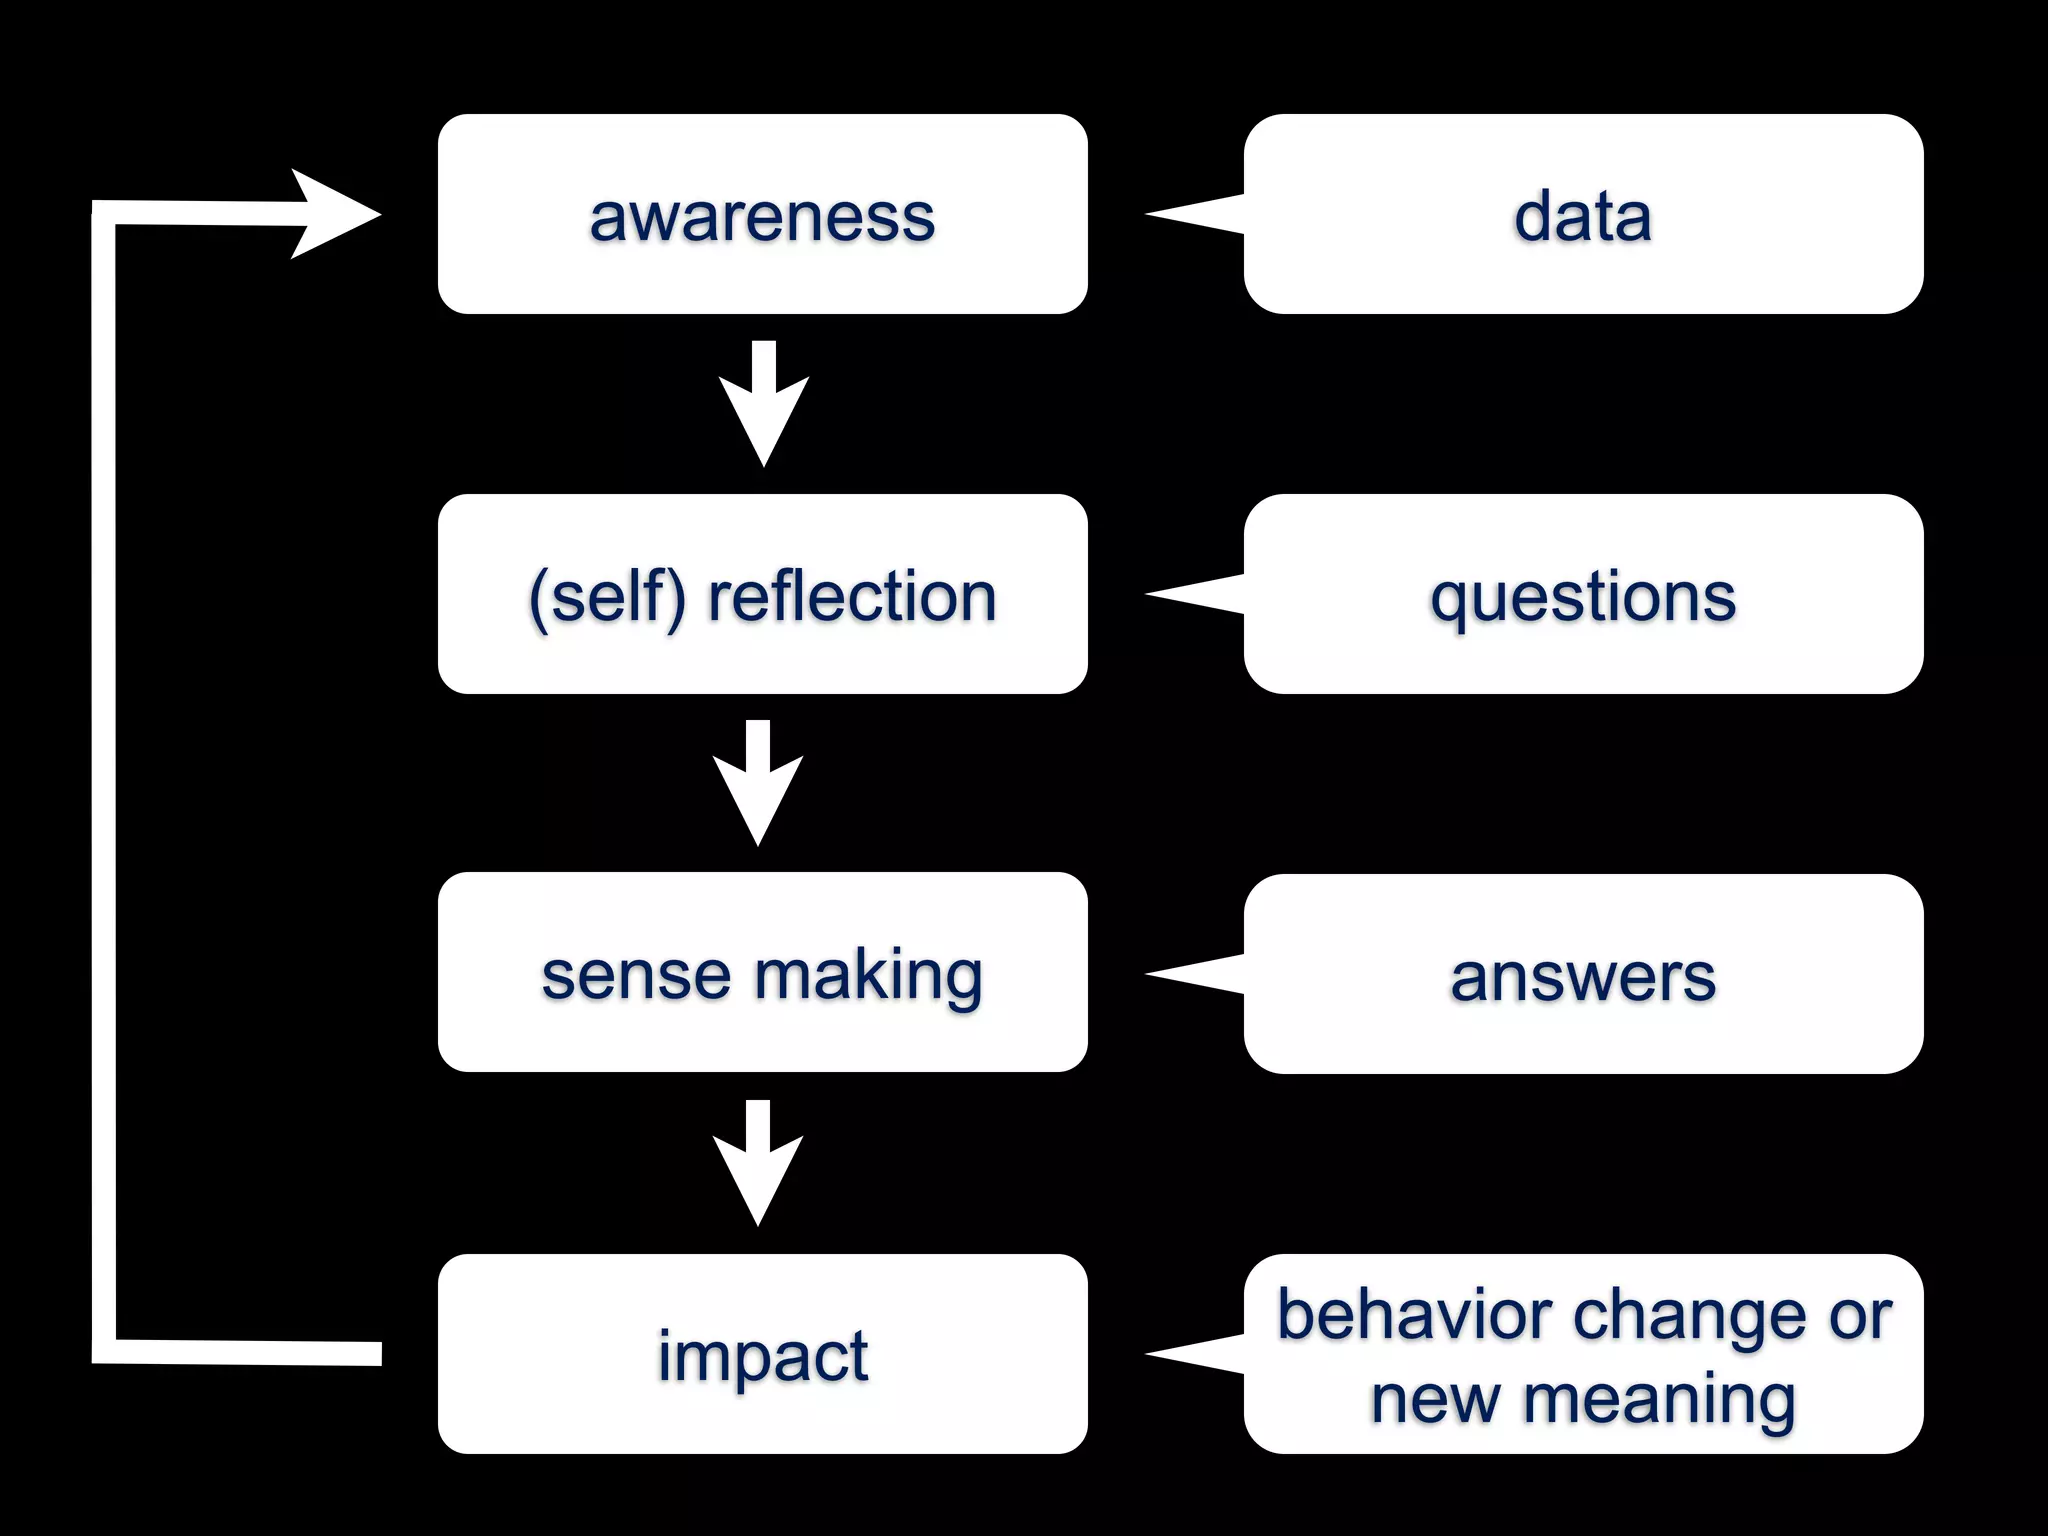

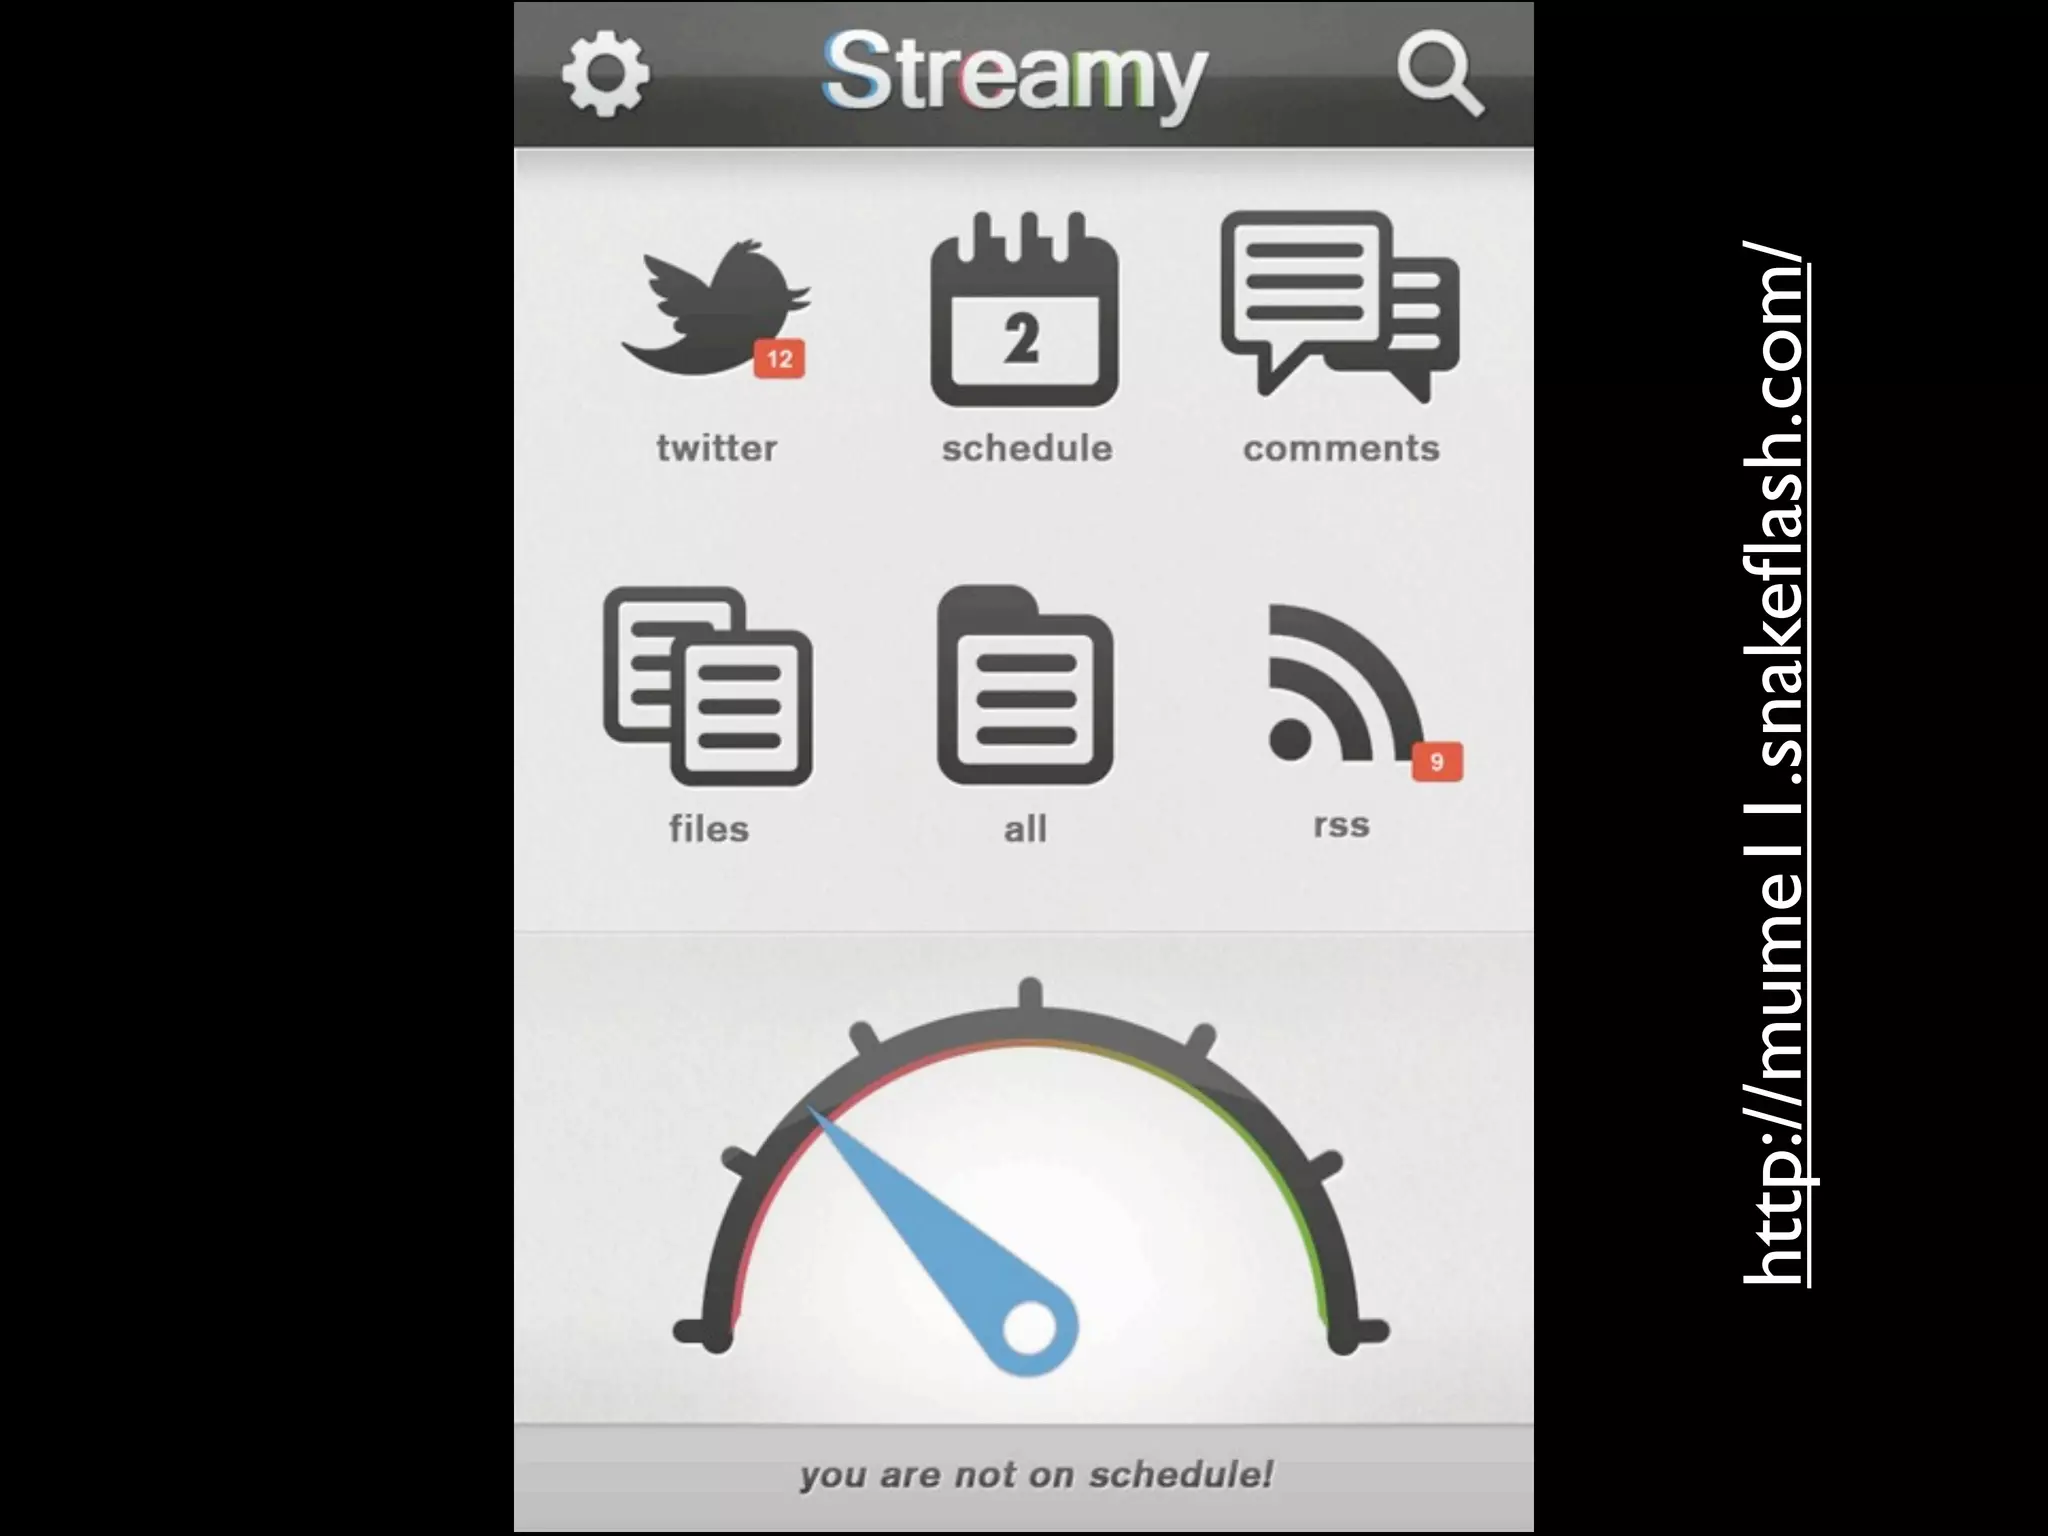
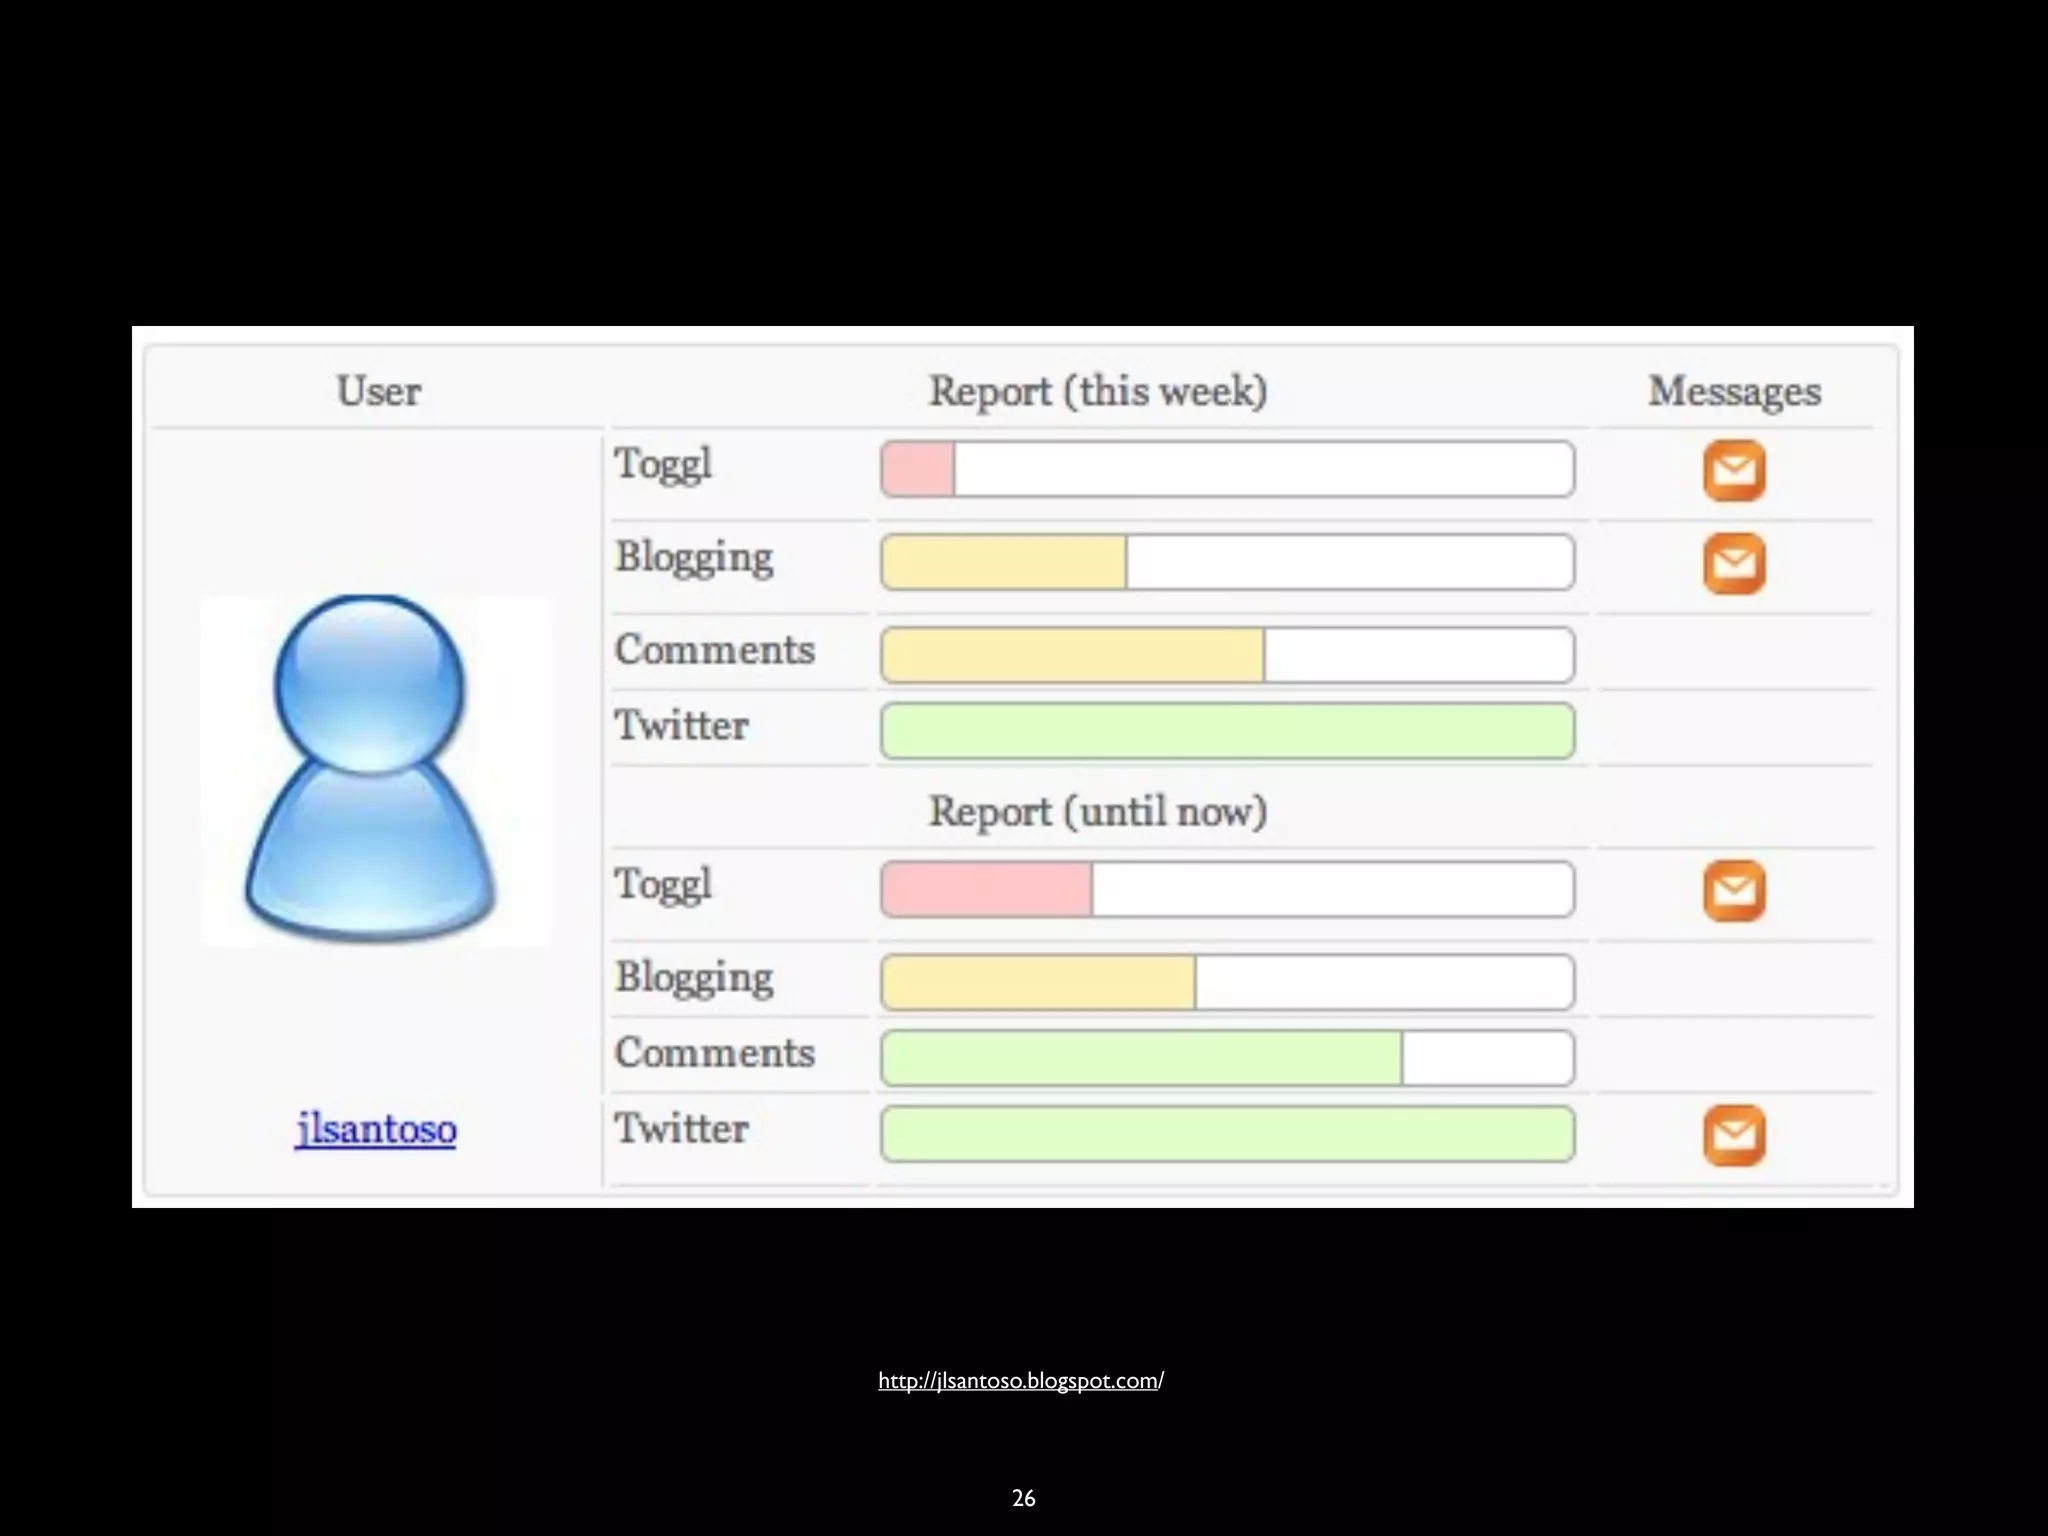


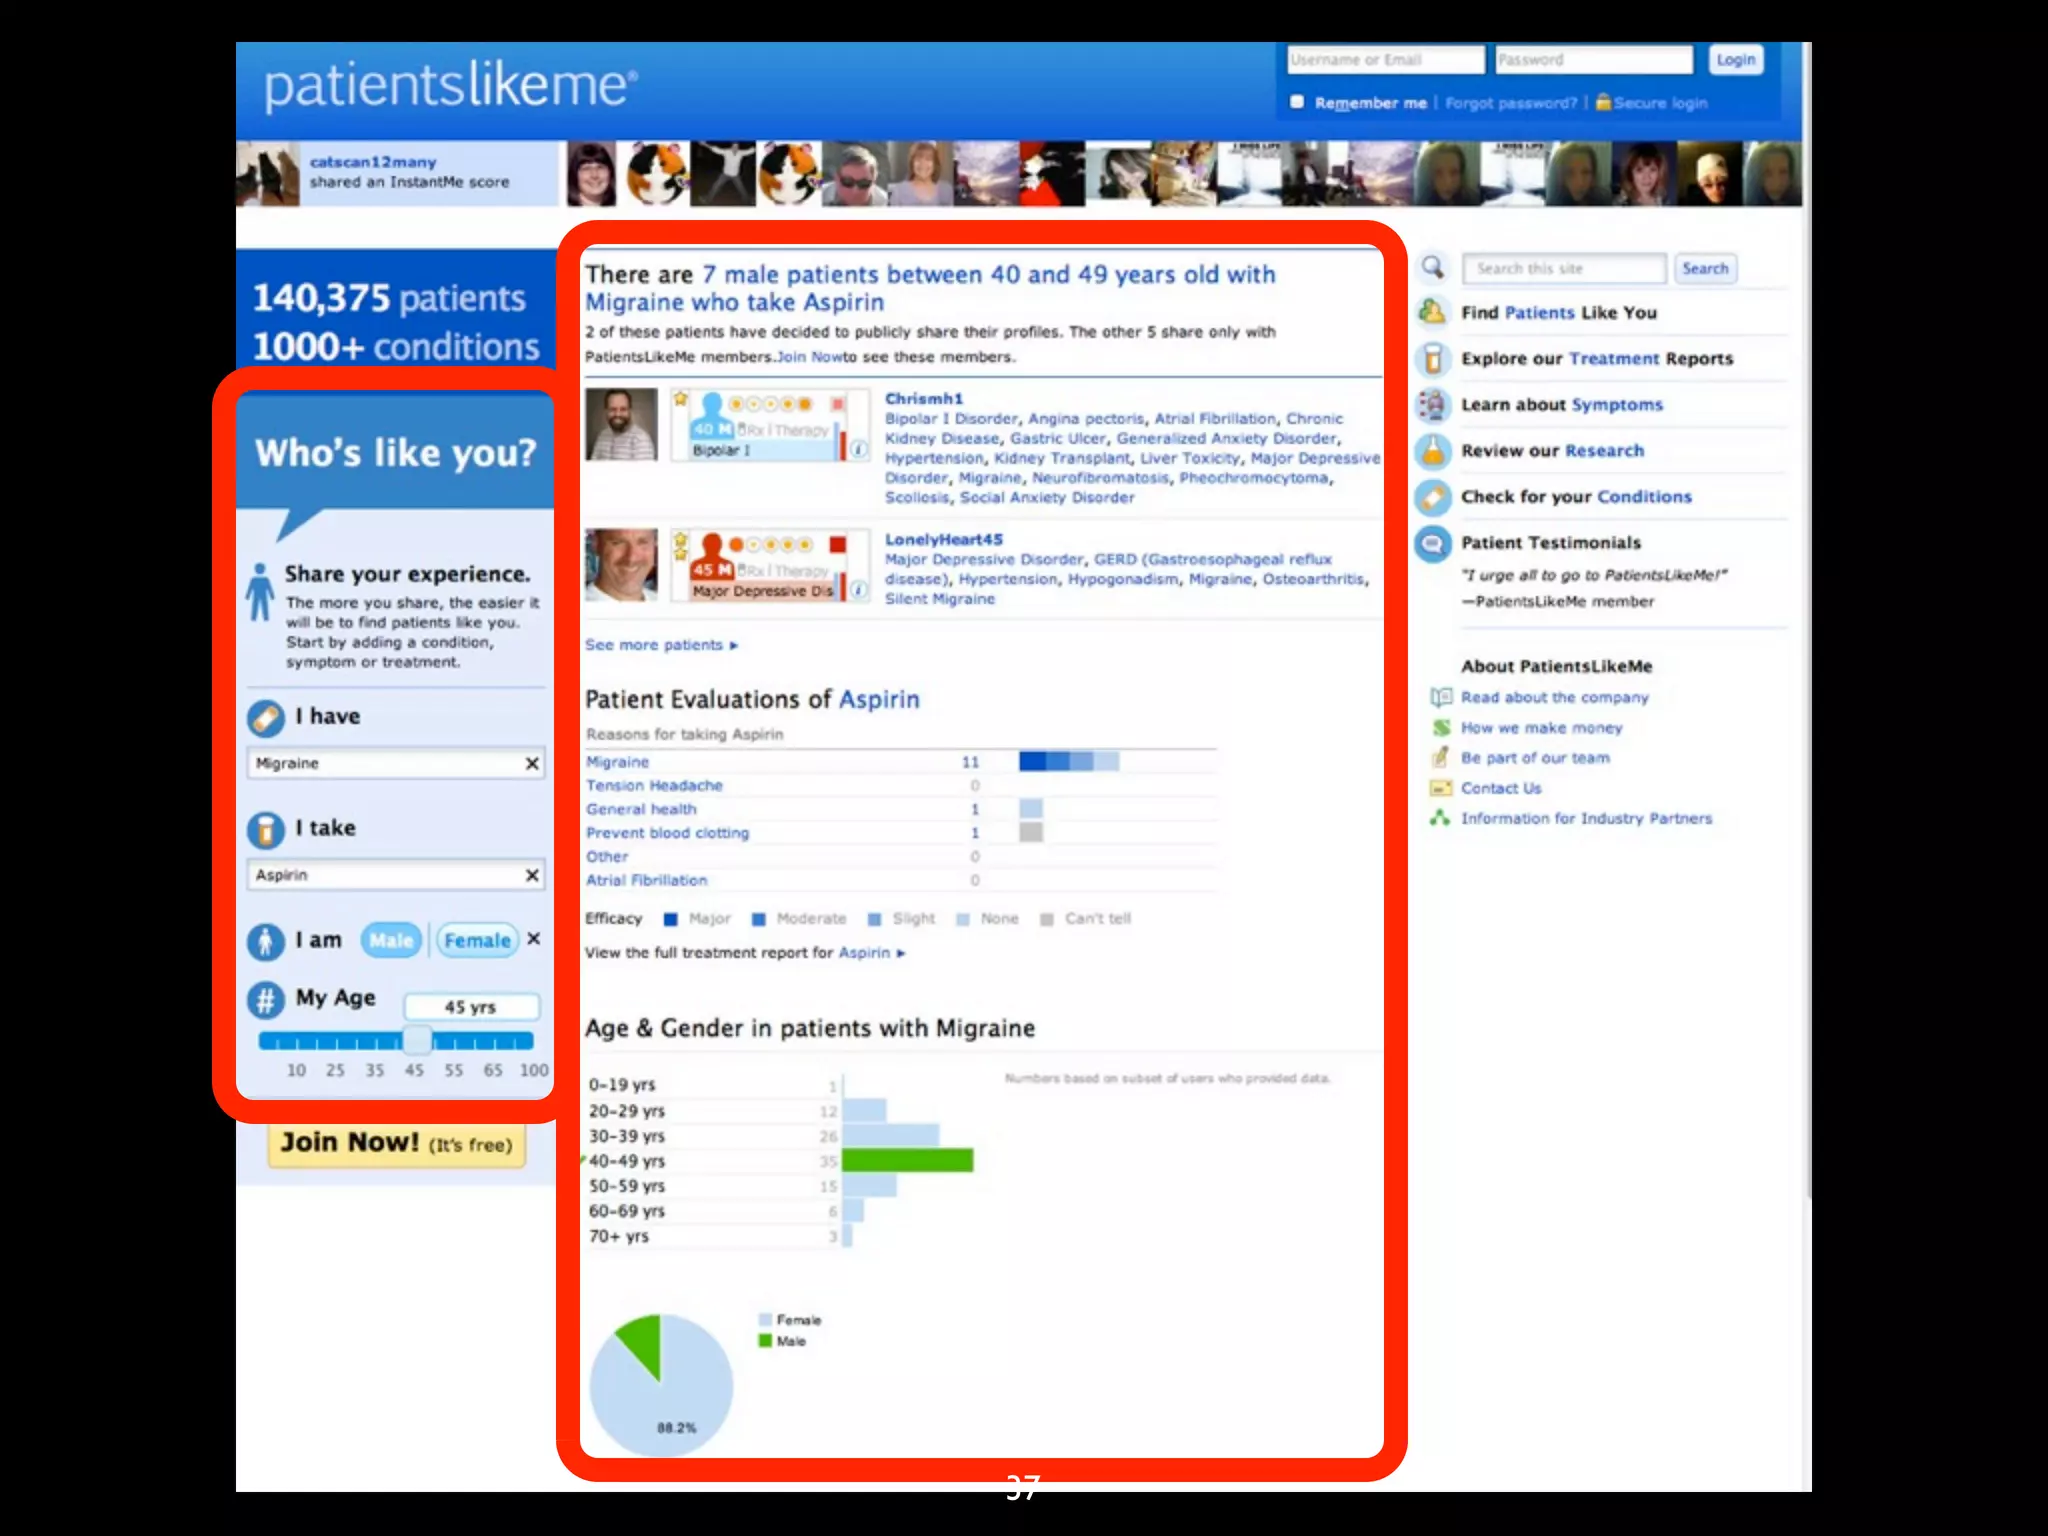


Personal health dashboards through Quantified Self apps allow individuals to track various health metrics over time. These dashboards provide insights that help people reflect on and change their behaviors. However, they also raise issues regarding privacy, control over personal data, and how to balance patient empowerment with potential fears about constant self-monitoring. Effective design is needed to address these challenges and ensure such technologies are transparent and beneficial.


![Computing for Human Experience [v3, Aug-Oct 2010]](https://cdn.slidesharecdn.com/ss_thumbnails/che-aug2010-100905093348-phpapp01-thumbnail.jpg?width=640&height=640&fit=bounds)


