The document evaluates the performance of two types of optical amplifiers, Erbium-Doped Fiber Amplifier (EDFA) and Semiconductor Optical Amplifier (SOA), within optical transmission systems using the OptiSystem simulator. The analysis indicates that EDFA provides superior output power, Q-factor, and lower bit error rate compared to SOA, particularly over long distances. The findings suggest the use of EDFA as more advantageous in optical communication due to its better performance characteristics.
![IOSR Journal of Electronics and Communication Engineering (IOSR-JECE)
e-ISSN: 2278-2834,p- ISSN: 2278-8735.Volume 12, Issue 2, Ver. I (Mar.-Apr. 2017), PP 05-07
www.iosrjournals.org
DOI: 10.9790/2834-1202010507 www.iosrjournals.org 5 | Page
Performance Analysis of Optical Amplifiers (EDFA and SOA)
Nabil Elsheikh Mohamed Elmak 1
, Dr. Amin Babiker A/Nabi Mustafa 2
1,2
(Telecommunications Engineering, Faculty of Engineering/ Neelain University, Sudan)
Abstract: In the optical transmission systems attenuation causes signal power to drop through an optical fiber
link, so need to use amplifiers to increase signal power with low noise. Semiconductor Optical Amplifier (SOA)
and Erbium-Doped Fiber Amplifier (EDFA) are two of the main types of optical amplifiers, and they were used
in this simulation model to analyze their performance, with a data rate of 622 Mb/s (STM-4 level) and 170 km
optical fiber length for each simulation model. This was simulated by using OptiSystem simulator, including the
main parameters of the optical transmission system as input power (dBm), optical fiber cable length (km) and
attenuation per length of optical fiber cable (dB/km), also there are three parameters will be considered which
they are output power (dBm), Q-Factor and Bit Error Rate (BER) at receiver, and also Eye Diagram.
Keywords: EDFA, Optical Amplifier, Optisystem simulator, Optical Transmission System, SOA
I. Introduction
The simple optical transmission system consists of three necessary elements which are fiber cable
(transmission channel), light sources as the input and light detector as the output [1]. Also, there are optical
amplifiers a key component in an optical communication system which used to increase the power of the signal
and reduce the attenuation. Optical amplifiers perform a most important role in modern optical networks,
allowing the transmission of highest data rates over long distance without attenuation [5].
There are multiple types of optical amplifiers and the most common used in the optical transmission
system are Semiconductor Optical Amplifier (SOA) and Erbium Doped Fiber Amplifier (EDFA). SOA
amplifiers use a semiconductor to provide the gain medium, the structure of SOA is similar to semiconductor
lasers. They consist of an active part and a passive part made of a semiconductor material such as indium
phosphide; it has used as discrete amplifiers [2]. SOAs are fabricated with layers of antireflection coats to avoid
light from reflecting into the circuit. Optical gain takes place when current has directed across the pـn junction,
this process causes the photons to duplicate, generating signal gain [3].
Erbium-doped fiber amplifier (EDFA) have deployed in undersea links and now are considered as
standard amplifier using a well- known technology [4]. Commercially available since the early of 1990’s, EDFA
can amplify a large wavelength range from 1500 nm to 1600 nm at the same time with high gain, it consists of a
length of Erbium doped fiber, a laser diode (used as a pump) and wavelength selective coupler to combine the
signal and pump wavelength [4].
EDFA has three Categories:
1- In-line amplifiers:
Installed between transmitter and receiver.
2- Power Boosters:
Installed after transmitter output.
3- Pre-amplifiers:
Installed in front of the receiver.
This paper briefly discusses the performance of EDFA and SOA in optical transmission systems using
simulation approach (Optisystem v7.0). Optisystem software is a modern simulator tool for designing, testing
and optimizing of the optical systems. It is used to design and plan the optical systems models and present the
analysis and results of scenarios visually. It is based on realistic of optical fiber communication systems [1].
II. Methodology
In analyzing and designing optical networks, there are several methods can be used. For this study
simulation approach is used. Optisystem software v7.0 was selected to use in designing two optical systems one
is using EDFA and SOA for the other one.
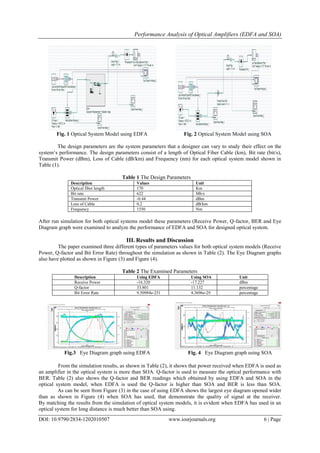
Each system has simulated by the same set of parameters, and each system consists of Transmitter,
Optical Amplifier (EDFA/SOA), Optical Fiber Cable, Receiver (Photo Detector and LPF), Power Meters and
Eye Diagram Analyzer, as shown below in Fig. (1) and Fig. (2).](https://image.slidesharecdn.com/b1202010507-170704051454/85/Performance-Analysis-of-Optical-Amplifiers-EDFA-and-SOA-1-320.jpg)
![Performance Analysis of Optical Amplifiers (EDFA and SOA)
DOI: 10.9790/2834-1202010507 www.iosrjournals.org 7 | Page
IV. Conclusion
In this work, Optisystem is used as a simulation tool to design and study optical transmission network
model using EDFA and SOA and analyze their performance; the simulative analysis presented a gradual
decreasing in BER and increasing in Q-factor when EDFA has used, besides that displayed wide open in Eye
Diagram and received high power. By compared and analyzed the two optical system simulation model results,
the performance of SOA is dissimilar to EDFA, the SOA has greater noise and worse gain, therefore using
EDFA in an optical system which has a long distance between transmitter and receiver is better than using SOA.
References
[1] Aashima Bhardwaj and Gaurav Soni, Performance Analysis of 20Gbps Optical Transmission System Using Fiber Bragg Grating,
International Journal of Scientific and Research Publications, Volume 5, Issue 1, January 2015, ISSN 2250-3153.
[2] Home Birla Institute of Technology and Science, C10 Optical Amplifiers - Optical Amplifiers Chapter 10,
https://www.coursehero.com/file/12879505/C10-Optical-Amplifiers/.
[3] Audra Bond, Chapter 6 Optical Amplifiers, http://slideplayer.com/slide/7680367/.
[4] School of Electronic and Communications Engineering, Unit 1.5 Optical Amplifiers,
http://www.electronics.dit.ie/staff/tfreir/optical_2/Unit_5.ppt.
[5] Sham Arsenal, Optical Amplifiers -The need, Types, Working Principle and Comparison, http://www.slideshare.net.](https://image.slidesharecdn.com/b1202010507-170704051454/85/Performance-Analysis-of-Optical-Amplifiers-EDFA-and-SOA-3-320.jpg)