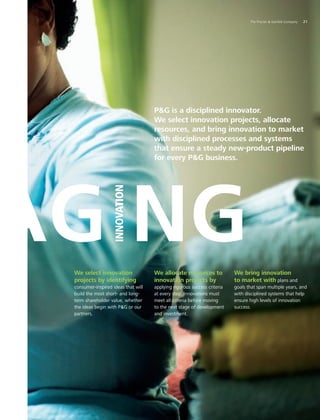
Designed to Innovate
2008 Annual Report
Contents
Letter to Shareholders 2
Defining Innovation 10	
Investing in Innovation 14
Managing Innovation 18
Delivering Innovation 22
Leading Innovation 26
Financial Contents 35
Corporate Officers 77
Board of Directors 78
Shareholder Information 79
11-Year Financial Summary 80
PG at a Glance 82
Financial Highlights
Financial Summary (Unaudited)
Amounts in millions, except per share amounts					 2008	 2007	 2006	 2005	 2004
Net Sales						 $83,503	 $76,476	 $68,222	 $56,741	 $51,407
Operating Income						 17,083	 15,450	 13,249	 10,469	 9,382
Net Earnings						 12,075	 10,340	 8,684	 6,923	 6,156
Net Earnings Margin						 14.5%	 13.5%	 12.7%	 12.2%	 12.0%
Basic Net Earnings Per Common Share					 $   3.86	 $   3.22	 $   2.79 	 $   2.70 	 $   2.34
Diluted Net Earnings Per Common Share					 3.64	 3.04	 2.64	 2.53	 2.20
Dividends Per Common Share						 1.45	 1.28	 1.15	 1.03	 0.93
PG is designed to innovate
consistently and successfully
in every part of our business.
We define innovation broadly, in terms of what it is,
where it comes from, and who’s responsible for it.
We invest in innovation at industry-leading levels
with ongoing productivity savings.
We manage innovation with discipline.
We deliver innovation that builds consumer trust
and loyalty over time.
We lead innovation on leading global brands and
with an outstanding team of innovation leaders.
PG is Designed to Innovate… and to grow.
A.G. Lafley
Chairman of the Board and
Chief Executive Officer
1. 2001 EPS excludes $0.61 per share of costs from the Organization 2005 restructuring
program and amortization of goodwill and indefinite-lived intangible assets.
Note: An explanation and reconciliation of free cash flow and organic sales for 2008
is provided on page 55.
At the heart of PG’s design for growth is our capability to
innovate — broadly, reliably, and successfully, year after year, in
every part of our business. We innovate across more categories
and on more leading brands than any other consumer products
company. We have a broader range of science and technology
than any of our competitors. We invest more in innovation and
marketing support than any other consumer products company.
We deliver an unrelenting stream of innovation with systematic
discipline. And PG’s businesses are run by women and men
who are not only globally experienced general managers but
also highly skilled innovation leaders.
This helps PG deliver consistent, reliable innovation and reliable,
sustainable growth. Innovation drives growth.
We saw this in fiscal 2008, as PG delivered another year of
innovation-driven growth at or above the Company’s target
levels for sales, earnings-per-share and cash generation.
Fiscal 2008 Results
Net sales increased 9%, to $83.5 billion. Organic sales•	
increased 5%.
Diluted earnings per share increased 20%, to $3.64 per share.•	
Free cash flow from operating activities was $12.8 billion,•	
or 106% of net earnings, well ahead of the 90% cash
productivity target.
Fiscal 2008 was PG’s seventh consecutive year of organic sales
growth at or ahead of the long-term target range; brand and
new product innovations, particularly in developing markets,
accounted for virtually all this sales growth. Over the same period,
diluted earnings per share have grown at a compound average
growth rate of 13%,(1) well ahead of our long-term target.
We’ve generated more than $60 billion in free cash flow since
the beginning of the decade. Most importantly, we’ve delivered
consistently strong total shareholder return over the past ten-,
five-, three- and one-year periods, above the Dow Jones
Industrial Average.
Fellow PG Shareholders:
In last year’s annual report, I explained how PG is designed to grow.
We’ve designed a global, diversified business portfolio that enables PG to
grow consistently and reliably. We’ve developed the core strengths — consumer
understanding, brand-building, innovation, go-to-market capability, and scale — 
that are needed to win in the consumer products industry. We manage the
business with rigorous strategic, financial and operating discipline. We’ve built
the most diverse, globally experienced team of business leaders in PG’s
171-year history. These elements work in combination to ensure PG can
meet or exceed its growth targets reliably year after year.
2	 The Procter  Gamble Company
PG Report Card
Progress Against PG’s Goals and Strategies
Growth results
Average annual	 	 Goals	 2008	 2001–2008
Organic Sales Growth (1) 		 4 – 6%	 5%	 6%
Earnings-per-Share Growth	 10%+	 20%	 13%(2)
Free Cash Flow Productivity (3)	 90%+	 106%	 118%
Growth Strategies (2001–2008)
Grow from the core: Leading Brands, Big Markets,
Top Customers
Volume up 7%,
on average, for
PG’s 24 billion-
dollar brands (4)
Volume up 7%,
on average, for
PG’s top 16
countries (5)
Volume up 8%,
on average,
for PG’s top 10
retail customers (5)
Develop faster-growing, higher-margin, more asset-efficient
businesses
Beauty sales
more than
doubled to
$19.5 billion;
profits tripled to
$2.7 billion
Health Care
sales more than
doubled to
$14.6 billion;
profit increased
4-fold to
$2.5 billion
Home Care
sales more than
doubled; profits
more than tripled
Accelerate growth in developing markets and among
low-income consumers
Developing
market sales up
18% per year
Over one-third
of total company
sales growth
from developing
markets
Developing market
profit margins
comparable to
developed market
margins
(1) Organic sales exclude the impacts of acquisitions, divestitures and foreign exchange,
which were 6%, on average, in 2001-2008.
(2) 2001 EPS excludes $0.61 per share of costs from the Organization 2005 restructuring
program and amortization of goodwill and indefinite-lived intangible assets.
(3) Free cash flow productivity is the ratio of free cash flow to net earnings.
(4) Excludes the impact of adding newly acquired billion-dollar brands to the portfolio.
(5) Excludes impact of adding Gillette.
PG’s sales growth in fiscal 2008 came from a diverse mix of
businesses and was driven primarily by innovation.
Baby and Family Care organic sales increased 8%. Charmin•	
delivered double-digit organic volume growth behind the
introduction of Charmin UltraStrong and a complete restage
of the brand line-up. Pampers delivered double-digit volume
growth — and became PG’s first $8 billion brand — behind
the continued strength of Pampers Baby Stages of
Development. Bounty introduced Bounty Extra Soft and
upgraded Bounty Basic.
Fabric and Home Care grew organic sales 6%, driven by liquid•	
laundry detergent compaction — a disruptive innovation
rolled out across the entire North America laundry portfolio — 
along with strong product innovation on Tide, Gain, Ariel,
Downy, and Febreze.
Beauty organic sales increased 4%, behind the continuing•	
success of Olay Definity and Regenerist product innovation,
new product and package innovation on Head  Shoulders,
and a revolutionary new home hair-colorant called Perfect 10
on Nice ‘N Easy.
Grooming grew organic sales 4%, led by more than 40%•	
top-line growth on the superior Fusion male shaving system.
Fusion became PG’s 24th billion-dollar brand.
Health Care organic sales grew 3%, driven by strong innovation•	
across the Health Care business: Crest Pro-Health Night Paste
and Rinse, Oral-B Cross-Action Pro-Health Brush, Always Clean
and Always Fresh, and comfort upgrades on the Naturella
brand.
Snacks, Coffee and Pet Care organic sales increased 4%, led•	
by the launch of Dunkin Donuts® retail coffee, a number of
Pringles initiatives — including Rice Infusion, Extreme Flavors
and Pringles Stix — and Iams Proactive Health for dogs and
Healthy Naturals for cats.
Growth was broad-based across all geographic regions, with
mid-single-digit sales growth in developed markets and double-
digit sales growth in developing markets.
We successfully completed the integration of Gillette, exceeding
cost synergy and dilution targets. Revenue synergies are on target,
with significant upside potential over the next three to five years.
We’ve just begun to leverage the Gillette and Oral-B brands,
both strong platforms for innovation.
	 The Procter  Gamble Company	 3
On June 4, 2008, we announced our agreement to merge PG’s
coffee business with The J.M. Smucker Company. The agreement
maximizes the after-tax value of the coffee business for PG
shareholders and minimizes earnings-per-share dilution versus
other alternatives. We expect to complete the transaction during
the second quarter of fiscal 2009.
Sustaining Growth through Innovation
This is strong performance, but the challenge of sustaining
growth is greater today than at any time in the past 50 years.
Commodity and energy costs continue to rise for companies.
Consumers are facing higher food and gas prices, declining
home values, and rising levels of unemployment. The question
shareholders and prospective investors are asking is: ”How will
PG sustain growth in today’s challenging and uncertain
economic environment?”
The answer is clear to all of us at PG: we will continue
to innovate in every part of our business. Innovation is at
the heart of PG’s business model. It is the primary way we
delight consumers, create value with retail partners, and create
new business models to deliver consistent, sustainable growth at
or ahead of the Company’s goals.
A lot of companies talk about innovation, but PG has
demonstrated the capability — over decades — to innovate
consistently, reliably and successfully. We have a long list of
innovation firsts in our industry:
Tide was the first heavy-duty laundry detergent•	
Crest, the first fluoride toothpaste clinically proven to prevent•	
tooth decay
Downy, the first ultra-concentrated rinse-add fabric softener•	
Pert Plus, the first 2-in-1 shampoo and conditioner•	
Head•	  Shoulders, the first pleasant-to-use shampoo effective
against dandruff
Pampers, the first affordable, mass-marketed disposable diaper•	
Bounty, the first three-dimensional paper towel•	
Always, the first feminine protection pad with an innovative,•	
dry-weave topsheet.
Febreze, the first fabric and air care products that actually•	
remove odors from fabrics and the air
Crest White Strips, the first patented in-home teeth whitening•	
technology
PG continues to be one of the few companies in our industry
that creates new categories and brands, new performance
standards, and new definitions of consumer value. Swiffer and
Febreze created entirely new product categories. Crest Pro-Health,
Olay Regenerist and Definity, Pampers Baby Stages of
Development, and Tide with Bleach redefined high performance
in their categories. Olay innovation has created new consumer
experiences that are as good as — or better than — several-
hundred-dollar department and specialty store brands.
We innovate so consistently across our diverse portfolio of
businesses, and so consistently over time, because we’ve
created a unique design for innovation at PG.
1. We define innovation broadly.
2. We invest in innovation at industry-leading levels.
3. We manage innovation with discipline.
4. We deliver innovation that builds consumer trust
and loyalty over time.
5. We lead innovation with global brands and an
outstanding team of innovation leaders.
This integrated, end-to-end approach is complemented by
PG’s global scale and scope, which is unrivaled in our industry.
The result is an innovation design that enables PG to win with
consumers and retail customers and to generate sustainable
long-term growth and shareholder value.
Defining Innovation Broadly
We define innovation broadly. We innovate in every area where
our brands touch consumers’ lives: the package and product,
the shopping experience, the in-home product usage experience,
and every aspect of communication. We also create innovative
new business models and organizational structures. By innovating
so broadly, we get to see more innovation opportunities and to
leverage more innovation resources than more narrowly focused
competitors.
Our Family Care business is a good example. Twenty years ago,
we created a proprietary paper-making process that enables us to
produce the strongest, softest, most absorbent paper towels and
tissues on the market. But our approach to innovation in Tissues
and Towels is driven by consumers, not by the technology.
4	 The Procter  Gamble Company
Consumers don’t all want the same benefits from a brand like
Bounty. Some consumers want a paper towel designed for spills
and light cleaning; it’s important to them not to be wasteful.
We created Bounty Basic for these consumers, which is just right
for everyday tasks but not over-designed. We created Bounty
UltraStrong for consumers who value strength and absorbency
and Bounty Extra Soft for those who want more softness.
All these products use the same paper-making technology, but
provide highly tailored benefits to meet specific consumer needs.
We also tailor marketing and communications to specific
consumer needs. Bounty Basic consumers aren’t persuaded
by television advertising; they get all the brand communication
they need at the store shelf. Other consumers are receptive
to information about our brands at different times and places,
and we respond with communication and marketing plans
tailored to their desires and preferences.
We’re able to innovate broadly and successfully because we
engage consumers as co-designers of innovation. We live with
consumers in their homes, shop with them in stores, and observe
their daily behavior for days, weeks and even months at a time.
Consumers are active participants in PG’s innovation process,
and we keep them involved in every step that guides a new
product or idea from concept to launch.
We also involve external innovation partners to turbo-charge
PG’s internal innovative capability — an approach we call
“Connect and Develop.” Six years ago, only 15% of our product
initiatives included innovation from outside PG. Today, more
than half of all PG innovation includes an external partner.
In just the past year, we evaluated more than 5,000 innovation
opportunities from small entrepreneurs, universities, research
institutes, and large companies. This is a fourfold increase over
the number of external innovations we were considering at the
beginning of the decade.
Designed to Innovate
Defining
PG defines 	
innovation broadly
Investing
PG invests in innovation at
industry-leading levels
Managing
PG manages innovation 	
with disciplineDelivering
PG delivers innovation 	
that builds consumer trust
and loyalty over time
Leading
PG leads innovation with 	
global brands and outstanding
innovation leaders
	 The Procter  Gamble Company	 5
By defining innovation so broadly — what it is, where it comes
from, who’s responsible for it — we continually expand and
unleash PG’s innovation potential. The best proof of our
innovation capability is the number of top-selling new products
that come from PG. The IRI Pacesetters study tracks and
ranks the most successful new consumer products introduced in
the U.S. For the past 13 years, one-third of the most successful
Pacesetter products, on average, have come from PG and
Gillette — more than our top six competitors combined. In 2008,
5 of the 10 best-selling new products came from PG, including
Tide Simple Pleasures detergent, Febreze Noticeables air fresh-
ener, the new Herbal Essences line of products, Crest Pro-Health
toothpaste, and Olay Definity skin care products.
Investing in Innovation
Another point of difference is PG’s ability to invest in innovation
at industry-leading levels. We invest more than $2 billion a year
in RD, nearly twice the level of our closest competitor, Unilever,
and roughly equal to the combined total of our other major
competitors — Avon, Clorox, Colgate, Energizer, Henkel,
Kimberly Clark, L’Oreal, and Reckitt Benckiser. We also maintain
a high level of marketing investment in our brands. PG’s
advertising investment has averaged about 10% of sales over
the past 15 years.
We maintain this strong level of innovation and marketing
investment, while continuing to grow margins, by continually
increasing PG’s productivity. The more productive we become,
the more we can redeploy people and dollars to innovation.
PG has a strong track record of reliable productivity growth.
Sales per employee have grown more than threefold and net
earnings per employee are up eightfold since 1980. Over the
past 10 years, PG’s productivity on a sales-per-employee basis
has grown at an average rate of 6% a year. This performance is
more than twice the U.S. average of roughly 2.5% productivity
growth per year.
PG grows productivity so reliably because we take a very
systemic approach. A good example of this is Global Business
Services — PG’s shared services business model. Early this
decade, we significantly reduced the cost of business services
by centralizing and standardizing PG systems, infrastructure
and services. We then focused on improved service levels and
greater value creation, ultimately creating a global business
services organization that has been recognized externally as the
best shared-services organization in the world, and which has
delivered nearly $600 million of cumulative cost savings to date — 
a substantial portion of which we’ve reinvested in innovation.
In addition, GBS — in collaboration with our RD and Engineering
functions — is making PG a more productive and effective
innovator by accelerating the use of virtualization, computer
modeling and simulation. Virtualization is enabling PG brands
to co-design products with consumers. The same technologies
allow us to show retailers virtual in-store displays for half the
cost and less than half the time required for physical shelf
designs. Computer modeling and simulation saved PG about
17 years of design time in the last year alone.
We’re convinced we can become even more productive,
increasing productivity 7–8% a year. We’re making our brand
portfolio more productive by focusing even more on our largest
leading brands — the 44 brands with sales of $500 million or
more that represent 85% of sales and more than 90% of profits.
We’re getting more disciplined about how to manage the
remaining brands in PG’s portfolio, investing in small brands
that have potential to become billion-dollar brands of the future,
supporting brands that may not have global potential but are
local jewels in some markets, and consolidating or divesting
underperforming brands. And, we’re seizing even more
opportunities to leverage PG scale by eliminating duplicative
activities, centralizing more functional support, and consolidating
some small countries into regional hubs.
We’re also going after cost savings throughout the Company.
We have clearly defined goals for controlling overhead spending.
Businesses projected to grow significantly faster than the balance
of the portfolio have an overhead target equal to or less than
half their projected sales growth; slower-growing businesses
and all corporate functions are committed to zero overhead
growth; businesses growing below company goals and/or with
significant cost-structure issues must reduce overhead spending
every year. This discipline reflects our commitment to flat or
declining headcount for the foreseeable future.
These and other efforts throughout the Company are critical.
Productivity fuels innovation. Innovation drives growth.
Managing Innovation with Discipline
The next factor that sets PG apart as an innovator is discipline.
We don’t rely on “Eureka!” moments; we take a systematic
approach to innovation.
For example, we’re highly systematic about how we organize
for innovation. We don’t take a “one-size-fits-all” approach
but we’re deliberate about creating the right structure for
different kinds of innovation work. Our Corporate Innovation
Fund, for example, specializes in high-risk, high-reward ideas;
it’s essentially an in-house venture capital firm that does initial
concept, design, engineering, and qualification work and then
6	 The Procter  Gamble Company
hands over successful ideas to the appropriate business units.
The FutureWorks team focuses exclusively on innovations that
can create entirely new businesses. There are new-business
development teams in every global business unit focusing on
opportunities to create adjacent categories. Innovation centers
help us solve tough innovation challenges by providing simulated
in-home and in-store environments where PG teams can
isolate themselves and interact with consumers and shoppers
for days or even weeks at a time.
Once an idea is qualified and begins moving through our
product launch system, the innovation team continues to face
go / no-go gates at every critical milestone. At each gate, we
make decisions about which initiatives are ready to progress,
which need further work, and which should be stopped. Every
decision is grounded in maximizing the productivity of innovation
investments and generating shareholder value.
This disciplined approach is essential to innovation success.
It builds accountability into both the creative and executional
aspects of innovation. PG’s Family Care business is a good
example here, as well. Family Care is one of PG’s strongest
value-creating businesses. They’ve innovated broadly across
brand platforms — Bounty, Charmin and Puffs — while delivering
industry-leading, double-digit total shareholder return for the
past one-, three- and five-year periods in a highly capital-
intensive category. They’ve increased gross margins 7% and
have delivered free cash flow well above the Company’s 90%
cash productivity target for the past five years, despite invest-
ments in innovation and in new manufacturing capacity to
support growth.
There are similar stories in Fabric Care, Feminine Care, Baby
Care, Beauty Care, and Health Care. These are the results of
disciplined innovation.
Delivering a Steady Stream of Innovation
What I’ve explained so far — the way we think about innovation,
our ability to invest in it, and the discipline with which we
manage it — are the elements of PG’s innovation design that
are difficult to see from the outside. Each of these factors helps
to set PG apart as an innovator. What counts most, however,
is the innovation that consumers experience day after day,
year after year.
We earn consumer trust and loyalty over time by delivering an
unending stream of innovation that consumers learn to expect
from PG brands. We plan three-to-five years out and fill our
pipeline with three distinct kinds of innovation.
Disruptive innovation•	 creates new categories, new segments,
or entirely new sources of consumer consumption. These are
innovations that address consumer needs no other brand or
product has met. Virtually all of PG’s billion-dollar brands
were created with disruptive innovations.
Sustaining innovation•	 is what we focus on most. These are
extensions or improvements of existing products: big initiatives
that meet consumer needs by filling gaps, eliminating consumer
trade-offs, or providing new benefits. Examples include
Pampers Caterpillar-Flex, which improved the fit and comfort
of baby diapers, and Crest Pro-Health Rinse, the Crest brand’s
entry into the mouth-rinse category adjacent to toothpastes.
Commercial innovation•	 generates trial on existing products
without a product or package change. Examples include the
Gillette Champions and Pampers Unicef programs, marketing
efforts that give consumers new reasons to be interested in
and loyal to a PG brand.
Always is a great example of how this multidimensional
innovation strategy builds loyalty and category leadership.
We introduced Always in 1984 as the first feminine protection
pad with an innovative, dry-weave topsheet. In 1986, the
brand set yet another performance standard with its proprietary
“wings” product, followed by Ultra Thin products in 1991.
These three disruptive innovations brought years of competitive
advantage. In addition to these disruptive innovations, we have
maintained a steady pace of product upgrades with sustaining
innovations like Always Fresh, Always Clean and Always
Overnight. This year, Always is leading innovation again, with a
disruptive initiative called Always Infinity that uses a unique pad
design and new, state-of-the-art technology to bring a new
level of superior protection and absorbency to consumers.
Always has also delivered a steady stream of meaningful
commercial innovation. The brand’s school education programs
teach girls about puberty, and introduce them to the category
and our brands. Another commercial innovation, from both
Always and Tampax, is beinggirl.com, a unique website that
enables teens to get information in a safe, discreet environment
and to interact with peers facing similar life-stage issues.
This combination of disruptive, sustaining and commercial
innovation keeps a brand like Always growing year after year.
Always has grown in 21 of the 24 years since launch and has
increased its U.S. market share from 14% to 48%, and today
has a global share of 31%. There are examples like Always
throughout PG’s brand portfolio.
	 The Procter  Gamble Company	 7
Leading Innovation
Making PG’s design for innovation work is the job of leadership.
Innovation is a human activity and leaders must unleash the
creativity, initiative, leadership, and productivity of the innovators
in their businesses. This requires a blend of intelligence and
empathy. Empathy is incredibly important in a diverse, people-
intensive business like ours. Most of our creativity and innovation
happens in teams, and often the teammates are working in
different parts of the world.
To lead in this kind of environment, we need a balance of
intellectual skills and empathic skills. We have to develop the
intuition to understand and appreciate people’s intentions,
feelings and motivations — all of which have been shaped by
experiences that may be sharply different from those we’ve
grown up with ourselves.
At the same time, innovation leaders must be decision-makers.
They must exercise the judgment and the courage to take
innovation risks and to understand the role fast failure plays in
the innovation process, while also being willing to stop projects
and reallocate resources to bigger innovation opportunities
when necessary.
I’m a big believer that innovation leaders are made, not born.
They learn to get comfortable with uncertainty. They learn to
become more open-minded, to co-create with consumers, and
to be receptive to ideas from different disciplines and industries.
They learn to become both strategists and operational managers,
to be agile and disciplined. As they learn and gain experience,
they become more effective at leveraging PG’s design for
innovation to deliver consistent, sustainable growth.
The ability to lead effective innovation programs is required at
PG, particularly at the general manager and president levels.
Good innovation leaders need to be cultivated and promoted — 
and I hold myself accountable for helping to select and develop
the innovation leaders who run PG businesses around the
world. Ensuring PG has the leaders and the pipeline to innovate
for the next ten years is one of my most fundamental
responsibilities as chief executive.
Leveraging Global Scale and Scope
The most differentiating aspect of PG’s approach to innovation
is the scale and scope of our business and brand portfolio,
science and technology platforms, and geographic reach.
The diversity of our business portfolio creates highly valuable
scale benefits. Our Health  Beauty businesses take advantage
of purchasing pools created by Household businesses such as
laundry, diapers and paper products. This enables them to
purchase packing materials and basic commodities at lower
prices than their direct competitors. Similarly, Household Care
enjoys economies of scale created by the large advertising
budgets supporting our Health  Beauty Care businesses.
We use these scale advantages to invest in innovation.
The diversity of PG’s brand portfolio gives us the opportunity
to innovate in more aspects of consumers’ lives than nearly any
other company. PG brands are in every room of the house, at
virtually every hour of the day. As a result, we get to see more
of consumers’ needs than other companies. This helps us spot
more problems PG innovation can help solve and more
aspirations PG brands can help achieve.
Our science and technology portfolio is another huge scale
advantage. Bleach technology from Laundry has been used in
Health  Beauty Care products such as Crest White Strips and
Nice ‘n Easy Perfect 10 Hair Colorant. Non-woven top sheet
technology started in Diapers, traveled to Feminine Care then
moved to Swiffer and Olay Daily Facials. Proprietary perfume
technology has been used to enhance the performance of
Bounce, Febreze, Fine Fragrances, Camay and most recently
Secret and Gillette Clinical Strength deodorant. We’re now
combining Gillette’s expertise in mechanical engineering with
our expertise in chemical engineering.
Companies that compete primarily in Beauty can’t benefit from
such technology transfer because they don’t have a Laundry
business. Home Care competitors can’t move a substrate
technology from diapers or feminine hygiene if they’re not in
those businesses. There is no other company in our industry
whose portfolio of businesses and brands, sciences and
technologies is as broad, as deep or as diverse as PG’s. This is
a very significant source of competitive advantage. We use our
diverse mix of sciences and technologies to make innovation
connections that other companies cannot make on their own.
Another area in which we can leverage PG scale is our
geographic reach. In developed markets like the U.S., where PG
brands can be found in virtually every household, we leverage
household penetration as a scale advantage. In developing
markets, we’re using our portfolio of leading brands to attract
and build a network of best-in-class, often exclusive distributors
in countries such as China, India and Russia. Today our distributor
network in China reaches about 800 million people. In India,
our distributor network covers 4.5 million stores, an increase of
two million stores in just five years. In Russia, we now have
access to 80% of the population.
8	 The Procter  Gamble Company
PG’s global scale allows us to quickly flow innovation across
developing countries. We create innovation to meet consumer
needs in a particular region and then quickly flow that technology
across multiple countries faster than competition. For example,
consumers who wash clothing by hand need improved rinsing
with less water. This is a common need in many developing
countries. We launched Downy Single Rinse in Mexico, and
have since expanded it into 12 countries, including China,
the Philippines, and Peru. We did the same with Naturella, an
innovative feminine protection product created specifically for
low-income consumers in Latin America; we’re now expanding
Naturella throughout Eastern Europe. We’ve created highly
cost-effective laundry detergent formulations that we’ve
expanded rapidly across developing markets. We’ve created
a “better and cheaper” dentifrice formulation for Crest that
was first introduced in China and has now been expanded into
Eastern European markets — and has also been introduced as
an important cost innovation in several developed markets.
We’re able to do all this because we’ve built the systems and
go-to-market scale that allow us to move an entire innovation — 
concept, brand, product formulation, package, marketing, and
in-store presence — to multiple markets almost simultaneously.
With this geographic reach and capability, in developed and
developing markets alike, we can expand innovation around the
world and into millions of homes very quickly.
Designed to Innovate — and Grow
We’ve built PG’s business model around innovation because
it’s the primary driver of superior consumer value and profitable
organic sales growth in the consumer products industry. The
companies that lead innovation are growth catalysts and generally
capture a substantial portion of the growth they stimulate.
I don’t know of a company that has sustained growth and
industry leadership over the long term that has not also been
the innovation leader.
Innovation is especially important in tough economic periods.
Consumers will continue to buy premium-priced products as
long as they’re confident they’re getting value for their money.
This is why innovation is so important. Price is an element of
value, but the real driver of value perception is relative pricing,
not absolute pricing, combined with product performance and
brand equity. Innovation drives value. It differentiates our
brands in the hearts and minds of consumers. It enables category
leadership. It stimulates growth and prevents commoditization
of the categories in which we compete. It drives premium
pricing and higher gross and operating margins.
This reality plays to PG strengths as an innovator. We innovate
more broadly than any other company in our industry. We invest
more in innovation and marketing support. We bring a richer
mix of innovation to market with greater discipline and strong
leadership. We’ve designed an innovation capability that is
unmatched in the consumer products industry.
Most important of all, PGers around the world see innovation
as their job. They look for opportunities to innovate in every
part of the business. Consumer researchers are developing
innovative new ways to learn from consumers. Marketers are
finding new ways and new places to engage consumers.
Technicians operating lines in PG plants are creating innovative
ideas for making products better, faster and cheaper. Innovation
has always been at the heart of PG’s business model, but
today it’s not the province of only one or two functions within
the Company. Innovation is the focus of our entire organization.
PG’s innovation capability is stronger and more robust today
than at any time in the Company’s history — and this is why I’m
confident innovation will continue to be the primary driver of
sustainable sales and earnings-per-share growth at or ahead of
PG’s long-term targets.
PG is designed to innovate, and to grow.
A.G. Lafley
Chairman of the Board
and Chief Executive Officer
August 12, 2008
	 The Procter  Gamble Company	 9
DEFIN
IN NG
INNOVATION
PG defines innovation broadly — 
what it is, where it comes from, and
who’s responsible for it.
What innovation is at PG:
It’s everything we do that improves
the value consumers get from
putting their trust in PG brands.
Innovation ranges from product
formulation, package design and
consumer communications to
supply systems, business models
and organizational productivity.
Where innovation
comes from at PG:
Inside, across 22 global product
categories and more than a hundred
technology areas. Outside, from
nearly two million potential innova-
tion partners worldwide. Learn
more about how PG connects
to external innovation partners at
www.pgconnectdevelop.com.
Who’s responsible for
innovation at PG:
In a word, everyone. We maintain
strict accountability for innovation
success, but we encourage all
PGers to innovate. We are all
challenged to find new ways of
delivering a better brand experience
at a lower cost, which ultimately
drives superior consumer value.
	 The Procter  Gamble Company	 13
N NG
INNOVATION
Head  Shoulders is now the
best-selling shampoo in the
world. By innovating broadly,
Head  Shoulders doubled its
global sales in just five years.
Consumer Insights
Great innovation begins with a deep understanding of
current and potential consumers. Most consumers felt
Head  Shoulders delivered good dandruff control, but
many assumed they had to trade off beauty benefits.
This research clearly defined the brand team’s challenge
in developing new product, package and marketing
innovations.
Product Innovation
The challenge: keep improving antidandruff performance
while innovating to satisfy consumers’ beauty desires.
A new focus on scalp health as the first step toward
beautiful hair has appealed to a broad range of consumers
beyond those concerned with dandruff. In addition,
line extensions, such as “Sensitives,” have appealed to
consumers with sensitive scalps, and on-package
endorsements from dermatological associations have
helped drive trial.
Package and Graphics Innovation
The simple, elegant curve of the new Head  Shoulders
bottle design conveys the softer, more cosmetic side
of the brand, while the bottle’s straight side reflects
the strength and efficacy that consumers expect from
Head  Shoulders. The dramatic, intuitive graphic has
strengthened brand equity and made it much easier
for consumers to find the product that’s right for them.
Marketing Innovation
The package curve has become a consistent design
feature in all global consumer communications,
including TV, print, Internet and outdoor advertising.
This consistent graphic look has helped build equity
in the Head  Shoulders brand at every consumer
touch-point.
Go-to-Market Innovation
The business team developed a tool to evaluate scalp
health and recommend the right Head  Shoulders
product. Millions of scalp evaluations have been done
in and near retail stores around the world, helping
consumers take the first step toward healthy,
beautiful hair.
Supply Chain Innovation
PG’s hair care RD and supply chain experts developed
creative solutions to produce the challenging new
package along with selective product formulation
improvements in record time. The new, equity-enhancing
package was launched in more than 140 countries in
just nine months, yielding amazing speed-to-market to
delight Head  Shoulders consumers around the world.
Head  Shoulders now generates about
$2 billion in annual sales for PG. With strong
momentum and a robust innovation pipeline,
Head  Shoulders should remain one of
PG’s fastest-growing billion-dollar brands.
	 The Procter  Gamble Company	 12
INVES
ININNOVATION
ST NG
PG invests more in innovation and
marketing support than any other
consumer products company. This level
of investment is funded primarily by
ongoing productivity efforts and rigorous
cost discipline.
Productivity and cost
savings discipline are deeply
ingrained in PG’s culture. Every
organization has specific goals
for cost savings and productivity
improvements, and we manage
restructuring work as an ongoing
business activity.
Steady investment in
innovation and brand
building is a top priority in
both good times and challenging
times alike. Decades of experience
have taught us that building
strong, innovation-leading brands
that deliver superior consumer
value is the best way to deliver
consistently strong value creation
for shareholders.
	 The Procter  Gamble Company	 17
ININNOVATION
ST NG
Maintaining consistent investment
in innovation and marketing requires
a relentless focus on productivity
improvements and cost savings.
Innovation, Productivity
 Growth
Innovation, productivity and
growth is a virtuous cycle at PG.
In our industry, innovation and
productivity are the key drivers of
profitable organic sales growth.
Innovation creates superior
consumer value, differentiates
brands, and prevents the
commoditization of categories.
Productivity fuels investment in
innovation and brand-building,
acting as an engine of both top-
and bottom-line growth.
Historical Productivity
Improvement
PG’s organizational productivity
has increased both significantly
and consistently over the years.
Since 1980, it has jumped more
than threefold, growing at a
compound average rate of nearly
5% a year — more than twice the
broad-based U.S. productivity rate.
Net earnings per employee are up
more than eight-fold, growing at
an average of nearly 8% per year.
Productivity  Savings Projects
We are constantly improving productivity in all
areas of the business and all elements of cost.
Net Sales
- Cost of Products Sold
Raw  Packaging Materials
Manufacturing Expenses
Finished Product Logistics
- Selling, General 
Administrative Costs
Marketing
Sales
Research
Administration
Operating Profit
- Interest Expense
- Other Income Expense
Pretax Profit
- Taxes
Net Earnings
PG researchers are continually searching for new formulations
and designs that lower cost, improve performance and increase
value for consumers. For instance, new formulations of
laundry detergents significantly reduced our use of packaging
material, leading to cost savings, more consumer convenience
and less waste for the environment.
materials
productivity
We are building more local, multi-category manufacturing
plants closer to the consumer, enabling local materials
sourcing, lower distribution costs, and lower import duties.
This also helps PG build strong international relationships
and deepens our understanding of local consumer needs.
manufacturing
productivity
We are generating cost savings in shipping and warehousing
while improving service levels to customers by optimizing the
Company’s finished-product supply chain, including cutting
the number of distribution centers in half.
distribution
productivity
All of PG’s major global brands have changed their mix
of marketing tools to reach target consumers more cost
effectively. In Feminine Care, for instance, Always and Tampax
have reduced TV advertising budgets in favor of higher-return
magazine ads and our “BeingGirl.com” website.
marketing
productivity
PG is reducing go-to-market costs with streamlined
organization designs in developing markets, smaller local
organizations, and faster decision-making. We are
implementing these designs in the Latin America, Central
and Eastern Europe and ASEAN markets.
go-to-market
productivity
PG has reduced RD costs as a percentage of sales,
increased the value of the innovation pipeline and led the
industry in innovation delivered to market by leveraging
a global network of external innovation partners.
rd
productivity
PG is driving down overhead costs as a percentage of
sales by reducing senior management positions, cutting the
number of managers on international assignments, moving
toward a corporate shared services structure, and reducing
staffing duplication among global, regional and local
organizations.
organizational
productivity
	 The Procter  Gamble Company	 16
MANA
AG NG
INNOVATION
PG is a disciplined innovator.
We select innovation projects, allocate
resources, and bring innovation to market
with disciplined processes and systems
that ensure a steady new-product pipeline
for every PG business.
We select innovation
projects by identifying
consumer-inspired ideas that will
build the most short- and long-
term shareholder value, whether
the ideas begin with PG or our
partners.
We allocate resources to
innovation projects by
applying rigorous success criteria
at every step. Innovations must
meet all criteria before moving
to the next stage of development
and investment.
We bring innovation
to market with plans and
goals that span multiple years, and
with disciplined systems that help
ensure high levels of innovation
success.
	 The Procter  Gamble Company	 21
AG NG
INNOVATION
1 2
Game-changing innovations like
2x concentrated liquid laundry
detergents are successful because
we apply a disciplined, systematic
approach to innovation
management.
PG’s
Innovation
Process
Search  Discover.
Great innovation ideas come from many places,
including consumers, customers, external partners,
and our own research. Many small investments are
made to test the viability of new ideas, focusing on
the long-term market potential of a new technology
or product concept. Each year, PG researchers
and business development professionals explore an
estimated 5,000 new innovation ideas.
Select  Resource.
With the data from the initial research phase,
our disciplined selection process allocates limited
resources — human and financial — to the most
promising innovation opportunities. Projects are
sometimes combined to create even bigger con-
sumer opportunities while conserving resources.
PG spends over $2 billion each year on RD,
by far the most in the consumer products industry — 
but each dollar of research funding and each hour
of research time is treated like a scarce commodity.
3 4
Design  Qualify.
Next, multifunctional teams — including
professionals from product research, marketing,
manufacturing, engineering, finance, and other
functions — develop comprehensive plans to deliver
against challenging success criteria. They leverage
best-in-class tools, including virtual product and
package design and consumer testing, to qualify
each idea technically, conceptually and financially
before it is approved for market launch. PG has
built world-class expertise in 11 core technology
areas, each critical to creating and qualifying
winning innovations in our product categories.
Launch  Leverage.
Finally, an innovation is introduced to consumers
and retail customers along with a plan to help
deliver key business objectives, including retail
distribution, correct pricing, consumer trial,
repeat purchase, and ultimately sales and profit.
The performance of a new innovation is monitored
and measured against these goals. We routinely
modify plans to keep new innovations growing for
years after launch, and many new brands and
products are still building consumer trial after years
in the market.
	 The Procter  Gamble Company	 20
DELIVE
VER NG
INNOVATION
PG delivers a consistent stream of
innovation with a balanced combination
of disruptive, sustaining and commercial
innovations.
Disruptive innovation
at PG is innovation that creates
new product categories, stimulates
new consumer consumption, or
resets performance standards in
existing categories.
Sustaining innovation
at PG is the relentless stream of
product, package, and other
improvements that keep brands
growing in the years following
big, disruptive innovations.
Commercial innovation
at PG is marketing, communica-
tions, and in-store innovations that
build consumer awareness and
trial between product or package
improvements.
	 The Procter  Gamble Company	 25
ER NG
INNOVATION
Gillette has built the leading male
grooming business in the world
by delighting consumers with a
consistent stream of innovation that
improves the consumer experience
and strengthens brand equity.
Mach3 turbo
2002
Improved blade
and lubricating strip
technology, delivering
the closest, most
comfortable shave to
date with less irritation
M3power
2005
M3Power ra
inspired by h
performance
young guns
2004
New marketing
campaign including
top NASCAR drivers
world cup
1994
Gillette was a leading
World Cup sponsor
from 1960 to 2006
sensor excel
1993
The addition of five
flexible microfins for
a closer shave
trac II plus
1988
The addition of the
lubricating strip onto
the Trac II blade
cartridges
m3 power
2004
First powered razor
with improved blade
technology
Atra plus
1985
The first razor with
a lubricating strip
for increased glide
Trac II
1971
Gillette’s first
twin-blade
shaving system
for a closer shave
Mach3
1998
World’s first triple-blade razor,
taking shaving performance to
a new level
Sensor
1990
The first razor with
spring-mounted blades
for increased closeness
and comfort
Atra
1977
The first razor with
a pivoting head to
hug the contours
of the face
The Gillette innovation portfolio
Every seven or eight years, Gillette launches an entirely new
platform, such as Gillette Fusion, that sets a new standard for the
brand and for the category. We enhance product performance and
brand equity between these disruptive innovations with meaningful
product and design initiatives every 12 to 18 months. In addition,
we maintain a steady pace of commercial innovation. This mix
keeps brands like Gillette growing year after year, often for decades.
Fusion Phantom
2007
Fusion razor
featuring a new
sleek, black design
Fusion Phenom
2008
New razor
color leveraging
“Gillette Champions”
commercial innovation
Champions
2008
New marketing
campaign featuring
three of the world’s
top athletes
r nitro
azor
high-
e vehicles
Disruptive Innovation
Sustaining Innovation
Commercial Innovation
Fusion / Fusion Power
2006
First five-blade shaving system
with unique trimmer blade,
setting a new standard for
shaving closeness and comfort
	 The Procter  Gamble Company	 24
LEAD
26	 The Procter  Gamble Company
D NG
INNOVATION
PG people and PG brands are the
innovation leaders of the consumer
products industry.
PG people are innovation
leaders who know how to inspire
and manage innovation with
creativity and discipline. The ability
to lead effective innovation
programs is required at PG,
particularly at the general manager
and president levels.
PG brands — PG’s 44 largest
brands — 24 that generate over
$1 billion in annual sales and 20
with sales between $500 million
and $1 billion — are global plat-
forms for innovation. They enable
us to commercialize innovation
faster, more effectively and more
efficiently than would be possible
on smaller, less successful brands.
	 The Procter  Gamble Company	 27
10
16
1
3
7
6
2
4
5
8
9
11
12
17
15
22
20
13
14
18
21
19
1. Jon Moeller
Vice President and
Treasurer
2. Valarie Sheppard
Vice President and
Comptroller
3. Keith Harrison
Global Product Supply
Officer
4. Mariano Martin
Global Customer Business
Development Officer
5. Nancy Swanson
Vice President — Corporate
6. Filippo Passerini
President — Global
Business Services and Chief
Information Officer
7. Joan Lewis
Vice President — Global
Consumer and Market
Knowledge
8. Moheet Nagrath
Global Human Resources
Officer
9. Steve Jemison
Chief Legal Officer
and Secretary
10. Giovanni Ciserani
President — Western
Europe
11. Bruce Brown
Chief Technology Officer
12. Claudia Kotchka
Vice President — Design
Innovation  Strategy
13. Charlotte Otto
Global External Relations
Officer
14. Jim Stengel
Global Marketing Officer,
Retiring
15. Marc Pritchard
Global Marketing Officer
16. Laurent Philippe
Group President — Central
 Eastern Europe, Middle
East  Africa
17. Deb Henretta
Group President — Asia
18. Daniela Riccardi
President — Greater China
19. Werner Geissler
Vice Chairman—
Global Operations
20. Jorge Uribe
President — Latin America
21. Steve Bishop
President — North America
22. Jeff Schomburger
President — Global
Wal-Mart Team
23. Jamie Egasti
President — Coffee
24. John Goodwin
President — Global Snacks
 Pet Care
28	 The Procter  Gamble Company
26
27
28
30
31
33
34
36
37
38
39
41
40 42
35
32
29
23
25
24
25. Melanie Healey
Group President — Global
Feminine  Health Care
26. Rob Steele
Vice Chairman — Global
Health  Well-Being
27. Dimitri
Panayotopoulos
Vice Chairman — Global
Household Care
28. Charlie Pierce
Group President — Global
Oral Care
29. Tom Finn
President — Global Health
Care
30. Martin Riant
Group President — Global
Baby Care
31. Jorge Mesquita
Group President — Global
Fabric Care
32. David Taylor
Group President — Global
Home Care
33. Juan Pedro
Hernandez
President — Braun
34. Gina Drosos
President — Global
Personal Beauty
35. Mary Lynn
Ferguson-McHugh
President — Family Care
36. Mark Bertolami
President — Duracell
37. Sharon Mitchell
Senior Vice President — 
Research  Development,
Global Fabric Care
38. Ed Shirley
Vice Chairman — Global
Beauty  Grooming
39. Chip Bergh
Group President — Global
Personal Care
40. Chris de Lapuente
Group President — Global
Hair Care
41. Hartwig Langer
President — Global
Prestige Products
42. Robert Jongstra
President — Global
Professional Care
(Not pictured)
Ravi Chaturvedi
President — Northeast Asia,
Retiring
Gil Cloyd
Chief Technology Officer,
Retiring
	 The Procter  Gamble Company	 33
Since the beginning of the decade, PG has more
than doubled the number of brands in its portfolio
thatgenerateoverabilliondollarsinannualsales — 
from 10 to 24. The most recent addition to the
billion-dollar brand club is Gillette Fusion, which
went from launch to billion-dollar stature in just
two years, the fastest in PG history.
Global Beauty  Grooming
Billion-Dollar
Brands
29	 The Procter  Gamble Company
Global Household Care
PG’s brand portfolio now includes 20 brands
that generate between $500 million and $1 billion
in annual sales. Combined with the billion-dollar
brands, PG’s top 44 brands account for more
than 85% of PG sales and 90% of profits.
Global Health  Well-Being
$500 Million
to $1 Billion
The Procter  Gamble Company	 32
Susan Arnold
President — 
Global Business Units
Bob McDonald
Chief Operating Officer
Ed Shirley
Vice Chairman — 
Global Beauty  Grooming
Clayt Daley, Jr.
Vice Chairman and
Chief Financial Officer
Rob Steele
Vice Chairman — 
Global Health  Well-Being
A.G. Lafley
Chairman of the Board and
Chief Executive Officer
Dimitri Panayotopoulos
Vice Chairman — 
Global Household Care
Werner Geissler
Vice Chairman — 
Global Operations
Executive Leadership
From left to right:
34	 The Procter  Gamble Company
The Procter  Gamble Company	 35
Financial Contents
Management’s Responsibility for Financial Reporting		 36
Management’s Report on Internal Control
over Financial Reporting					 37
Reports of Independent Registered Public Accounting Firm		 37
Management’s Discussion and Analysis
Overview					 39
Summary of 2008 Results					 42
Forward-Looking Statements				 42
Results of Operations					 42
Segment Results					 44
Financial Condition					 49
Significant Accounting Policies and Estimates			 51
Other Information					 54
Audited Consolidated Financial Statements
Consolidated Statements of Earnings				 56
Consolidated Balance Sheets				 57
Consolidated Statements of Shareholders’ Equity		 58
Consolidated Statements of Cash Flows			 59
Notes to Consolidated Financial Statements			 60
36	 The Procter  Gamble Company	
Management’s Responsibility for Financial Reporting
At The Procter  Gamble Company, we take great pride in our long
history of doing what’s right. If you analyze what’s made our company
successful over the years, you may focus on our brands, our marketing
strategies, our organization design and our ability to innovate. But if
you really want to get at what drives our company’s success, the place
to look is our people. Our people are deeply committed to our Purpose,
Values and Principles. It is this commitment to doing what’s right that
unites us.
This commitment to doing what’s right is embodied in our financial
reporting. High-quality financial reporting is our responsibility — one we
execute with integrity, and within both the letter and spirit of the law.
High-quality financial reporting is characterized by accuracy, objectivity
and transparency. Management is responsible for maintaining an
effective system of internal controls over financial reporting to deliver
those characteristics in all material respects. The Board of Directors,
through its Audit Committee, provides oversight. We have engaged
Deloitte  Touche LLP to audit our Consolidated Financial Statements,
on which they have issued an unqualified opinion.
Our commitment to providing timely, accurate and understandable
information to investors encompasses:
Communicating expectations to employees. Every employee — 
from senior management on down — is required to be trained on the
Company’s Worldwide Business Conduct Manual, which sets forth
the Company’s commitment to conduct its business affairs with high
ethical standards. Every employee is held personally accountable for
compliance and is provided several means of reporting any concerns
about violations of the Worldwide Business Conduct Manual, which
is available on our website at www.pg.com.
Maintaining a strong internal control environment. Our system of
internal controls includes written policies and procedures, segregation
of duties and the careful selection and development of employees. The
system is designed to provide reasonable assurance that transactions
are executed as authorized and appropriately recorded, that assets
are safeguarded and that accounting records are sufficiently reliable
to permit the preparation of financial statements conforming in all
material respects with accounting principles generally accepted in the
United States of America. We monitor these internal controls through
control self-assessments conducted by business unit management.
In addition to performing financial and compliance audits around the
world, including unannounced audits, our Global Internal Audit
organization provides training and continuously improves internal
control processes. Appropriate actions are taken by management to
correct any identified control deficiencies.
Executing financial stewardship. We maintain specific programs
and activities to ensure that employees understand their fiduciary
responsibilities to shareholders. This ongoing effort encompasses
financial discipline in strategic and daily business decisions and brings
particular focus to maintaining accurate financial reporting and
effective controls through process improvement, skill development
and oversight.
Exerting rigorous oversight of the business. We continuously review
business results and strategic choices. Our Global Leadership Council
is actively involved — from understanding strategies to reviewing key
initiatives, financial performance and control assessments. The intent
is to ensure we remain objective, identify potential issues, continuously
challenge each other and ensure recognition and rewards are appro-
priately aligned with results.
Engaging our Disclosure Committee. We maintain disclosure controls
and procedures designed to ensure that information required to be
disclosed is recorded, processed, summarized and reported timely and
accurately. Our Disclosure Committee is a group of senior-level execu-
tives responsible for evaluating disclosure implications of significant
business activities and events. The Committee reports its findings to
the CEO and CFO, providing an effective process to evaluate our
external disclosure obligations.
Encouraging strong and effective corporate governance from our
Board of Directors. We have an active, capable and diligent Board
that meets the required standards for independence, and we welcome
the Board’s oversight. Our Audit Committee comprises independent
directors with significant financial knowledge and experience. We
review significant accounting policies, financial reporting and internal
control matters with them and encourage their independent discussions
with external auditors. Our corporate governance guidelines, as well
as the charter of the Audit Committee and certain other committees
of our Board, are available on our website at www.pg.com.
PG has a strong history of doing what’s right. Our employees embrace
our Purpose, Values and Principles. We take responsibility for the quality
and accuracy of our financial reporting. We present this information
proudly, with the expectation that those who use it will understand
our company, recognize our commitment to performance with integrity
and share our confidence in PG’s future.
A.G. Lafley	 Clayton C. Daley, Jr.
Chairman of the Board	 Vice Chairman and
and Chief Executive Officer	 Chief Financial Officer
The Procter  Gamble Company	 37
Management’s Report on Internal Control over Financial Reporting
Report of Independent Registered Public Accounting Firm
Management is responsible for establishing and maintaining adequate
internal control over financial reporting of The Procter  Gamble
Company (as defined in Rule 13a-15(f) under the Securities Exchange
Act of 1934, as amended). Our internal control over financial reporting
is designed to provide reasonable assurance regarding the reliability
of financial reporting and the preparation of financial statements for
external purposes in accordance with generally accepted accounting
principles in the United States of America.
Strong internal controls is an objective that is reinforced through our
Worldwide Business Conduct Manual, which sets forth our commit-
ment to conduct business with integrity, and within both the letter
and the spirit of the law. The Company’s internal control over financial
reporting includes a Control Self-Assessment Program that is conducted
annually by substantially all areas of the Company and is audited by
the internal audit function. Management takes the appropriate action
to correct any identified control deficiencies. Because of its inherent
limitations, any system of internal control over financial reporting, no
matter how well designed, may not prevent or detect misstatements
due to the possibility that a control can be circumvented or overridden
or that misstatements due to error or fraud may occur that are not
detected. Also, because of changes in conditions, internal control
effectiveness may vary over time.
Management assessed the effectiveness of the Company’s internal
control over financial reporting as of June 30, 2008, using criteria
established in Internal Control — Integrated Framework issued by the
Committee of Sponsoring Organizations of the Treadway Commission
(COSO) and concluded that the Company maintained effective
internal control over financial reporting as of June 30, 2008, based
on these criteria.
Deloitte  Touche LLP, an independent registered public accounting firm,
has audited the effectiveness of the Company’s internal control over
financial reporting as of June 30, 2008, as stated in their report which
is included herein.
A.G. Lafley	 Clayton C. Daley, Jr.
Chairman of the Board	 Vice Chairman and
and Chief Executive Officer	 Chief Financial Officer
August 12, 2008
To the Board of Directors and Shareholders of
The Procter  Gamble Company
We have audited the accompanying Consolidated Balance Sheets of
The Procter  Gamble Company and subsidiaries (the “Company”) as
of June 30, 2008 and 2007, and the related Consolidated Statements
of Earnings, Shareholders’ Equity, and Cash Flows for each of the three
years in the period ended June 30, 2008. These financial statements are
the responsibility of the Company’s management. Our responsibility is
to express an opinion on these financial statements based on our audits.
We conducted our audits in accordance with the standards of the
Public Company Accounting Oversight Board (United States). Those
standards require that we plan and perform the audit to obtain
reasonable assurance about whether the financial statements are free
of material misstatement. An audit includes examining, on a test basis,
evidence supporting the amounts and disclosures in the financial
statements. An audit also includes assessing the accounting principles
used and significant estimates made by management, as well as
evaluating the overall financial statement presentation. We believe
that our audits provide a reasonable basis for our opinion.
In our opinion, such Consolidated Financial Statements present fairly,
in all material respects, the financial position of the Company at
June 30, 2008 and 2007, and the results of its operations and cash
flows for each of the three years in the period ended June 30, 2008,
in conformity with accounting principles generally accepted in the
United States of America.
As discussed in Note 1 to the Consolidated Financial Statements,
the Company adopted the provisions of FASB Interpretation No. 48,
“Accounting for Uncertainty in Income Taxes — an interpretation of
FASB Statement No. 109,” effective July 1, 2007. Also, as discussed in
Note 1 to the Consolidated Financial Statements, the Company adopted
the provisions of SFAS No. 158, “Employers’ Accounting for Defined
Benefit Pension and Other Postretirement Plans, an amendment of
FASB Statements No. 87, 88, 106, and 132(R),” effective June 30, 2007.
We have also audited, in accordance with the standards of the Public
Company Accounting Oversight Board (United States), the Company’s
internal control over financial reporting as of June 30, 2008, based on
the criteria established in Internal Control — Integrated Framework
issued by the Committee of Sponsoring Organizations of the Treadway
Commission and our report dated August 12, 2008, expressed an
unqualified opinion on the Company’s internal control over financial
reporting.
Cincinnati, Ohio
August 12, 2008
38	 The Procter  Gamble Company	
Report of Independent Registered Public Accounting Firm
To the Board of Directors and Shareholders of
The Procter  Gamble Company
We have audited the internal control over financial reporting of
The Procter  Gamble Company and subsidiaries (the “Company”) as
of June 30, 2008, based on criteria established in Internal Control — 
Integrated Framework issued by the Committee of Sponsoring
Organizations of the Treadway Commission. The Company’s manage-
ment is responsible for maintaining effective internal control over
financial reporting and for its assessment of the effectiveness of
internal control over financial reporting, included in Management’s
Report on Internal Control Over Financial Reporting. Our responsibility
is to express an opinion on the Company’s internal control over
financial reporting based on our audit.
We conducted our audit in accordance with the standards of the
Public Company Accounting Oversight Board (United States). Those
standards require that we plan and perform the audit to obtain
reasonable assurance about whether effective internal control over
financial reporting was maintained in all material respects. Our audit
included obtaining an understanding of internal control over financial
reporting, assessing the risk that a material weakness exists, testing and
evaluating the design and operating effectiveness of internal control
based on the assessed risk, and performing such other procedures as
we considered necessary in the circumstances. We believe that our
audit provides a reasonable basis for our opinion.
A company’s internal control over financial reporting is a process
designed by, or under the supervision of, the company’s principal
executive and principal financial officers, or persons performing
similar functions, and effected by the company’s board of directors,
management, and other personnel to provide reasonable assurance
regarding the reliability of financial reporting and the preparation of
financial statements for external purposes in accordance with generally
accepted accounting principles. A company’s internal control over
financial reporting includes those policies and procedures that (1) pertain
to the maintenance of records that, in reasonable detail, accurately
and fairly reflect the transactions and dispositions of the assets of the
company; (2) provide reasonable assurance that transactions are
recorded as necessary to permit preparation of financial statements in
accordance with generally accepted accounting principles, and that
receipts and expenditures of the company are being made only in
accordance with authorizations of management and directors of the
company; and (3) provide reasonable assurance regarding prevention
or timely detection of unauthorized acquisition, use, or disposition of
the company’s assets that could have a material effect on the financial
statements.
Because of the inherent limitations of internal control over financial
reporting, including the possibility of collusion or improper management
override of controls, material misstatements due to error or fraud may
not be prevented or detected on a timely basis. Also, projections of
any evaluation of the effectiveness of the internal control over financial
reporting to future periods are subject to the risk that the controls may
become inadequate because of changes in conditions, or that the
degree of compliance with the policies or procedures may deteriorate.
In our opinion, the Company maintained, in all material respects,
effective internal control over financial reporting as of June 30, 2008,
based on the criteria established in Internal Control — Integrated
Framework issued by the Committee of Sponsoring Organizations of
the Treadway Commission.
We have also audited, in accordance with the standards of the Public
Company Accounting Oversight Board (United States), the Consolidated
Financial Statements as of and for the year ended June 30, 2008 of
the Company and our report dated August 12, 2008 expressed an
unqualified opinion on those financial statements and included an
explanatory paragraph regarding the Company’s adoption of the
provisions of FASB Interpretation No. 48, “Accounting for Uncertainty
in Income Taxes — an interpretation of FASB Statement No. 109,”
effective July 1, 2007 and the Company’s adoption of the provisions
of SFAS No. 158, “Employers’ Accounting for Defined Benefit Pension
and Other Postretirement Plans, an amendment of FASB Statements
No. 87, 88, 106, and 132(R),” effective June 30, 2007.
Cincinnati, Ohio
August 12, 2008
The Procter  Gamble Company	 39
The purpose of this discussion is to provide an understanding of PG’s
financial results and condition by focusing on changes in certain key
measures from year to year. Management’s Discussion and Analysis
(MDA) is organized in the following sections:
Overview•	
Summary of 2008 Results•	
Forward-Looking Statements•	
Results of Operations•	
Segment Results•	
Financial Condition•	
Significant Accounting Policies and Estimates•	
Other Information•	
Throughout MDA, we refer to measures used by management to
evaluate performance including unit volume growth, net outside sales
and after-tax profit. We also refer to a number of financial measures
that are not defined under accounting principles generally accepted
in the United States of America (U.S. GAAP), including organic sales
growth, free cash flow and free cash flow productivity. We believe
these measures provide investors with important information that is
useful in understanding our business results and trends. The explana-
tion of these measures at the end of MDA provides more details on
the use and the derivation of these measures. Management also uses
certain market share and market consumption estimates to evaluate
performance relative to competition despite some limitations on the
availability and comparability of share information. References to
market share and market consumption in MDA are based on a
combination of vendor-reported consumption and market size data,
as well as internal estimates.
On October 1, 2005, we completed the acquisition of The Gillette
Company for $53.4 billion. The Gillette acquisition ultimately resulted
in the creation of Grooming, a new reportable segment, primarily
consisting of Gillette’s Blades and Razors and Braun businesses. Results
of Gillette’s Personal Care, Oral Care and Duracell businesses were
primarily subsumed within the Beauty, the Health Care and the Fabric
Care and Home Care reportable segments, respectively. Our discussion
of 2007 results within MDA are in comparison to 2006 results that
included the Gillette business only for the nine-month period from
October 1, 2005 (the acquisition date) through June 30, 2006. We
previously provided details regarding the changes to our reportable
segment structure resulting from the integration of the Gillette busi-
nesses (as presented in our Form 8-K filed on October 31, 2007).
OVERVIEW
PG’s business is focused on providing branded consumer goods
products. Our goal is to provide products of superior quality and
value to improve the lives of the world’s consumers. We believe this
will result in leadership sales, profits and value creation, allowing
employees, shareholders and the communities in which we operate
to prosper.
Our products are sold in more than 180 countries primarily through
mass merchandisers, grocery stores, membership club stores and
drug stores. We continue to expand our presence in other channels
including department stores, salons and “high frequency stores,”
the neighborhood stores which serve many consumers in developing
markets. We have on-the-ground operations in approximately 80
countries.
Our market environment is highly competitive, with global, regional
and local competitors. In many of the markets and industry segments
in which we sell our products, we compete against other branded
products as well as retailers’ private-label brands. Additionally, many
of the product segments in which we compete are differentiated
by price (referred to as premium, mid-tier and value-tier products).
Generally speaking, we compete with premium and mid-tier products
and are well positioned in the industry segments and markets in which
we operate — often holding a leadership or significant market share
position.
Organizational Structure
Our organizational structure is comprised of three Global Business
Units (GBUs) and a Global Operations group. The Global Operations
group consists of the Market Development Organization (MDO) and
Global Business Services (GBS).
Global Business Units
Our three GBUs are Beauty, Health and Well-Being, and Household
Care. The primary responsibility of the GBUs is to develop the overall
strategy for our brands. They identify common consumer needs,
develop new product innovations and upgrades, and build our brands
through effective commercial innovations, marketing and sales.
Under U.S. GAAP, the business units comprising the GBUs are aggre-
gated into six reportable segments: Beauty; Grooming; Health Care;
Snacks, Coffee and Pet Care; Fabric Care and Home Care; and Baby
Care and Family Care. The following provides additional detail on
our GBUs and reportable segments and the key product and brand
composition within each.
Management’s Discussion and Analysis
40	 The Procter  Gamble Company	 Management’s Discussion and Analysis
	 Reportable 	 % of 	 % of Net	
GBU	 Segment	 Net Sales*	 Earnings*	 Key Products	 Billion-Dollar Brands
Beauty	 Beauty	 23%	 22%	 Cosmetics, Deodorants, Hair Care, Personal 	 Head  Shoulders,
				 Cleansing, Prestige Fragrances, Skin Care	 Olay, Pantene, Wella
		 Grooming	 10%	 13%	 Blades and Razors, Electric Hair Removal 	 Braun, Fusion,
				 Devices, Face and Shave Products, Home	 Gillette, Mach3
				 Appliances
Health and Well-Being	 Health Care	 17%	 20%	 Feminine Care, Oral Care, Personal Health	 Actonel, Always,
				 Care, Pharmaceuticals 	 Crest, Oral-B
		 Snacks, Coffee 	 6%	 4%	 Coffee, Pet Food, Snacks	 Folgers, Iams,
	 and Pet Care 				 Pringles
Household Care	 Fabric Care and 	 28%	 27%	 Air Care, Batteries, Dish Care, Fabric Care,	 Ariel, Dawn, Downy,
	 Home Care 			 Surface Care	 Duracell, Gain, Tide
		 Baby Care and 	 16%	 14%	 Baby Wipes, Bath Tissue, Diapers, Facial	 Bounty, Charmin,
	 Family Care			 Tissue, Paper Towels	 Pampers
* Percent of net sales and net earnings for the year ended June 30, 2008 (excluding results held in Corporate).
Beauty
Beauty: We are a global market leader in beauty and compete in
markets which comprise approximately $230 billion in global retail
sales. Most of the beauty markets in which we compete are highly
fragmented with a large number of global and local competitors.
We are the global market leader in hair care with over 20% of the
global market share. In skin care, we compete primarily with the
Olay brand, which is the top facial skin care retail brand in the world.
We are also one of the global market leaders in prestige fragrances,
primarily behind the Gucci, Hugo Boss and Dolce  Gabbana
fragrance brands.
Grooming: This segment consists of blades and razors, face and
shave preparation products (such as shaving cream), electric hair
removal devices and small household appliances. We hold leadership
market share in the manual blades and razors market on a global
basis and in almost all of the geographies in which we compete. Our
global manual blades and razors market share is about 70%, primarily
behind Mach3, Fusion, Venus and the Gillette franchise. Our electric
hair removal devices and small home appliances are sold under the
Braun brand in a number of markets around the world, where we
compete against both global and regional competitors. Our primary
focus in this area is in electric hair removal devices, such as electric
razors and epilators, where we hold over 30% and over 50% of the
male and female markets, respectively.
Health and Well-Being
Health Care: We compete in oral care, feminine care, and pharma-
ceuticals and personal health. In oral care, there are several global
competitors in the market, and we have the number two market share
position at approximately 20% of the global market. We are the global
market leader in the feminine care category with about one-third of
the global market share. In pharmaceuticals and personal health, we
have approximately one-third of the global bisphosphonates market
for the treatment of osteoporosis under the Actonel brand. We are
the market leader in nonprescription heartburn medications and in
respiratory treatments behind Prilosec OTC and Vicks, respectively.
Snacks, Coffee and Pet Care: In snacks, we compete against both
global and local competitors and have a global market share of
approximately 10% in the potato chips market behind our Pringles
brand. Our coffee business competes almost solely in North America,
where we hold a leadership position with approximately one-third
of the U.S. market, primarily behind our Folgers brand. We have
announced plans to separate our coffee business and merge it with
The J. M. Smucker Company in a transaction that is expected to close
in the second quarter of fiscal 2009. In pet care, we compete in
several markets around the globe in the premium pet care segment,
behind the Iams and Eukanuba brands. The vast majority of our pet
care business is in North America, where we have about a 10% share
of the market.
Household Care
Fabric Care and Home Care: This segment is comprised of a variety
of fabric care products, including laundry cleaning products and fabric
conditioners; home care products, including dish care, surface cleaners
and air fresheners; and batteries. In fabric care, we generally have the
number one or number two share position in the markets in which
we compete and are the global market leader, with approximately
one-third of the global market share. Our global home care market
share is about 20% across the categories in which we compete. In
batteries, we compete primarily behind the Duracell brand and have
over 40% of the global alkaline battery market share.
Baby Care and Family Care: In baby care, we compete primarily in
diapers, training pants and baby wipes, with over one-third of the
global market share. We are the number one or number two baby
care competitor in most of the key markets in which we compete,
primarily behind Pampers, the Company’s largest brand, with annual
net sales of approximately $8 billion. Our family care business is
predominantly a North American business comprised primarily of
the Bounty paper towel and Charmin toilet tissue brands, with U.S.
market shares of over 40% and over 25%, respectively.
Management’s Discussion and Analysis	 The Procter  Gamble Company	 41
Global Operations
Market Development Organization
Our MDO is responsible for developing go-to-market plans at the local
level. The MDO includes dedicated retail customer, trade channel and
country-specific teams. It is organized along seven geographic regions:
North America, Western Europe, Northeast Asia, Central  Eastern
Europe/Middle East/Africa, Latin America, ASEAN/Australia/India and
Greater China. Throughout MDA, we reference business results in
developing markets, which we define as the aggregate of Central 
Eastern Europe/Middle East/Africa, Latin America, ASEAN/Australia/
India and Greater China, and developed markets, which are comprised
of North America, Western Europe and Northeast Asia.
Global Business Services
GBS provides technology, processes and standard data tools to enable
the GBUs and the MDO to better understand the business and better
serve consumers and customers. The GBS organization is responsible
for providing world-class solutions at a low cost and with minimal
capital investment.
Strategic Focus
PG is focused on strategies that we believe are right for the long-term
health of the Company and will increase returns for our shareholders.
The Company’s annual financial targets are:
Organic sales growth of 4% to 6%. This is comprised of:•	
3% to 5% pre-Gillette organic sales growth target, plus––
1% of growth acceleration behind revenue synergies associated––
with the Gillette acquisition.
Diluted net earnings per share (EPS) growth of 10% or better,•	
excluding the net impact of Gillette dilution.
Free cash flow productivity of 90% or greater (defined as the ratio•	
of operating cash flow less capital expenditures to net earnings).
Capital spending at or below 4% of net sales annually.––
In order to achieve these targets, we focus on our core strengths of
consumer understanding, branding, innovation, go-to-market capability
and global scale and scope against the following growth areas:
Grow our leading brands in our biggest markets and with our•	
winning customers.
Shift our portfolio mix to faster-growing businesses with higher•	
gross margins that are less asset-intensive.
Grow disproportionately in developing markets and with value-•	
conscious consumers.
To sustain consistent and reliable sales and earnings growth in line
with our financial targets, we have identified four key enablers:
Building a diversified and balanced portfolio of businesses,•	
brands and geographies to deliver consistent, reliable top- and
bottom-line growth. Our portfolio of businesses provides a unique
combination of stability, scale and growth. We compete primarily
in 22 global product categories and are a market leader in over
two-thirds of these categories. In addition, our portfolio includes
24 brands that generate over $1 billion in annual sales and 20
brands that generate between $500 million and $1 billion in annual
sales. Combined, these 44 brands account for 85% or more of our
sales and profits. These brands are platforms for future innovations
that will drive sales growth, expand categories for retail customers
and differentiate brands in the minds of consumers. Our geo-
graphic portfolio includes a healthy balance of developed and
developing market businesses. Approximately 40% of sales are
generated from the United States, our home market, and develop-
ing markets account for approximately 30% of sales. We will
continue to invest to grow market sizes and share in developed
regions, and will continue to expand our product range in faster-
growing developing markets.
Investing in innovation and core P•	 G capabilities and strengths
to enable us to reach more of the world’s consumers with
quality, affordable products. This includes expanding our presence
in markets and reaching more consumers where we are underrep-
resented, including value-conscious consumers.
Leveraging the Company’s organizational structure to drive clear•	
focus, accountability and improved go-to-market capability. 
We have an organizational structure that works together to leverage
our knowledge and scale at the global level with a deep understand-
ing of the consumer and customer at the local level.
The GBU organizations leverage their consumer understanding to––
develop the overall strategy for our brands. They identify common
consumer needs, develop new products and build our brands
through effective marketing innovations and product upgrades.
The GBU is focused on winning the “second moment of truth” — 
when the consumer uses the product and evaluates how well the
product meets his or her expectations.
The MDO develops go-to-market plans at the local level, leverag-––
ing their understanding of the local consumers and customers.
The MDO is focused on winning the “first moment of truth” — 
when a consumer stands in front of the shelf and chooses a
product from among many competitive offerings.
Global Business Services operates as the “back office” for the GBUs––
and the MDO, providing cost-effective world-class technology,
processes and standard data tools to better understand the busi-
ness and better serve consumers and customers. GBS personnel,
or highly efficient and effective third-party partners, provide
these services.
Focusing on cost improvement and cash productivity. •	 Each
organization is evaluated on its ability to support the Company’s
financial goals and increase total shareholder return. This includes
an evaluation of net sales growth, earnings growth, profit margin
expansion and cash productivity. Our organizations are evaluated
on their ability to generate cash, for example, by increasing produc-
tivity, improving capacity utilization, meeting capital spending
targets and reducing working capital required to run the business.
42	 The Procter  Gamble Company	 Management’s Discussion and Analysis
SUMMARY OF 2008 RESULTS
For the fiscal year ended June 30, 2008, we delivered our seventh
consecutive year of sales growth and free cash flow productivity at or
above our stated targets.
Net sales increased 9% to $83.5 billion.•	
Organic sales, which exclude the impacts of acquisitions, divestitures––
and foreign exchange, increased 5%, in line with our post-Gillette
organic sales growth target range of 4% to 6%.
Every reportable segment delivered year-on-year organic sales––
growth.
Diluted net earnings per share increased 20% to $3.64.•	
Earnings per share grew behind 11% operating profit growth.––
Cash flow from operating activities was $15.8 billion.•	
Free cash flow productivity was 106%, ahead of our 90% target.––
Forward-Looking Statements
We discuss expectations regarding future performance, events and
outcomes, such as our business outlook and objectives, in annual and
quarterly reports, press releases and other written and oral communi-
cations. All such statements, except for historical and present factual
information, are “forward-looking statements,” and are based on
financial data and our business plans available only as of the time the
statements are made, which may become out-of-date or incomplete.
We assume no obligation to update any forward-looking statements
as a result of new information, future events or other factors.
Forward-looking statements are inherently uncertain and investors
must recognize that events could be significantly different from our
expectations.
Ability to Achieve Business Plans. We are a consumer products
company and rely on continued demand for our brands and products.
To achieve business goals, we must develop and sell products that
appeal to consumers and retail trade customers. Our continued
success is dependent on leading-edge innovation with respect to both
products and operations and on the continued positive reputations
of our brands. This means we must be able to obtain patents and
respond to technological advances and patents granted to competition.
Our success is also dependent on effective sales, advertising and
marketing programs in an increasingly fragmented media environment.
Our ability to innovate and execute in these areas will determine
the extent to which we are able to grow existing sales and volume
profitably, especially with respect to the product categories and
geographic markets (including developing markets) in which we have
chosen to focus. There are high levels of competitive activity in the
environments in which we operate. To address these challenges, we
must respond to competitive factors, including pricing, promotional
incentives, trade terms and product initiatives. We must manage each
of these factors, as well as maintain mutually beneficial relationships
with our key customers, in order to effectively compete and achieve
our business plans. Since our goals include a growth component tied
to acquisitions, we must manage and integrate key acquisitions, such
as the Gillette and Wella acquisitions, including achieving the cost
and growth synergies in accordance with stated goals.
Cost Pressures. Our costs are subject to fluctuations, particularly due
to changes in commodity prices, raw materials, cost of labor, foreign
exchange and interest rates. Therefore, our success is dependent, in
part, on our continued ability to manage these fluctuations through
pricing actions, cost savings projects, sourcing decisions and certain
hedging transactions. We also must manage our debt and currency
exposure, especially in volatile countries. We need to maintain key
manufacturing and supply arrangements, including sole supplier and
sole manufacturing plant arrangements. We must implement, achieve
and sustain cost improvement plans, including our outsourcing projects
and those related to general overhead and workforce rationalization.
Global Economic Conditions. Economic changes, terrorist activity and
political unrest may result in business interruption, inflation, deflation
or decreased demand for our products. Our success will depend, in
part, on our ability to manage continued global political and/or
economic uncertainty, especially in our significant geographic markets,
as well as any political or economic disruption due to terrorist and
other hostile activities.
Regulatory Environment. Changes in laws, regulations and the related
interpretations may alter the environment in which we do business.
This includes changes in environmental, competitive and product-
related laws, as well as changes in accounting standards and taxation
requirements. Our ability to manage regulatory, tax and legal matters
(including product liability, patent, intellectual property and competition
law matters) and to resolve pending legal matters within current
estimates may impact our results.
RESULTS OF OPERATIONS
Net Sales
Net sales increased 9% in 2008 to $83.5 billion behind 4% unit volume
growth, a favorable 5% foreign exchange impact and a positive 1%
pricing impact. Favorable foreign exchange resulted primarily from the
strengthening of European and other currencies relative to the U.S.
dollar. Price increases were taken across a number of our businesses
primarily to offset higher commodity costs. Mix had a negative 1%
impact on net sales primarily due to disproportionate growth in
developing regions, where selling prices are below the Company
average. Each reportable segment posted year-on-year volume growth,
with mid-single-digit growth in Fabric Care and Home Care, Baby Care
and Family Care, Grooming and Health Care and low-single-digit
growth in Beauty and Snacks, Coffee and Pet Care. Each geographic
region posted year-on-year volume growth except Western Europe,
which was down low-single digits due to the impact of divestitures.
Excluding the impact of acquisitions and divestitures, every geographic
region delivered year-on-year volume growth. Volume grew primarily
behind initiative activity on key brands and continued double-digit
growth in developing regions. Organic sales increased 5% behind
organic volume growth of 5%, which excludes the impact of acquisi-
tions and divestitures. Each reportable segment posted year-on-year
organic sales and organic volume growth.
Management’s Discussion and Analysis	 The Procter  Gamble Company	 43
Net sales increased 12% in 2007 to $76.5 billion. Sales were up behind
9% unit volume growth, including the impact of an extra three months
of Gillette results in 2007. Organic volume increased 5%. Developing
regions continued to lead the growth with double-digit increases for
the year. All reportable segments increased organic volume for the
year except the Snacks, Coffee and Pet Care segment. Higher pricing,
primarily in coffee and Health Care, contributed 1% to sales growth.
Product mix had no net impact on sales as a more premium product
mix driven by the additional three months of Gillette results in 2007
was offset by the negative mix impact of disproportionate growth in
developing markets, where the average unit sales price is lower than
the Company average. Favorable foreign exchange contributed 2% to
net sales growth. Organic sales increased 5% versus 2006 with each
reportable segment posting year-on-year growth.
Operating Costs
Gross margin was down 70 basis points in 2008 to 51.3% of net sales.
Commodity and energy cost increases had a negative impact on gross
margin of about 200 basis points. These were largely offset by the
benefits of scale leverage from volume growth and cost savings projects
resulting from manufacturing efficiency improvements and product
reformulations.
Gross margin was 52.0% in 2007, an increase of 60 basis points versus
the prior year. Higher commodity and energy costs had a negative
impact of approximately 60 basis points on gross margin. These were
more than offset by scale leverage from organic volume growth, higher
pricing and cost savings projects. The additional three months of the
Gillette business in 2007, which has a higher gross margin than the base
PG business, drove additional gross margin improvement of approxi-
mately 30 basis points.
Total selling, general and administrative expenses (SGA) increased 6%
to $25.7 billion in 2008. The increase was driven by higher overhead
and marketing spending to support business growth. SGA as a
percentage of net sales was down 100 basis points. Overhead spending
was down as a percentage of net sales for the total Company and for
each reportable segment primarily due to volume scale leverage, a
focus on overhead productivity and incremental synergy savings from
the Gillette acquisition. Marketing spending as a percentage of net
sales was in line with previous year levels.
SGA in 2007 increased 11%, or $2.5 billion, to $24.3 billion. SGA
increased primarily due to the additional three months of Gillette in
2007 and to support business growth, partially offset by overhead
and media purchasing synergies from the Gillette integration. The
additional three months of Gillette in 2007 accounted for approximately
$1.1 billion of the increase, including approximately $160 million of
incremental acquisition-related expenses. The incremental acquisition-
related expenses were comprised of three additional months of
intangible asset amortization resulting from revaluing intangible assets
in the opening balance sheet of the acquired Gillette business, costs to
restructure the business post-acquisition and other integration-related
expenses. SGA as a percentage of net sales was 31.8% in 2007,
an improvement of 20 basis points versus 2006. Overhead expenses
as a percentage of net sales were down due to volume scale leverage,
overhead cost control and synergies from the Gillette integration.
Marketing spending as a percentage of net sales in 2007 was roughly
in line with prior year levels despite media purchasing synergies gener-
ated by the Gillette acquisition and a continued focus on marketing
return-on-investment (ROI) programs.
	 	 	 	 	 	 	 	 Basis Point	 	 Basis Point	
Comparisons as a percentage of net sales; Years ended June 30	 	 	 	 2008	 Change	 2007	 Change	 2006
Gross margin						 51.3%	 (70)	 52.0%	 60	 51.4%
Selling, general and administrative					 30.8%	 (100)	 31.8%	 (20)	 32.0%
Operating margin						 20.5%	 30 	 20.2%	 80 	 19.4%
Earnings before income taxes						 19.3%	 10 	 19.2%	 100 	 18.2%
Net earnings						 14.5%	 100 	 13.5%	 80 	 12.7%
44	 The Procter  Gamble Company	 Management’s Discussion and Analysis
Non-Operating Items
Non-operating items primarily include interest expense, divestiture
gains and interest and investment income. Interest expense increased
13% to $1.5 billion in 2008 driven by a higher interest rate on our
long-term borrowings and a higher debt level to fund the Company’s
previously announced share repurchase program. Under this share
repurchase program, which began in July 2007, we plan to repurchase
between $24 – $30 billion of PG stock over a three-year period.
In 2007, interest expense increased 17% to $1.3 billion due to the
financing costs associated with the debt issued to fund the share
repurchase program executed in conjunction with the acquisition of
Gillette in October 2005. The repurchase program associated with
Gillette was completed in July 2006.
Other non-operating income in 2008 decreased $102 million versus
the prior year period primarily due to lower current period interest
income. Interest income declined in 2008 primarily due to lower interest
rates and cash balances. Divestiture gains on the sale of minor brands
in 2008 were in line with previous year levels. Other non-operating
income increased $281 million in 2007 to $564 million primarily due
to higher divestiture gains in 2007.
Our tax rate declined in 2008 from 29.7% to 24.9%. Approximately
3 percentage points of this decline was due to discrete adjustments
to reserves for previously existing uncertain tax positions in the U.S.
and other countries. The balance of the decline was primarily driven
by a more favorable geographic mix of earnings and a reduction in the
German statutory tax rate, which reduced our deferred tax liabilities
related to acquired intangible assets. Our effective tax rate in 2007
was down 30 basis points versus 2006 primarily due to a more favor-
able country mix impact in 2007, partially offset by higher levels of
reserve releases in 2006.
Net Earnings
Net earnings increased 17% to $12.1 billion in 2008 behind sales
growth and a 100-basis point improvement in net earnings margin.
Net earnings margin increased due to lower SGA as a percentage of
net sales and a lower tax rate, which more than offset lower gross
margin. Net earnings in 2007 increased 19% to $10.3 billion behind
sales growth, including the additional three months of Gillette results
and earnings margin expansion. Net earnings margin expanded 80
basis points primarily behind gross margin improvement.
Diluted net earnings per share in 2008 were up 20% versus the
prior year to $3.64 per share. Diluted net earnings per share growth
exceeded net earnings growth due to share repurchase activity.
We repurchased $10 billion of treasury shares in 2008 under a previ-
ously announced share buyback program that started in July 2007.
Gillette was modestly accretive to our earnings per share results in
2008, compared to dilution of approximately $0.10 – $0.12 per share
in 2007. The elimination of Gillette dilution on our earnings per share
drove approximately 4 percentage points of earnings per share growth
in 2008. Diluted net earnings per share in 2007 increased 15% to $3.04
primarily behind earnings growth, partially offset by the impact of a
net increase in the weighted average shares outstanding in 2007 versus
2006 resulting from the incremental shares issued in conjunction with
the Gillette acquisition on October 1, 2005.
SEGMENT RESULTS
Results for the segments reflect information on the same basis we
use for internal management reporting and performance evaluation.
Within the Beauty GBU, we provide data for the Beauty and the
Grooming reportable segments. In the Health and Well-Being GBU,
we provide data for the Health Care and the Snacks, Coffee and Pet
Care reportable segments. In the Household Care GBU, we provide
data for the Fabric Care and Home Care and the Baby Care and
Family Care reportable segments.
The results of these reportable business segments do not include
certain non-business unit specific costs such as interest expense,
investing activities and certain restructuring costs. These costs are
reported in our Corporate segment and are included as part of our
Corporate segment discussion. Additionally, as described in Note 12
to the Consolidated Financial Statements, we have investments in
certain companies over which we exert significant influence, but do
not control the financial and operating decisions and, therefore, do
not consolidate them (“unconsolidated entities”). Since certain of
these investments are managed as integral parts of the Company’s
business units, they are accounted for as if they were consolidated
subsidiaries for management and segment reporting purposes. This
means pretax earnings in the business units include 100% of each
pretax income statement component. In determining after-tax earnings
in the business units, we eliminate the share of earnings applicable to
other ownership interests, in a manner similar to minority interest,
and apply the statutory tax rates. Eliminations to adjust each line item
to U.S. GAAP are included in our Corporate segment.
Beauty
Beauty
	 	 	 Change vs.	 	 Change vs.
(in millions of dollars)	 2008	 Prior Year	 2007	 Prior Year*
Volume	 n/a	 +2%	 n/a	 +4%
Net sales	 $19,515	 +9%	 $17,889	 +7%
Net earnings	 $  2,730	 +5%	 $  2,611	 +8%
* The Gillette business was acquired on October 1, 2005. Therefore, the fiscal 2007 growth
rates are versus a base period that included only 9 months of Gillette Beauty results
(e.g., deodorants products).
Beauty net sales increased 9% in 2008 to $19.5 billion behind 2%
volume growth and 6% of favorable foreign exchange. Favorable
product mix had a positive 1% impact on net sales primarily due to
stronger growth in skin care and prestige fragrances, which have
Management’s Discussion and Analysis	 The Procter  Gamble Company	 45
higher than segment average unit selling prices. This more than offset
the impact of disproportionate growth in developing regions, which
have lower selling prices than the segment average. Skin care volume
was up mid-single digits driven by growth on Olay behind the Definity
and Regenerist initiatives. Our global skin care market share was up
slightly, driven primarily by about a 1 point increase in our U.S. market
share. Prestige fragrances volume was up low-single digits and organic
volume was up high-single digits behind new product launches on
Dolce  Gabbana and Hugo Boss. Retail hair care volume was up
mid-single digits, led by high-single-digit growth in developing markets.
Retail hair care volume in developed regions was flat as a double-digit
volume increase on Head  Shoulders was offset by a double-digit
volume decline on Pantene in North America. Hair color volume
increased low-single digits as growth on Nice ‘N Easy behind the
Perfect 10 launch more than offset declines on other color brands.
Professional hair care volume declined mid-single digits as growth
from color was more than offset by declines in care and styling.
Overall, global hair care market share was in line with the prior year
level. Volume in deodorants was down low-single digits primarily due
to competitive activity and market softness in Western Europe.
Net earnings in Beauty increased 5% to $2.7 billion in 2008 as the
impact of higher sales was partially offset by a lower net earnings
margin. Net earnings margin was down 60-basis points as lower gross
margin and the impact of base period divestiture gains on minor brands
more than offset the benefit of a lower tax rate due to geographic
mix. Gross margin was down due to higher commodity costs, which
more than offset the benefit of increased volume scale leverage and
manufacturing cost savings projects. SGA increased slightly as
higher marketing spending as a percentage of net sales was partially
offset by lower overhead spending as a percentage of net sales.
In 2007, Beauty net sales increased 7% to $17.9 billion behind 4%
unit volume growth. Volume growth was driven by initiative activity
across categories and continued expansion in developing regions,
where volume increased high-single digits. Prestige fragrances volume
was up double-digits behind The One, Boss Selection and Boss Femme
fragrance initiatives and the addition of Dolce  Gabbana. Skin care
volume was up high-single digits behind the Olay Definity and
Regenerist product initiatives. Hair care volume grew mid-single digits
as a result of product initiatives on Pantene, Head  Shoulders and
Herbal Essences and continued expansion in developing regions.
Beauty sales benefited from a 1% positive mix impact primarily due
to disproportionate growth in prestige fragrances, which has a higher
than segment average unit selling price. This was offset by higher
levels of promotional activity, which resulted in a negative 1% pricing
impact. Favorable foreign exchange contributed 3% to net sales. Net
earnings increased 8% in 2007 to $2.6 billion primarily behind net
sales growth. Earnings margin increased 15 basis points primarily due
to lower SGA as a percentage of net sales and divestiture gains on
several minor Beauty brands, partially offset by the negative mix impact
from lower SK-II shipments. SGA improved as higher marketing
spending as a percentage of net sales to support initiative activity was
more than offset by lower overhead expenses as a percentage of net
sales resulting from the benefit of volume scale leverage and Gillette-
related synergy savings. SK-II shipments were down in 2007 due to
the sales disruption in Asia resulting from the voluntary temporary
suspension of SK-II shipments in China early in the 2007 fiscal year.
Grooming
	 	 	 Change vs.	 	 Change vs.
(in millions of dollars)	 2008	 Prior Year	 2007	 Prior Year*
Volume	 n/a	 +5%	 n/a	 +36%
Net sales	 $8,254	 +11%	 $7,437	 +45%
Net earnings	 $1,679	 +21%	 $1,383	 +63%
* The Gillette business was acquired on October 1, 2005. Therefore, the fiscal 2007 growth
rates are versus a base period that included only 9 months of Gillette Grooming results.
Grooming net sales increased 11% to $8.3 billion in 2008. Net sales
were up behind 5% volume growth, a 7% favorable foreign exchange
impact and a 2% positive pricing impact driven by price increases on
premium shaving systems. Product mix had a negative 3% impact on
net sales as positive product mix from growth on the premium-priced
Fusion brand was more than offset by the impact of disproportionate
growth in developing regions, where selling prices are below the
segment average. Blades and razors volume increased high-single digits
behind double-digit growth in developing regions driven primarily by
	 	 	 	 	 	 	 Volume 	
	 	 	 	 	 	 Volume with 	 Excluding	
	 	 	 	 	 	 Acquisitions 	 Acquisitions	 Foreign	 	 	 Net Sales	
Net Sales Change Drivers vs. Year Ago (2008 vs. 2007)	 	 	 	  Divestitures	  Divestitures	 Exchange	 Price	 Mix/Other	 Growth
Beauty
Beauty					 2%	 3%	 6%	 0%	 1%	 9%
Grooming					 5%	 6%	 7%	 2%	 -3%	 11%
Health and Well-Being
Health Care					 4%	 4%	 5%	 1%	 -1%	 9%
Snacks, Coffee and Pet Care					 2%	 2%	 3%	 3%	 -1%	 7%
Household Care
Fabric Care and Home Care					 6%	 6%	 5%	 1%	 -1%	 11%
Baby Care and Family Care					 4%	 8%	 4%	 1%	 0%	 9%
Total Company					 4%	 5%	 5%	 1%	 -1%	 9%
Sales percentage changes are approximations based on quantitative formulas that are consistently applied.
46	 The Procter  Gamble Company	 Management’s Discussion and Analysis
Fusion expansion and Prestobarba3 launch. In developed regions,
blades and razors volume was down low-single digits as double-digit
growth on Fusion was more than offset by lower shipments of legacy
shaving systems. Fusion delivered more than $1 billion in net sales
for 2008, making it the Company’s 24th billion-dollar brand. Braun
volume was down mid-single digits primarily due to supply constraints
at a contract manufacturer, the announced exits of certain appliance
businesses and the divestiture of the thermometer and blood pressure
devices business.
Net earnings in Grooming were up 21% in 2008 to $1.7 billion behind
net sales growth and a 170-basis point earnings margin expansion.
Earnings margin improved behind lower SGA as a percentage of net
sales, partially offset by a reduction in gross margin. Gross margin
declined due to higher costs incurred at a contract manufacturer on
the Braun home appliance business, which more than offset benefits
from higher pricing and volume scale leverage. SGA as a percentage
of net sales was down primarily due to lower overhead spending
driven largely by synergies from the integration of Gillette into PG’s
infrastructure.
In 2007, net sales in Grooming increased 45% to $7.4 billion on 36%
unit volume growth, including the impact of the extra three months
of Gillette results in fiscal 2007. Organic sales increased 6% during the
year, with organic volume up 2%. Blades and razors organic volume
was up mid-single digits primarily behind the continued expansion of
the Fusion razor system and growth of Mach3 in countries where
Fusion has not yet launched. Fusion was launched in North America
in fiscal 2006 and expanded into other markets including Western
Europe in fiscal 2007. In Braun, organic volume was down low-single
digits as the impact of the launches of 360 Complete and Contour
razors in North America and Pulsonic razors in Germany and Japan
were more than offset by lower volume on household appliances in
Europe. Favorable product mix, primarily behind the launch of the
premium Fusion razors, contributed 3% to net sales. Price increases
taken across most shaving systems added an additional 2% to net
sales and favorable foreign exchange added an additional 4%.
Net earnings increased 63% in 2007 to $1.4 billion. The extra three
months of Gillette results in fiscal 2007 contributed 46% of the total
earnings growth. The remaining growth was due to organic sales
growth and integration-driven synergy savings, partially offset by
higher marketing investment behind Fusion and incremental acquisition-
related charges. We incurred approximately $40 million of incremental
acquisition-related charges in fiscal 2007. The incremental acquisition-
related charges are primarily comprised of amortization charges from
revaluing intangible assets in the opening balance sheet, partially
offset by base period product costs related to revaluing Gillette’s
opening inventory balance. Amortization charges were higher in fiscal
2007 due to the extra three months of Gillette results in the period.
Health and Well-Being
Health Care
	 	 	 Change vs.	 	 Change vs.
(in millions of dollars)	 2008	 Prior Year	 2007	 Prior Year*
Volume	 n/a	 +4%	 n/a	 +8%
Net sales	 $14,578	 +9%	 $13,381	 +13%
Net earnings	 $  2,506	 +12%	 $  2,233	 +22%
* The Gillette business was acquired on October 1, 2005. Therefore, the fiscal 2007 growth
rates are versus a base period that included only 9 months of Gillette Health Care results
(e.g., Oral-B).
Health Care net sales increased 9% in 2008 to $14.6 billion behind a
4% increase in unit volume. Foreign exchange had a positive 5%
impact on net sales and price increases added 1% to net sales.
Disproportionate growth in developing regions, which have selling
prices below the segment average, resulted in a negative 1% mix
impact. Feminine care volume increased mid-single digits and organic
volume was up high-single digits behind double-digit growth on
Naturella and high-single digit growth on Always, which more than
offset a low-single digit decline on Tampax. Our global feminine care
market share increased slightly in 2008 to about 38%. Oral care
volume was up mid-single digits behind initiative-driven growth on
Oral-B toothbrushes and Crest. U.S. market share on Crest dentifrice
was in line with the previous year. Volume in pharmaceuticals and
personal health was up low-single digits as the impact of adding the
Swiss Precision Diagnostics business was largely offset by lower
shipments of Actonel, Prilosec OTC and PuR. The PuR decline was
from adjustments to a Whirlpool®
water filters licensing agreement.
Prilosec OTC volume began to decline in the third fiscal quarter of
2008 due to the recent loss of marketplace exclusivity and the entry
of competing products into the market. This is expected to continue
and to have an adverse effect on the results of the Health Care seg-
ment in future periods.
Net earnings in Health Care were up 12% in 2008 to $2.5 billion due
to higher net sales and a 50-basis point improvement in net earnings
margin. Net earnings margin increased as reduced SGA as a percent-
age of net sales more than offset lower gross margin. Gross margin
was down due to higher commodity costs and a less profitable mix
driven primarily by disproportionate growth in developing regions and
lower shipments of Prilosec OTC, which more than offset the benefit of
increased volume scale leverage and manufacturing cost savings. SGA
improved primarily behind lower overhead spending as a percentage
of net sales due to a focus on productivity improvement and Gillette
synergy benefits.
Health Care net sales increased 13% in 2007 to $13.4 billion behind
an 8% increase in unit volume. Sales and volume were up as a result
of three additional months of Gillette oral care results in fiscal 2007
and growth on the base PG business. Health Care organic sales
increased 7% behind 5% organic volume growth. Oral care organic
volume grew mid-single digits behind double-digit growth in develop-
ing regions, high-single-digit growth on Oral-B and the launch of
Crest Pro-Health toothpaste in North America. Pharmaceuticals and
personal health volume increased low-single digits behind growth on
Management’s Discussion and Analysis	 The Procter  Gamble Company	 47
Prilosec OTC, partially offset by lower volume on Actonel due to strong
competitive activity in the osteoporosis market. Our U.S. market share
on Prilosec OTC increased about 1-point during the year. Feminine
care volume was up high-single digits, led by double-digit growth in
developing regions. Successful initiative activity in North America on
the Always Clean and Fresh initiatives and product upgrades on
Tampax Pearl more than offset the impact of strong competitive
activity in Western Europe and Northeast Asia, resulting in a 1-point
increase in our global feminine care market share. Pricing, primarily in
pharmaceuticals and personal health, contributed 2% to segment net
sales growth. A more premium product mix added an additional 1%
to net sales as disproportionate growth on Crest Pro-Health in North
America more than offset the negative impact from higher relative
growth in developing regions. Foreign exchange had a positive 2%
impact on net sales. Net earnings grew 22% to $2.2 billion in 2007
behind organic sales growth, the additional three months of Gillette
oral care results and earnings margin expansion. Earnings margin
increased 120 basis points behind increased gross margin on our base
business and lower SGA as a percentage of net sales. SGA improved
primarily due to lower overhead expenses as a percentage of net sales
resulting from volume scale leverage, Gillette synergy savings and
lower research and development costs in our pharmaceuticals business
driven by further leveraging external RD networks and higher clinical
milestone payments in the base period.
Snacks, Coffee and Pet Care
	 	 	 Change vs.	 	 Change vs.
(in millions of dollars)	 2008	 Prior Year	 2007	 Prior Year
Volume	 n/a	 +2%	 n/a	 +0%
Net sales	 $4,852	 +7%	 $4,537	 +4%
Net earnings	 $  477	 0%	 $  477	 +24%
Snacks, Coffee and Pet Care net sales increased 7% to $4.9 billion in
2008. Net sales grew behind a 2% volume increase, a positive 3%
price impact resulting from price increases in coffee and pet care and
a 3% favorable foreign exchange impact. Product mix had a negative
1% impact on net sales from a decline in coffee volume, which has
higher selling prices than the segment average. Snacks volume was
up high-single digits behind the launch of Rice Infusion in Western
Europe and Extreme Flavors and Pringles Stix in North America.
Coffee volume declined low-single digits as growth from the launch
of the Dunkin’ Donuts®
line was more than offset by lower volume
on the balance of the business due to higher price gaps versus
branded competition and reductions in trade inventory levels ahead
of an upcoming product restage. Coffee market share in the U.S. was
up about 1 point versus the prior year, primarily due to favorable mix
impacts from the premium-priced Dunkin’ Donuts®
line. In pet care,
volume was down low-single digits due to negative impacts from the
voluntary wet pet food recall in the U.S. in March 2007 that contrib-
uted to about a 1% decline in our U.S. market share.
Net earnings in Snacks, Coffee and Pet Care were $477 million in
2008, in line with the prior year. Higher sales were offset by lower net
earnings margin. Net earnings margin was down 70 basis points as
lower gross margin more than offset improved SGA expenses as a
percentage of net sales. Gross margin was down as higher commodity
costs across the segment more than offset price increases, base period
pet food recall impacts and manufacturing cost savings. SGA decreased
as a percentage of net sales due to reductions in both overhead and
marketing spending as a percentage of net sales. Hurricane Katrina
insurance payments were received in both the current and previous
fiscal years and, therefore, had minimal impact on the segment’s
year-on-year net earnings growth rate.
We previously announced plans to separate our coffee business into
a separate operating company. In June 2008, we announced an
agreement with The J. M. Smucker Company to merge the separated
coffee company into The J. M. Smucker Company in an all-stock
reverse Morris Trust transaction. We expect the transaction to close
in the second quarter of fiscal 2009. The coffee business comprised
$1.8 billion of net sales in 2008.
Snacks, Coffee and Pet Care net sales increased 4% in 2007 to
$4.5 billion. Unit volume was in line with the prior year as growth in
coffee was offset by a decline in pet care. Snacks volume was in line
with the prior year. Coffee volume was up high-single digits primarily
due to a low base period that included a reduction in the coffee
business from Hurricane Katrina and 2007 volume from the launches
of Folgers Simply Smooth and Gourmet Selections. Pet care volume
was down mid-single digits versus the year-ago period due to strong
competitive activity and the impacts of a voluntary recall. In March
2007, we voluntarily recalled certain Iams and Eukanuba wet pet
foods to help ensure maximum pet safety following the discovery of
contaminated materials at a pet food supplier. Price increases in coffee
and favorable product mix from disproportionate coffee growth each
had a positive 1% impact on net sales. Foreign exchange had a
positive 2% impact on net sales. Net earnings in 2007 increased 24%
to $477 million. Earnings increased behind sales growth and a base
period comparison that included costs related to Hurricane Katrina,
which more than offset a decline in 2007 gross margin from the
impacts of higher commodity costs and expenses associated with the
pet food recall.
Household Care
Fabric Care and Home Care
	 	 	 Change vs.	 	 Change vs.
(in millions of dollars)	 2008	 Prior Year	 2007	 Prior Year*
Volume	 n/a	 +6%	 n/a	 +10%
Net sales 	 $23,831	 +11%	 $21,469	 +13%
Net earnings	 $  3,422	 +9%	 $  3,127	 +20%
* The Gillette business was acquired on October 1, 2005. Therefore, the fiscal 2007 growth
rates are versus a base period that included only 9 months of Gillette Fabric Care and Home
Care results (e.g., batteries).
Fabric Care and Home Care net sales in 2008 increased 11% to
$23.8 billion. Volume was up 6%, price increases added 1% and
favorable foreign exchange added 5% to net sales growth. This was
partially offset by a negative 1% mix impact primarily from dispro-
portionate growth in developing regions and a shift toward large sizes
in fabric care, both of which have selling prices below the segment
48	 The Procter  Gamble Company	 Management’s Discussion and Analysis
average. Fabric care volume increased mid-single digits behind high-
single-digit growth in developing regions and mid-single-digit growth
in developed regions. Growth was driven by the liquid laundry detergent
compaction launch in North America and initiative activity on Tide, Gain,
Ariel and Downy. Home care volume was up mid-single digits due to
double-digit growth in developing regions and high-teens growth on
Febreze from the launch of Febreze Candles. Batteries volume was up
mid-single digits behind double-digit growth in developing regions
and mid-single-digit growth in developed regions.
Net earnings in Fabric Care and Home Care increased 9% to $3.4 billion
in 2008 primarily behind higher net sales. Net earnings margin was
down 20 basis points primarily due to lower gross margin, partially
offset by a reduction in SGA as a percentage of net sales. Gross
margin was down due to higher commodity costs, which more than
offset benefits from pricing, increased volume scale leverage and
manufacturing cost savings projects. SGA improved as a percentage
of net sales due to lower overhead spending as a percentage of net
sales resulting from a focus on overhead productivity improvements.
Fabric Care and Home Care net sales increased 13% in 2007 to
$21.5 billion. Sales growth was driven by a 10% increase in volume
and a 3% favorable foreign exchange impact. The extra three months
of batteries results in fiscal 2007 contributed 3% to the segment’s
sales growth and 2% to segment volume growth. Volume was up
high-single digits in both fabric care and home care led by double-
digit growth in developing regions. In developed regions, fabric care
volume grew mid-single digits and home care volume grew high-
single digits behind product initiatives such as Tide Simple Pleasures,
Gain Joyful Expressions, Febreze Noticeables, upgrades on Swiffer and
the launch of Fairy auto-dishwashing in Western Europe. Our market
share in both fabric care and home care increased by about 1 point
globally during the year. In batteries, organic volume increased mid-
single digits behind high-single-digit developing region growth from
expanded distribution in high-frequency stores in Latin America. Net
earnings in 2007 were up 20% to $3.1 billion behind organic sales
growth, the additional three months of batteries results and an
80-basis point improvement in net earnings margin. Earnings margin
improved behind higher gross margin and lower SGA as a percentage
of net sales. The gross margin improvement was driven by scale
benefits of volume growth and cost savings projects that more than
offset higher commodity costs. SGA improved primarily behind
lower overhead expenses as a percentage of net sales resulting from
volume scale leverage and Gillette synergy savings.
Baby Care and Family Care
	 	 	 Change vs.	 	 Change vs.
(in millions of dollars)	 2008	 Prior Year	 2007	 Prior Year
Volume	 n/a	 +4%	 n/a	 +5%
Net sales 	 $13,898	 +9%	 $12,726	 +6%
Net earnings	 $  1,728	 +20%	 $  1,440	 +11%
Baby Care and Family Care net sales increased 9% in 2008 to
$13.9 billion. Volume was up 4%, including the impact of the Western
European family care divestiture. Price increases contributed 1% to
net sales and foreign exchange had a positive 4% impact on net
sales. Organic volume and organic sales, which exclude the impacts
of the Western European family care divestiture and foreign ex-
change, both grew 8%. Organic volume growth was balanced across
the segment with high-single-digit growth in both baby care and
family care. Baby care volume in developed regions was up mid-single
digits behind growth on the Pampers Baby Stages of Development
and on the Baby Dry Caterpillar Flex initiative. In developing regions,
baby care volume was up double-digits behind continued growth on
Pampers. Baby care market share in the U.S. was up nearly 1 point to
about 29%. Family care volume was down low-single digits due to
the divestiture of the Western European family care business but was
up high-single digits on an organic basis behind the Bounty and
Charmin product restages. U.S. market share on both Bounty and
Charmin was up over 1 point to about 45% and 28%, respectively.
Net earnings in Baby Care and Family Care were up 20% to $1.7 billion
in 2008 behind higher net sales and earnings margin expansion. Net
earnings margin improved 110 basis points primarily behind higher
gross margin and lower SGA as a percentage of net sales. Gross
margin was up due to a more profitable product mix following the
Western Europe family care divestiture, the benefit of increased
volume scale leverage, pricing and manufacturing cost savings projects,
which more than offset higher commodity and energy costs. SGA
improved as a percentage of net sales due to lower overhead spend-
ing as a percentage of net sales, partially offset by higher marketing
expenses as a percentage of net sales.
Baby Care and Family Care net sales increased 6% in 2007 to
$12.7 billion behind 5% unit volume growth. Baby care volume grew
mid-single digits with developing regions up double digits. In devel-
oped regions, baby care volume was up low-single digits as growth
on Pampers Baby Stages of Development and Baby Dry Caterpillar
Flex more than offset softness on Pampers in Western Europe and
Luvs in North America from lower competitor pricing of both branded
and private label products. Family care volume increased mid-single
digits behind product performance upgrades on Bounty and continued
growth on Bounty and Charmin Basic products. Disproportionate growth
on baby care in developing regions and on the Basic tier products,
which have a lower average selling price, led to a negative 1% mix
impact. Favorable foreign exchange contributed 2% to sales growth.
Net earnings in Baby Care and Family Care increased 11% to $1.4 billion
in 2007 behind net sales growth and a 50-basis point improvement in
net earnings margin. Earnings margin increased as lower SGA as a
percentage of net sales more than offset a reduction in gross margin.
Gross margin was down slightly as manufacturing cost savings and
volume scale leverage were more than offset by the impact of higher
pulp costs and a less profitable product mix. SGA improved as a
percentage of net sales due to lower overhead expenses from volume
scale leverage and a reduction in marketing expenses as a percentage
of net sales.
Management’s Discussion and Analysis	 The Procter  Gamble Company	 49
Corporate
Corporate includes certain operating and non-operating activities not
allocated to specific business units. These include: the incidental
businesses managed at the corporate level; financing and investing
activities; other general corporate items; the historical results of certain
divested brands and categories, including certain Gillette brands that
were divested as required by regulatory authorities in relation to the
Gillette acquisition; and certain restructuring-type activities to maintain
a competitive cost structure, including manufacturing and workforce
rationalization. Corporate also includes reconciling items to adjust
the accounting policies used in the segments to U.S. GAAP. The most
significant reconciling items include income taxes (to adjust from statu-
tory rates that are reflected in the segments to the overall Company
effective tax rate), adjustments for unconsolidated entities (to eliminate
sales, cost of products sold and SGA for entities that are consolidated
in the segments but accounted for using the equity method for U.S.
GAAP) and minority interest adjustments for subsidiaries where we do
not have 100% ownership. Since both unconsolidated entities and
less than 100% owned subsidiaries are managed as integral parts of
the Company, they are accounted for similar to a wholly owned
subsidiary for management and segment purposes. This means our
segment results recognize 100% of each income statement component
through before-tax earnings in the segments, with eliminations for
unconsolidated entities in Corporate. In determining segment after-
tax net earnings, we apply the statutory tax rates (with adjustments to
arrive at the Company’s effective tax rate in Corporate) and eliminate
the share of earnings applicable to other ownership interests, in a
manner similar to minority interest.
Corporate net sales primarily reflect the adjustment to eliminate the
sales of unconsolidated entities included in business unit results. Net
sales decreased $462 million primarily driven by higher adjustments
to eliminate the impact of joint venture net sales for unconsolidated
entities that are reflected as sales in the business segments. These
adjustments increased due to sales growth of existing unconsolidated
entities and the addition of the Swiss Precision Diagnostics business.
In 2008, net earnings in Corporate increased $464 million. The increase
was driven primarily by a lower tax rate resulting from the net benefits
of adjustments to reserves for uncertain tax positions.
Corporate segment net earnings declined $235 million in 2007 primarily
due to higher interest expenses and higher Gillette integration costs.
Interest expense was up $185 million primarily due to the financing
costs associated with the debt issued to fund the share repurchase
program announced in conjunction with the Gillette acquisition.
FINANCIAL CONDITION
We believe our financial condition continues to be of high quality, as
evidenced by our ability to generate substantial cash from operations
and ready access to capital markets at competitive rates.
Operating cash flow provides the primary source of funds to finance
operating needs and capital expenditures. Excess operating cash is
used first to fund shareholder dividends. Other discretionary uses
include share repurchases and “tack-on” acquisitions to complement
our portfolio of brands and geographies. As necessary, we may
supplement operating cash flow with debt to fund these activities.
The overall cash position of the Company reflects our strong business
results and a global cash management strategy that takes into account
liquidity management, economic factors and tax considerations.
Operating Activities
Operating cash flow was $15.8 billion in 2008, an increase of 18%
over the prior year. Both operating cash flow and the increase in
operating cash flow over the prior year resulted primarily from higher
net earnings and non-cash charges (depreciation and amortization,
stock-based compensation and deferred income taxes). Working capital
balances increased primarily to support business growth resulting in a
net use of cash. Inventory days on hand increased by 8 days primarily
due to foreign exchange and higher material costs, partially offset by
accounts receivable and accounts payable impacts. Accounts payable
days were up 4 days due to higher material values and increased
capital expenditures in the fourth quarter. Accounts receivable days
were down 2 days primarily due to the harmonization of Gillette trade
terms, which historically carried longer payment terms than PG.
Operating cash flow in 2007 increased 18% to $13.4 billion. Operating
cash flow increased as a result of higher net earnings, including the
benefit of an additional three months of Gillette in 2007. Net earnings,
adjusted for non-cash items (primarily depreciation and amortization,
share-based compensation and deferred income taxes) was partially
offset by cash used to fund working capital. Working capital increased
in 2007 primarily to support business growth.
Free Cash Flow. We view free cash flow as an important measure
because it is one factor impacting the amount of cash available for
dividends and discretionary investment. It is defined as operating cash
flow less capital expenditures and is one of the measures used to
evaluate senior management and determine their at-risk compensation.
In 2008, free cash flow was $12.8 billion, compared to $10.5 billion
in 2007. Free cash flow increased primarily as a result of higher
operating cash flow. Capital expenditures increased from $2.9 billion
in 2007 to $3.0 billion in 2008 representing 3.6% of net sales. Free
cash flow productivity, defined as the ratio of free cash flow to net
earnings, was 106% in 2008, ahead of the Company’s 90% target.
In 2007, free cash flow was $10.5 billion, compared to $8.7 billion
in 2006 as a result of higher operating cash flow. Free cash flow
productivity was 101% in 2007.
50	 The Procter  Gamble Company	 Management’s Discussion and Analysis
Investing Activities
Net investing activities used $2.5 billion of cash in both 2008 and 2007.
Acquisitions. Acquisitions used $381 million of cash in 2008 primarily
for the acquisition of Frederic Fekkai, a premium hair care brand, in
Beauty. In 2007, acquisitions used $492 million of cash for several
minor transactions, primarily in Beauty and Health Care, including the
Swiss Precision Diagnostics business.
Capital Spending. We view capital spending efficiency as a critical
component of our overall cash management strategy. Capital expen-
ditures in 2008 were $3.0 billion, compared to $2.9 billion in 2007.
Capital spending as a percentage of net sales was 3.6% in 2008,
compared to 3.9% in 2007.
Proceeds from Asset Sales. Proceeds from asset sales were $928 million
in 2008 primarily behind the sale of our Western Europe family care
business as well as several minor Beauty and Health Care divestitures.
In 2007, proceeds from asset sales were $281 million primarily due to
the divestitures of Pert in North America, Sure and several non-strategic
minor Beauty brands.
Financing Activities
Dividend Payments. Our first discretionary use of cash is dividend
payments. Dividends per common share increased 13% to $1.45 per
share in 2008. This increase represents the 52nd consecutive fiscal year
the Company has increased its common share dividend. Total dividend
payments to both common and preferred shareholders were $4.7 billion,
$4.2 billion and $3.7 billion in 2008, 2007 and 2006, respectively.
Long-Term and Short-Term Debt. We maintain debt levels we consider
appropriate after evaluating a number of factors, including cash flow
expectations, cash requirements for ongoing operations, investment and
financing plans (including acquisitions and share repurchase activities)
and the overall cost of capital. Total debt was $36.7 billion in 2008,
$35.4 billion in 2007 and $38.1 billion in 2006. Debt increased in 2008
primarily to fund the Company’s treasury share repurchase program
discussed below. The decrease in debt in 2007 was primarily due to
the utilization of operating cash flow to pay down existing balances.
Liquidity. Our primary source of liquidity is cash generated from
operations. We believe internally generated cash flows adequately
support business operations, capital expenditures and shareholder
dividends, as well as a level of other discretionary cash uses
(e.g., for minor acquisitions or share repurchases).
We are able to supplement our liquidity needs, as required, with broad
access to financing in capital markets and four bank credit facilities.
Broad access to financing includes commercial paper programs in
multiple markets at favorable rates given our strong credit ratings
(including separate U.S. dollar and Euro multicurrency programs).
We maintain four bank credit facilities: a $6 billion 364-day facility
expiring in August 2008, a $6 billion 5-year facility expiring in
August 2012, a $3 billion 5-year facility expiring in August 2012 and a
$1.8 billion 364-day facility expiring in June 2009. The facility expiring
in August 2008 is no longer needed and is not planned to be replaced.
The remaining credit facilities are in place to support our ongoing
commercial paper program and can be extended for certain periods
of time as specified in, and in accordance with, the terms of each
credit agreement. We anticipate that these facilities will remain largely
undrawn for the foreseeable future. These credit facilities do not have
cross-default or ratings triggers, nor do they have material adverse
events clauses, except at the time of signing. In addition to these credit
facilities, we have an automatically effective registration statement on
Form S-3 filed with the SEC that is available for registered offerings of
short- or long-term debt securities.
The Company’s Moody’s and Standard  Poor’s (SP) short-term
credit ratings are P-1 and A-1+, respectively. Our Moody’s and SP
long-term credit ratings are Aa3 with a negative outlook and AA-
with a stable outlook, respectively.
Treasury Purchases. Total share repurchases in 2008 were $10.0 bil-
lion, nearly all of which were made under our publicly announced
share repurchase plan. Under this plan, which began in July 2007, the
Company expects to repurchase $24 – 30 billion of Company shares
at a rate of $8 – 10 billion per year. Total share repurchases in 2007
were $5.6 billion.
Guarantees and Other Off-Balance Sheet Arrangements. We do
not have guarantees or other off-balance sheet financing arrangements,
including variable interest entities, which we believe could have a
material impact on financial condition or liquidity.
Contractual Commitments. The following table provides information
on our contractual commitments as of June 30, 2008.
Management’s Discussion and Analysis	 The Procter  Gamble Company	 51
	 	 	 	 	 	 	 	 Less Than	 	 	 After	
(in millions of dollars)	 	 	 	 	 	 Total	 1 Year	 1–3 Years	 3–5 Years	 5 Years
Recorded liabilities
Total debt						 $36,321	 $13,063	 $  5,426	 $3,807	 $14,025
Capital leases						 407	 55	 90	 76	 186
Unrecognized tax benefit (1)						 318	 318	 —	 —	 —
Other
Interest payments relating to long-term debt					 13,084	 1,230	 1,921	 1,746	 8,187
Operating leases (2)						 1,656	 299	 528	 381	 448
Minimum pension funding (3)						 1,401	 575	 826	 —	 —
Purchase obligations (4)						 4,326	 1,205	 1,662	 1,096	 363
Total Contractual Commitments	 				 57,513	 16,745	 10,453	 7,106	 23,209
(1) As of June 30, 2008, the Company’s Consolidated Balance Sheet reflects a liability for unrecognized tax benefits of $3.4 billion, including $811 of interest and penalties. Due to the high degree of
uncertainty regarding the timing of future cash outflows of liabilities for unrecognized tax benefits beyond one year, a reasonable estimate of the period of cash settlement for the next twelve
months beyond the balance sheet date of June 30, 2008, can not be made.
(2) Operating lease obligations are shown net of guaranteed sublease income.
(3) Represents future pension payments to comply with local funding requirements. The projected payments beyond fiscal year 2011 are not currently determinable.
(4) Primarily reflects future contractual payments under various take-or-pay arrangements entered into as part of the normal course of business. Commitments made under take-or-pay obligations
represent future purchases in line with expected usage to obtain favorable pricing. Approximately 36% relates to service contracts for information technology, human resources management and
facilities management activities that were outsourced in recent years. While the amounts listed represent contractual obligations, we do not believe it is likely that the full contractual amount would
be paid if the underlying contracts were canceled prior to maturity. In such cases, we generally are able to negotiate new contracts or cancellation penalties, resulting in a reduced payment. The
amounts do not include obligations related to other contractual purchase obligations that are not take-or-pay arrangements. Such contractual purchase obligations are primarily purchase orders at
fair value that are part of normal operations and are reflected in historical operating cash flow trends. We do not believe such purchase obligations will adversely affect our liquidity position.
product return allowances is recorded as a reduction of sales within the
same period that the revenue is recognized. We offer sales incentives
to customers and consumers through various programs, consisting
primarily of customer pricing allowances, merchandising funds and
consumer coupons. The cost of these programs is recognized as
incurred and recorded as a reduction of sales. Given the nature of our
business, revenue recognition practices do not contain estimates that
materially affect results of operations.
Income Taxes
Our annual tax rate is determined based on our income, statutory tax
rates and the tax impacts of items treated differently for tax purposes
than for financial reporting purposes. Tax law requires certain items
to be included in the tax return at different times than the items are
reflected in the financial statements. Some of these differences are
permanent, such as expenses that are not deductible in our tax return,
and some differences are temporary, reversing over time, such as
depreciation expense. These temporary differences create deferred
tax assets and liabilities.
Deferred tax assets generally represent items that can be used as a
tax deduction or credit in future years for which we have already
recorded the tax benefit in our income statement. Deferred tax
liabilities generally represent tax expense recognized in our financial
statements for which payment has been deferred, or expenditures for
which we have already taken a deduction in our tax return but have
not yet been recognized in our financial statements or assets recorded
at fair value in business combinations for which there was no corre-
sponding tax basis adjustment.
SIGNIFICANT ACCOUNTING POLICIES AND ESTIMATES
In preparing our financial statements in accordance with U.S. GAAP,
there are certain accounting policies that are particularly important.
These include revenue recognition, income taxes, certain employee
benefits, acquisitions, and goodwill and intangible assets. We believe
these accounting policies, and others set forth in Note 1 to the
Consolidated Financial Statements, should be reviewed as they are
integral to understanding the results of operations and financial
condition of the Company. In the case of revenue recognition, these
policies simply represent required accounting and there is minimal
judgment or estimation involved. In other areas, they may represent
a choice between acceptable accounting methods or may require
substantial judgment or estimation in their application.
Due to the nature of our business, these estimates generally are not
considered highly uncertain at the time of estimation, meaning they
are not expected to result in changes that would materially affect our
financial condition, results of operations or cash flows in any given year.
The Company has discussed the selection of significant accounting
policies and the effect of estimates with the Audit Committee of the
Company’s Board of Directors.
Revenue Recognition
Most of our revenue transactions represent sales of inventory, and we
recognize revenue when title, ownership and risk of loss transfer to
the customer, which can be on the date of shipment or the date of
receipt by the customer. The revenue recorded is presented net of sales
and other taxes we collect on behalf of governmental authorities and
includes shipping and handling costs, which generally are included in
the list price to the customer. A provision for payment discounts and
52	 The Procter  Gamble Company	 Management’s Discussion and Analysis
Inherent in determining our annual tax rate are judgments regarding
business plans, planning opportunities and expectations about future
outcomes. Realization of certain deferred tax assets is dependent upon
generating sufficient taxable income in the appropriate jurisdiction prior
to the expiration of the carry-forward periods. Although realization is
not assured, management believes it is more likely than not that our
deferred tax assets, net of valuation allowances, will be realized.
We operate in multiple jurisdictions with complex regulatory environ-
ments subject to different interpretations by the taxpayer and respective
governmental taxing authorities. In certain of these jurisdictions we
may take positions that management believes are supportable, but
are potentially subject to successful challenge by the applicable taxing
authority. We evaluate our tax positions and establish liabilities in accor-
dance with Financial Accounting Standards Board Interpretation No. 48,
“Accounting for Uncertainty in Income Taxes” (FIN 48). We review
these tax uncertainties in light of the changing facts and circumstances,
such as the progress of tax audits, and adjust them accordingly. We
have a number of audits in process in various jurisdictions. Although
the resolution of these tax positions is uncertain, based on currently
available information, we believe that the ultimate outcomes will not
have a material adverse effect on our financial position, results of
operations or cash flows.
Because there are a number of estimates and assumptions inherent in
calculating the various components of our tax provision, certain changes
or future events such as changes in tax legislation, geographic mix of
earnings, completion of tax audits or earnings repatriation plans could
have an impact on those estimates and our effective tax rate.
Employee Benefits
We sponsor various post-employment benefits throughout the world.
These include pension plans, both defined contribution plans and
defined benefit plans, and other post-employment benefit (OPEB) plans,
consisting primarily of health care and life insurance for retirees. For
accounting purposes, the defined benefit and OPEB plans require
assumptions to estimate the projected and accumulated benefit
obligations, including the following variables: discount rate; expected
salary increases; certain employee-related factors, such as turnover,
retirement age and mortality; expected return on assets and health
care cost trend rates. These and other assumptions affect the annual
expense and obligations recognized for the underlying plans. Our
assumptions reflect our historical experiences and management’s best
judgment regarding future expectations. In accordance with U.S. GAAP,
the net amount by which actual results differ from our assumptions is
deferred. If this net deferred amount exceeds 10% of the greater of
plan assets or liabilities, a portion of the deferred amount is included
in expense for the following year. The cost or benefit of plan changes,
such as increasing or decreasing benefits for prior employee service
(prior service cost), is deferred and included in expense on a straight-
line basis over the average remaining service period of the employees
expected to receive benefits.
The expected return on plan assets assumption is important, since many
of our defined benefit plans and our primary OPEB plan are funded.
The process for setting the expected rates of return is described in
Note 9 to the Consolidated Financial Statements. For 2008, the average
return on assets assumption for pension plan assets and OPEB assets
was 7.4% and 9.3%, respectively. A change in the rate of return of
0.5% for both pension and OPEB assets would impact annual benefit
expense by less than $50 million after tax.
Since pension and OPEB liabilities are measured on a discounted
basis, the discount rate is a significant assumption. Discount rates
used for our U.S. defined benefit and OPEB plans are based on a yield
curve constructed from a portfolio of high quality bonds for which
the timing and amount of cash outflows approximate the estimated
payouts of the plan. For our international plans, the discount rates are
set by benchmarking against investment grade corporate bonds rated
AA or better. The average discount rate on the defined benefit pension
plans of 6.3% represents a weighted average of local rates in countries
where such plans exist. A 0.5% change in the discount rate would
impact annual after-tax benefit expense by less than $50 million.
The rate on the OPEB plan of 6.9% reflects the higher interest rates
generally applicable in the U.S., which is where a majority of the plan
participants receive benefits. A 0.5% change in the discount rate
would impact annual after-tax OPEB expense by less than $10 million.
Certain defined contribution pension and OPEB benefits in the U.S. are
funded by the Employee Stock Ownership Plan (ESOP), as discussed in
Note 9 to the Consolidated Financial Statements.
Acquisitions
We account for acquired businesses using the purchase method of
accounting. Under the purchase method, our Consolidated Financial
Statements reflect the operations of an acquired business starting from
the completion of the acquisition. In addition, the assets acquired and
liabilities assumed must be recorded at the date of acquisition at their
respective estimated fair values, with any excess of the purchase price
over the estimated fair values of the net assets acquired recorded as
goodwill.
Significant judgment is required in estimating the fair value of intan-
gible assets and in assigning their respective useful lives. Accordingly,
we typically obtain the assistance of third-party valuation specialists
for significant items. The fair value estimates are based on available
historical information and on future expectations and assumptions
deemed reasonable by management, but are inherently uncertain.
We typically use an income method to estimate the fair value of
intangible assets, which is based on forecasts of the expected future
cash flows attributable to the respective assets. Significant estimates
and assumptions inherent in the valuations reflect a consideration of
other marketplace participants, and include the amount and timing of
future cash flows (including expected growth rates and profitability),
the underlying product or technology life cycles, economic barriers to
entry, a brand’s relative market position and the discount rate applied
to the cash flows. Unanticipated market or macroeconomic events
and circumstances may occur, which could affect the accuracy or
validity of the estimates and assumptions.
Management’s Discussion and Analysis	 The Procter  Gamble Company	 53
Determining the useful life of an intangible asset also requires judg-
ment. Certain brand intangibles are expected to have indefinite lives
based on their history and our plans to continue to support and build
the acquired brands. Other acquired brands are expected to have
determinable useful lives. Our assessment as to brands that have an
indefinite life and those that have a determinable life is based on a
number of factors including competitive environment, market share,
brand history, underlying product life cycles, operating plans and the
macroeconomic environment of the countries in which the brands are
sold. Our estimates of the useful lives of determinable-lived intangibles,
primarily including brands, technologies and customer relationships, are
primarily based on these same factors. All of our acquired technology
and customer-related intangibles are expected to have determinable
useful lives.
Other significant estimates associated with the accounting for acqui-
sitions include exit costs. Provided certain criteria are met, exit costs
related to acquired operations are treated as assumed liabilities. If
those criteria are not met, the costs are treated as operating expenses
of the combined company as incurred. Exit costs, consisting primarily
of severance costs, facility closure and other exit costs related to
redundant manufacturing, selling, general and administrative functions,
are based upon plans that have been committed to by management
but which are subject to refinement. Significant estimates and assump-
tions inherent in the calculation of exit costs relate to the number
of employees that will be terminated, future costs to operate and
eventually vacate duplicate facilities and costs to terminate agreements.
These estimates and assumptions may change as we execute approved
plans. Decreases to the estimated costs are generally recorded as
an adjustment to goodwill. Increases to the estimates are generally
recorded as an adjustment to goodwill during the purchase price
allocation period (generally within one year of the acquisition date)
and as operating expenses thereafter.
Goodwill and Intangible Assets
Acquired intangible assets may represent indefinite-lived assets
(e.g., certain trademarks or brands), determinable-lived intangibles (e.g.,
certain trademarks or brands, customer relationships, patents and
technologies) or residual goodwill. Of these, only the costs of
determinable-lived intangibles are amortized to expense over their
estimated life. The value of indefinite-lived intangible assets and
residual goodwill is not amortized, but is tested at least annually for
impairment. Our impairment testing for goodwill is performed sepa-
rately from our impairment testing of indefinite-lived intangibles. We
test goodwill for impairment, at least annually, by reviewing the book
value compared to the fair value at the reportable unit level. We test
individual indefinite-lived intangibles at least annually by reviewing
the individual book values compared to the fair value. Considerable
management judgment is necessary to evaluate the impact of operating
and macroeconomic changes and to estimate future cash flows to
measure fair value. Assumptions used in the Company’s impairment
evaluations, such as forecasted growth rates and cost of capital, are
consistent with internal projections and operating plans. We believe
such assumptions and estimates are also comparable to those that
would be used by other marketplace participants. When certain events
or changes in operating conditions occur, indefinite-lived intangible
assets may be reclassified to a determinable life asset and an additional
impairment assessment may be performed. We did not recognize any
material impairment charges for goodwill or intangible assets during
the years presented.
The recorded value of goodwill and intangible assets from recently
acquired businesses are derived from more recent business operating
plans and macroeconomic environmental conditions and therefore are
more susceptible to an adverse change that could require an impair-
ment charge. Indefinite-lived intangible assets totaled $27.9 billion
at June 30, 2008, of which $24.7 billion represent recently acquired
Gillette intangible assets. The Gillette indefinite-lived intangible assets
were recorded at estimated fair values as of the acquisition date. Total
goodwill is $59.8 billion at June 30, 2008, of which $38.0 billion
results from the Gillette acquisition. Such goodwill reflects the residual
amount from a purchase price allocation as of the acquisition date.
Because the Gillette intangible and goodwill amounts represent current
values as of the relatively recent acquisition date, such amounts are
more susceptible to an impairment risk if business operating results
or macroeconomic conditions deteriorate.
New Accounting Pronouncements
As more fully discussed in Notes 1 and 10 to the Consolidated Financial
Statements, on July 1, 2007, we adopted FASB Interpretation No. 48,
“Accounting for Uncertainty in Income Taxes — an interpretation of
FASB Statement No.109” (FIN 48). FIN 48 addresses the accounting
and disclosure of uncertain tax positions. FIN 48 prescribes a recognition
threshold and measurement attribute for the financial statement
recognition and measurement of a tax position taken or expected
to be taken in a tax return. The difference between the tax benefit
recognized in the financial statements for a position in accordance with
FIN 48 and the tax benefit claimed in the tax return is referred to as
an unrecognized tax benefit.
As more fully discussed in Notes 1 and 9 to the Consolidated Financial
Statements, we adopted SFAS No. 158, “Employers’ Accounting for
Defined Benefit Pension and Other Postretirement Plans — an amend-
ment of FASB Statements No. 87, 88, 106, and 132(R),” (SFAS 158) at
June 30, 2007. SFAS 158 requires companies to recognize the over-
funded and under-funded status of defined benefit pension and other
postretirement plans as assets or liabilities on their balance sheets and
to recognize previously unrecognized changes in that funded status,
in the year in which changes occur, through other comprehensive
income in shareholders’ equity.
In September 2006 the FASB issued SFAS No. 157, “Fair Value
Measurements” (SFAS 157). This standard defines fair value, establishes
a framework for measuring fair value in generally accepted accounting
principles, and expands disclosures about fair value measurements.
The standard, as amended, is effective for the Company beginning
July 1, 2008, for certain financial assets and liabilities and beginning
July 1, 2009, for non-financial assets and liabilities recognized or
disclosed at fair value on a nonrecurring basis. We believe that the
adoption of SFAS 157 will not have a material effect on our financial
position, results of operations or cash flows.
54	 The Procter  Gamble Company	 Management’s Discussion and Analysis
In December 2007, the FASB issued SFAS No. 141 (Revised), “Business
Combinations” (SFAS 141(R)) and SFAS No. 160, “Noncontrolling
Interests in Consolidated Financial Statements — an amendment of
ARB No. 51” (SFAS 160). SFAS 141(R) and SFAS 160 revise the method
of accounting for a number of aspects of business combinations and
noncontrolling interests, including acquisition costs, contingencies
(including contingent assets, contingent liabilities and contingent
purchase price), the impacts of partial and step-acquisitions (including
the valuation of net assets attributable to non-acquired minority
interests), and post acquisition exit activities of acquired businesses.
SFAS 141(R) and SFAS 160 will be effective for the Company during
our fiscal year beginning July 1, 2009.
In March 2008, the FASB issued SFAS No. 161, “Disclosures about
Derivative Instruments and Hedging Activities — an amendment of
FASB Statement No. 133“ (SFAS 161). SFAS 161 impacts disclosures
only and will provide additional qualitative and quantitative information
on the use of derivatives and their impact on an entity’s financial
position, financial performance, and cash flows. SFAS 161 will be
effective for the Company beginning January 1, 2009.
No other new accounting pronouncement issued or effective during
the fiscal year has had or is expected to have a material impact on the
Consolidated Financial Statements.
OTHER INFORMATION
Hedging and Derivative Financial Instruments
As a multinational company with diverse product offerings, we are
exposed to market risks such as changes in interest rates, currency
exchange rates and commodity prices. To manage the volatility
related to these exposures, we evaluate our exposures on a global
basis to take advantage of the direct netting opportunities and of
currency, interest rate and commodity correlations that exist within
the portfolio. For the remaining exposures, we enter into various
derivative transactions in accordance with the Company’s hedging
policies that are designed to partially, or entirely, offset changes in
the underlying exposures being hedged. We do not hold or issue
derivative financial instruments for speculative trading purposes.
Note 6 to the Consolidated Financial Statements includes a detailed
discussion of our accounting policies for financial instruments.
Derivative positions are monitored using techniques including market
valuation, sensitivity analysis and value-at-risk modeling. The tests for
interest rate, currency rate and commodity price exposures discussed
below are based on the CorporateManager™
value-at-risk model
using a one-year horizon and a 95% confidence level. The model
incorporates the impact of correlation (the degree to which exposures
move together over time) and diversification (from holding multiple
currency, commodity and interest rate instruments) and assumes that
financial returns are normally distributed. Estimates of volatility and
correlations of market factors are drawn from the RiskMetrics™
dataset
as of June 30, 2008. In cases where data is unavailable in RiskMetrics™
,
a reasonable proxy is included.
Our market risk exposures relative to interest rates, currency rates and
commodity prices, as discussed below, have not changed materially
versus the previous reporting period. In addition, we are not aware
of any facts or circumstances that would significantly impact such
exposures in the near term.
Interest Rate Exposure on Financial Instruments. Interest rate swaps
are used to hedge exposures to interest rate movement on underlying
debt obligations. Certain interest rate swaps denominated in foreign
currencies are designated to hedge exposures to currency exchange
rate movements on our investments in foreign operations. These
currency interest rate swaps are designated as hedges of the Company’s
foreign net investments.
Based on our overall interest rate exposure as of and during the year
ended June 30, 2008, including derivative and other instruments
sensitive to interest rates, we believe a near-term change in interest
rates, at a 95% confidence level based on historical interest rate
movements, would not materially affect our financial statements.
Currency Rate Exposure on Financial Instruments. Because we
manufacture and sell products in a number of countries throughout
the world, we are exposed to the impact on revenue and expenses
of movements in currency exchange rates. The primary purpose of
our currency hedging activities is to reduce the risk that our financial
position will be adversely affected by short-term changes in exchange
rates. Corporate policy prescribes the range of allowable hedging
activity. We primarily use forward contracts and options with maturities
of less than 18 months.
In addition, we enter into certain currency swaps with maturities of up
to five years to hedge our exposure to exchange rate movements on
intercompany financing transactions. We also use purchased currency
options with maturities of generally less than 18 months and forward
contracts to hedge against the effect of exchange rate fluctuations
on intercompany royalties and to offset a portion of the effect of
exchange rate fluctuations on income from international operations.
Based on our overall currency rate exposure as of and during the year
ended June 30, 2008, we believe, at a 95% confidence level based
on historical currency rate movements, the impact of a near-term
change in currency rates on derivative and other instruments would
not materially affect our financial statements.
Commodity Price Exposure on Financial Instruments. We use raw
materials that are subject to price volatility caused by weather, supply
conditions, political and economic variables and other unpredictable
factors. In addition to fixed price contracts, we use futures, options
and swap contracts to manage the volatility related to the above
exposures.
Based on our overall commodity price exposure as of and during the
year ended June 30, 2008, we believe, at a 95% confidence level based
on historical commodity price movements, the impact of a near-term
change in commodity prices on derivative and other instruments
would not materially affect our financial statements.
Management’s Discussion and Analysis	 The Procter  Gamble Company	 55
Measures Not Defined By U.S. GAAP
Our discussion of financial results includes several “non-GAAP”
financial measures. We believe these measures provide our investors
with additional information about our underlying results and trends, as
well as insight to some of the metrics used to evaluate management.
When used in MDA, we have provided the comparable GAAP
measure in the discussion. These measures include:
Organic Sales Growth. Organic sales growth measures sales growth
excluding the impacts of foreign exchange, acquisitions and divestitures
from year-over-year comparisons. The Company believes this provides
investors with a more complete understanding of underlying results
and trends by providing sales growth on a consistent basis.
The following table provides a numerical reconciliation of organic
sales growth to reported net sales growth for fiscal 2008:
	 	 	 	 	 	 	 	 	 	 Fabric	
	 	 	 	 	 Total 	 	 	 	 Snacks, Coffee 	 Care and 	 Baby Care and	
	 	 	 	 	 Company	 Beauty	 Grooming	 Health Care	 and Pet Care	 Home Care	 Family Care
Reported net sales growth				 9%	 9%	 11%	 9%	 7%	 11%	 9%
Acquisitions  divestitures impact			 +1%	 +1%	 0%	 -1%	 0%	 0%	 +3%
Foreign exchange impact				 -5%	 -6%	 -7%	 -5%	 -3%	 -5%	 -4%
Organic sales growth				 5%	 4%	 4%	 3%	 4%	 6%	 8%
The following table provides a numerical reconciliation of organic
sales growth to reported net sales growth for fiscal 2007:
	 	 	 Total	
	 	 	 Company	 Grooming	 Health Care
Reported net sales growth		 12%	 45%	 13%
Acquisitions  divestitures impact	 -5%	 -35%	 -4%
Foreign exchange impact		 -2%	 -4%	 -2%
Organic sales growth		 5%	 6%	 7%
Free Cash Flow. Free cash flow is defined as operating cash flow less
capital spending. The Company views free cash flow as an important
measure because it is one factor in determining the amount of cash
available for dividends and discretionary investment. Free cash flow is
also one of the measures used to evaluate senior management and is
a factor in determining their at-risk compensation.
Free Cash Flow Productivity. Free cash flow productivity is defined as
the ratio of free cash flow to net earnings. The Company’s target is to
generate free cash flow at or above 90% of net earnings. Free cash
flow productivity is one of the measures used to evaluate senior
management and is a factor in determining their at-risk compensation.
The following table provides a numerical reconciliation of free cash flow:
	 	 	 	 	 	 Free	
	 	 Operating 	 Capital	 Free	 Net	 Cash Flow	
	 	 Cash Flow	 Spending	 Cash Flow	 Earnings	 Productivity
2008	 $15,814	 $(3,046)	 $12,768	 $12,075	 106%
2007	 $13,435	 $(2,945)	 $10,490	 $10,340	 101%
See accompanying Notes to Consolidated Financial Statements.
56	 The Procter  Gamble Company	
Consolidated Statements of Earnings
Amounts in millions except per share amounts	; Years ended June 30	 	 	 	 	 	 2008	 2007	 2006
Net Sales								 $83,503	 $76,476	 $68,222
Cost of products sold								 40,695	 36,686	 33,125
Selling, general and administrative expense							 25,725	 24,340	 21,848
Operating Income								 17,083	 15,450	 13,249
Interest expense								 1,467	 1,304	 1,119
Other non-operating income, net							 462	 564	 283
Earnings Before Income Taxes							 16,078	 14,710	 12,413
Income taxes								 4,003	 4,370	 3,729
Net Earnings								 $12,075	 $10,340	 $  8,684
Basic Net Earnings Per Common Share							 $   3.86	 $   3.22	 $   2.79
Diluted Net Earnings Per Common Share						 $   3.64	 $   3.04	 $   2.64
Dividends Per Common Share							 $   1.45	 $   1.28	 $   1.15
The Procter  Gamble Company	 57
See accompanying Notes to Consolidated Financial Statements.
Consolidated Balance Sheets
Amounts in millions; June 30	 	 	 	 	 	 	 	 	 2008	 2007
Current Assets
Cash and cash equivalents									 $   3,313	 $   5,354
Investment securities									 228	 202
Accounts receivable									 6,761	 6,629
Inventories
	 Materials and supplies									 2,262	 1,590
	 Work in process									 765	 444
	 Finished goods									 5,389	 4,785
Total inventories									 8,416	 6,819
Deferred income taxes									 2,012	 1,727
Prepaid expenses and other current assets								 3,785	 3,300
Total Current Assets									 24,515	 24,031
Property, Plant and Equipment
	 Buildings									 7,052	 6,380
	 Machinery and equipment									 30,145	 27,492
	 Land									 889	 849
Total property, plant and equipment								 38,086	 34,721
Accumulated depreciation	 								 (17,446)	 (15,181)
Net Property, Plant and Equipment								 20,640	 19,540
Goodwill and Other Intangible Assets
Goodwill									 59,767	 56,552
Trademarks and other intangible assets, net								 34,233	 33,626
Net Goodwill and Other Intangible Assets							 94,000	 90,178
Other Noncurrent Assets									 4,837	 4,265
Total Assets									 $143,992	 $138,014
Current Liabilities
Accounts payable									 $   6,775	 $   5,710
Accrued and other liabilities									 10,154	 9,586
Taxes payable									 945	 3,382
Debt due within one year									 13,084	 12,039
Total Current Liabilities									 30,958	 30,717
Long-Term Debt									 23,581	 23,375
Deferred Income Taxes									 11,805	 12,015
Other Noncurrent Liabilities								 8,154	 5,147
Total Liabilities									 74,498	 71,254
Shareholders’ Equity
Convertible Class A preferred stock, stated value $1 per share (600 shares authorized)				 1,366	 1,406
Non-Voting Class B preferred stock, stated value $1 per share (200 shares authorized)				 —	 —
Common stock, stated value $1 per share (10,000 shares authorized; shares issued: 2008 – 4,001.8, 2007 – 3,989.7)		 4,002	 3,990
Additional paid-in capital									 60,307	 59,030
Reserve for ESOP debt retirement								 (1,325)	 (1,308)
Accumulated other comprehensive income								 3,746	 617
Treasury stock, at cost (shares held: 2008 – 969.1, 2007 – 857.8)						 (47,588)	 (38,772)
Retained earnings									 48,986	 41,797
Total Shareholders’ Equity									 69,494	 66,760
Total Liabilities and Shareholders’ Equity							 $143,992	 $138,014
See accompanying Notes to Consolidated Financial Statements.
58	 The Procter  Gamble Company	
Consolidated Statements of Shareholders’ Equity
	 	 	 	 	 	 	 	 Accumulated	
	 	 	 Common	 	 	 Additional	 Reserve for	 Other	
	 	 	 Shares	 Common 	 Preferred	 Paid-In	 ESOP Debt	 Comprehensive	 Treasury	 Retained	
Dollars in millions  / Shares in thousands	 	 Outstanding	 Stock	 Stock	 Capital	 Retirement	 Income	 Stock	 Earnings	 Total
Balance June 30, 2005		 2,472,934 	 $2,977 	 $1,483 	 $  3,030 	 $(1,259)	 $(1,566)	 $(17,194)	 $31,004 	 $18,475
Net earnings									 8,684 	 8,684
Other comprehensive income:
	 Financial statement translation						 1,316 			 1,316
	 Net investment hedges,
net of $472 tax							 (786)			 (786)
	 Other, net of tax benefits							 518			 518
	 Total comprehensive income										 $  9,732
Dividends to shareholders:
	 Common									 (3,555)	 (3,555)
	 Preferred, net of tax benefits									 (148)	 (148)
Treasury stock purchases		 (297,132)			 (9)			 (16,821)		 (16,830)
Employee plan issuances		 36,763	 16		 1,308			 887	 (319)	 1,892
Preferred stock conversions		 3,788		 (32)	 5			 27		 —
Gillette acquisition		 962,488	 983		 53,522			 (1,134)		 53,371
ESOP debt impacts						 (29)				 (29)
Balance June 30, 2006		 3,178,841	 3,976	 1,451	 57,856	 (1,288)	 (518)	 (34,235)	 35,666	 62,908
Net earnings									 10,340	 10,340
Other comprehensive income:
	 Financial statement translation						 2,419			 2,419
	 Net investment hedges,
net of $488 tax							 (835)			 (835)
	 Other, net of tax benefits							 (116)			 (116)
	 Total comprehensive income										 $11,808
Adjustment to initially apply
SFAS 158, net of tax							 (333)			 (333)
Dividends to shareholders:
	 Common									 (4,048)	 (4,048)
	 Preferred, net of tax benefits									 (161)	 (161)
Treasury stock purchases		 (89,829)						 (5,578)		 (5,578)
Employee plan issuances		 37,824	 14		 1,167			 1,003		 2,184
Preferred stock conversions		 5,110		 (45)	 7			 38		 —
ESOP debt impacts						 (20)				 (20)
Balance June 30, 2007		 3,131,946	 3,990	 1,406	 59,030	 (1,308)	 617	 (38,772)	 41,797	 66,760
Net earnings									 12,075	 12,075
Other comprehensive income:
	 Financial statement translation						 6,543			 6,543
	 Net investment hedges,
net of $1,719 tax							 (2,951)			 (2,951)
	 Other, net of tax benefits							 (463)			 (463)
	 Total comprehensive income										 $15,204
Cumulative impact for
adoption of FIN 48									 (232)	 (232)
Dividends to shareholders:
	 Common									 (4,479)	 (4,479)
	 Preferred, net of tax benefits									 (176)	 (176)
Treasury stock purchases		 (148,121)						 (10,047)		 (10,047)
Employee plan issuances		 43,910	 12		 1,272			 1,196		 2,480
Preferred stock conversions	 	 4,982		 (40)	 5			 35		 —
ESOP debt impacts						 (17)			 1	 (16)
Balance June 30, 2008	 	 3,032,717	 $4,002	 $1,366	 $60,307	 $(1,325)	 $ 3,746	 $(47,588)	 $48,986	 $69,494
The Procter  Gamble Company	 59
See accompanying Notes to Consolidated Financial Statements.
Consolidated Statements of Cash Flows
Amounts in millions; Years ended June 30		 	 	 	 	 	 	 2008	 2007	 2006
Cash and Cash Equivalents, Beginning of Year						 $  5,354	 $  6,693	 $  6,389
Operating Activities
Net earnings								 12,075	 10,340	 8,684
Depreciation and amortization								 3,166	 3,130	 2,627
Share-based compensation expense							 555	 668	 585
Deferred income taxes								 1,214	 253	 (112)
Change in accounts receivable								 432	 (729)	 (524)
Change in inventories								 (1,050)	 (389)	 383
Change in accounts payable, accrued and other liabilities						 134	 (273)	 230
Change in other operating assets and liabilities						 (1,239)	 (157)	 (508)
Other								 527	 592	 10
Total Operating Activities								 15,814	 13,435	 11,375
Investing Activities
Capital expenditures								 (3,046)	 (2,945)	 (2,667)
Proceeds from asset sales								 928	 281	 882
Acquisitions, net of cash acquired							 (381)	 (492)	 171
Change in investment securities								 (50)	 673	 884
Total Investing Activities							 	 (2,549)	 (2,483)	 (730)
Financing Activities
Dividends to shareholders								 (4,655)	 (4,209)	 (3,703)
Change in short-term debt								 1,844	 8,981	 (8,627)
Additions to long-term debt								 7,088	 4,758	 22,545
Reductions of long-term debt								 (11,747)	 (17,929)	 (5,282)
Impact of stock options and other							 1,867	 1,499	 1,319
Treasury stock purchases								 (10,047)	 (5,578)	 (16,830)
Total Financing Activities								 (15,650)	 (12,478)	 (10,578)
Effect of Exchange Rate Changes on Cash and Cash Equivalents				 344	 187	 237
Change in Cash and Cash Equivalents							 (2,041)	 (1,339)	 304
Cash and Cash Equivalents, End of Year						 $  3,313	 $  5,354	 $6,693
Supplemental Disclosure
Cash payments for:
	 Interest								 $  1,373	 $  1,330	 $  1,045
	 Income taxes								 3,499	 4,116	 2,869
Assets acquired through non-cash capital leases						 13	 41	 363
Gillette acquisition funded by share issuance							 —	 —	 53,371
Amounts in millions of dollars except per share amounts or as otherwise specified.
60	 The Procter  Gamble Company	
NOTE 1
SUMMARY OF SIGNIFICANT ACCOUNTING POLICIES
Nature of Operations
The Procter  Gamble Company’s (the “Company,” “we” or “us”)
business is focused on providing branded consumer goods products
of superior quality and value. Our products are sold in more than
180 countries primarily through retail operations including mass
merchandisers, grocery stores, membership club stores, drug stores,
department stores, salons and high-frequency stores. We have on-the-
ground operations in approximately 80 countries.
Basis of Presentation
The Consolidated Financial Statements include The Procter  Gamble
Company and its controlled subsidiaries. Intercompany transactions
are eliminated.
Use of Estimates
Preparation of financial statements in conformity with accounting
principles generally accepted in the United States of America (U.S. GAAP)
requires management to make estimates and assumptions that affect
the amounts reported in the Consolidated Financial Statements and
accompanying disclosures. These estimates are based on management’s
best knowledge of current events and actions the Company may
undertake in the future. Estimates are used in accounting for, among
other items, consumer and trade promotion accruals, pensions, post-
employment benefits, stock options, valuation of acquired intangible
assets, useful lives for depreciation and amortization, future cash
flows associated with impairment testing for goodwill, indefinite-lived
intangible assets and long-lived assets, deferred tax assets, uncertain
income tax positions and contingencies. Actual results may ultimately
differ from estimates, although management does not believe such
differences would materially affect the financial statements in any
individual year.
Revenue Recognition
Sales are recognized when revenue is realized or realizable and has
been earned. Most revenue transactions represent sales of inventory.
The revenue recorded is presented net of sales and other taxes we
collect on behalf of governmental authorities and includes shipping
and handling costs, which generally are included in the list price to
the customer. Our policy is to recognize revenue when title to the
product, ownership and risk of loss transfer to the customer, which can
be on the date of shipment or the date of receipt by the customer.
A provision for payment discounts and product return allowances is
recorded as a reduction of sales in the same period that the revenue
is recognized.
Trade promotions, consisting primarily of customer pricing allowances,
merchandising funds and consumer coupons, are offered through
various programs to customers and consumers. Sales are recorded
net of trade promotion spending, which is recognized as incurred,
generally at the time of the sale. Most of these arrangements have
terms of approximately one year. Accruals for expected payouts under
these programs are included as accrued marketing and promotion in
the accrued and other liabilities line item in the Consolidated Balance
Sheets.
Cost of Products Sold
Cost of products sold is primarily comprised of direct materials and
supplies consumed in the manufacture of product, as well as manu-
facturing labor, depreciation expense and direct overhead expense
necessary to acquire and convert the purchased materials and sup-
plies into finished product. Cost of products sold also includes the
cost to distribute products to customers, inbound freight costs,
internal transfer costs, warehousing costs and other shipping and
handling activity.
Selling, General and Administrative Expense
Selling, general and administrative (SGA) expense is primarily
comprised of marketing expenses, selling expenses, research and
development costs, administrative and other indirect overhead costs,
depreciation and amortization expense on non-manufacturing assets
and other miscellaneous operating items. Research and development
costs are charged to expense as incurred and were $2,226 in 2008,
$2,112 in 2007 and $2,075 in 2006. Advertising costs, charged to
expense as incurred, include worldwide television, print, radio, internet
and in-store advertising expenses and were $8,667 in 2008, $7,937
in 2007 and $7,122 in 2006. Non-advertising related components of
the Company’s total marketing spending include costs associated
with consumer promotions, product sampling and sales aids, all of
which are included in SGA expense, as well as coupons and customer
trade funds, which are recorded as reductions to net sales.
Other Non-Operating Income, Net
Other non-operating income, net, primarily includes divestiture gains
and interest and investment income.
Currency Translation
Financial statements of operating subsidiaries outside the United
States of America (U.S.) generally are measured using the local
currency as the functional currency. Adjustments to translate those
statements into U.S. dollars are recorded in other comprehensive
income. Currency translation adjustments in accumulated other
comprehensive income were gains of $9,484 and $2,941 at June 30,
2008 and 2007, respectively. For subsidiaries operating in highly
inflationary economies, the U.S. dollar is the functional currency.
Remeasurement adjustments for financial statements in highly
inflationary economies and other transactional exchange gains and
losses are reflected in earnings.
Notes to Consolidated Financial Statements
Notes to Consolidated Financial Statements	 The Procter  Gamble Company	 61
Amounts in millions of dollars except per share amounts or as otherwise specified.
Cash Flow Presentation
The Statement of Cash Flows is prepared using the indirect method,
which reconciles net earnings to cash flow from operating activities.
The reconciliation adjustments include the removal of timing differences
between the occurrence of operating receipts and payments and
their recognition in net earnings. The adjustments also remove cash
flows from operating activities arising from investing and financing
activities, which are presented separately from operating activities.
Cash flows from foreign currency transactions and operations are
translated at an average exchange rate for the period. Cash flows from
hedging activities are included in the same category as the items
being hedged. Cash flows from derivative instruments designated as
net investment hedges are classified as financing activities. Cash flows
from other derivative instruments used to manage interest, commodity
or currency exposures are classified as operating activities. Cash pay-
ments related to income taxes are classified as operating activities.
Cash Equivalents
Highly liquid investments with remaining stated maturities of three
months or less when purchased are considered cash equivalents and
recorded at cost.
Investments
Investment securities consist of readily marketable debt and equity
securities. Unrealized gains or losses are charged to earnings for invest-
ments classified as trading and to shareholders’ equity for investments
classified as available-for-sale. Auction rate securities are classified as
other noncurrent assets with unrealized losses charged to shareholders’
equity unless an impairment is judged to be other than temporary, in
which case it is charged to earnings.
Investments in certain companies over which we exert significant
influence, but do not control the financial and operating decisions, are
accounted for as equity method investments. Other investments that
are not controlled, and over which we do not have the ability to
exercise significant influence, are accounted for under the cost method.
Inventory Valuation
Inventories are valued at the lower of cost or market value. Product-
related inventories are primarily maintained on the first-in, first-out
method. Minor amounts of product inventories, including certain
cosmetics and commodities, are maintained on the last-in, first-out
method. The cost of spare part inventories is maintained using the
average cost method.
Property, Plant and Equipment
Property, plant and equipment is recorded at cost reduced by accu-
mulated depreciation. Depreciation expense is recognized over the
assets’ estimated useful lives using the straight-line method. Machinery
and equipment includes office furniture and fixtures (15-year life),
computer equipment and capitalized software (3- to 5-year lives) and
manufacturing equipment (3- to 20-year lives). Buildings are depreci-
ated over an estimated useful life of 40 years. Estimated useful lives
are periodically reviewed and, when appropriate, changes are made
prospectively. When certain events or changes in operating conditions
occur, asset lives may be adjusted and an impairment assessment may
be performed on the recoverability of the carrying amounts.
Goodwill and Other Intangible Assets
We have a number of acquired brands that have been determined to
have indefinite lives due to the nature of our business. We evaluate
a number of factors to determine whether an indefinite life is appro-
priate, including the competitive environment, market share, brand
history, product life cycles, operating plans and the macroeconomic
environment of the countries in which the brands are sold. When
certain events or changes in operating conditions occur, an impairment
assessment is performed and indefinite-lived brands may be adjusted
to a determinable life.
Goodwill and indefinite-lived brands are not amortized, but are
evaluated annually for impairment or when indicators of a potential
impairment are present. Our impairment testing of goodwill is performed
separately from our impairment testing of individual indefinite-lived
intangibles. The annual evaluation for impairment of goodwill and
indefinite-lived intangibles is based on valuation models that incorporate
assumptions and internal projections of expected future cash flows
and operating plans. We believe such assumptions are also comparable
to those that would be used by other marketplace participants.
The cost of intangible assets with determinable useful lives is amortized
to reflect the pattern of economic benefits consumed, either on a
straight-line or accelerated basis over the estimated periods benefited.
Patents, technology and other intangibles with contractual terms are
generally amortized over their respective legal or contractual lives.
Customer relationships and other noncontractual intangible assets
with determinable lives are amortized over periods generally ranging
from 5 to 40 years. When certain events or changes in operating
conditions occur, an impairment assessment is performed and lives of
intangible assets with determinable lives may be adjusted.
Fair Values of Financial Instruments
Certain financial instruments are required to be recorded at fair value.
The estimated fair values of such financial instruments (including certain
debt instruments, investment securities and derivatives) have been
determined using market information and valuation methodologies,
primarily discounted cash flow analysis. Changes in assumptions or
estimation methods could affect the fair value estimates. However, we
do not believe any such changes would have a material impact on our
financial condition, results of operations or cash flows. Other financial
instruments, including cash equivalents, other investments and short-
term debt, are recorded at cost, which approximates fair value. The
fair values of long-term debt and derivative instruments are disclosed
in Note 5 and Note 6, respectively.
Amounts in millions of dollars except per share amounts or as otherwise specified.
62	 The Procter  Gamble Company	 Notes to Consolidated Financial Statements
New Accounting Pronouncements and Policies
Other than as described below, no new accounting pronouncement
issued or effective during the fiscal year has had or is expected to
have a material impact on the consolidated financial statements.
ADOPTION OF FIN 48, “ACCOUNTING FOR UNCERTAINTY IN INCOME
TAXES — an interpretation of fasb statement no. 109”
On July 1, 2007, we adopted FASB Interpretation No. 48, “Accounting
for Uncertainty in Income Taxes — an interpretation of FASB statement
No. 109” (FIN 48). FIN 48 addresses the accounting and disclosure of
uncertain tax positions. FIN 48 prescribes a recognition threshold and
measurement attribute for the financial statement recognition and
measurement of a tax position taken or expected to be taken in a
tax return. The difference between the tax benefit recognized in the
financial statements for a position in accordance with FIN 48 and
the tax benefit claimed in the tax return is referred to as an unrecognized
tax benefit.
The adoption of FIN 48 resulted in a decrease to retained earnings as
of July 1, 2007, of $232, which was reflected as a cumulative effect
of a change in accounting principle, with a corresponding increase to
the net liability for unrecognized tax benefits. The impact primarily
reflects the accrual of additional statutory interest and penalties as
required by FIN 48, partially offset by adjustments to existing unrecog-
nized tax benefits to comply with FIN 48 measurement principles.
The implementation of FIN 48 also resulted in a reduction in our net
tax liabilities for uncertain tax positions related to prior acquisitions
accounted for under purchase accounting, resulting in an $80 decrease
to goodwill. Additionally, the Company historically classified unrecog-
nized tax benefits in current taxes payable. As a result of the adoption
of FIN 48, unrecognized tax benefits not expected to be paid in the
next 12 months were reclassified to other noncurrent liabilities on a
prospective basis.
The total amount of unrecognized tax benefits as of the adoption of
FIN 48 at July 1, 2007, was $2,971, excluding any related accruals
for interest and penalties. Included in this total was $1,893 that, if
recognized, would impact the effective tax rate in future periods. We
recognize accrued interest and penalties related to unrecognized tax
benefits in income tax expense. Accrued interest and penalties as of
July 1, 2007, were $589 and $128, respectively, on an after-tax basis.
Refer to Note 10 for additional information regarding uncertain tax
positions and related activity in the current year.
ADOPTION OF FASB Standard 158, “EMPLOYERS’ ACCOUNTING
FOR DEFINED BENEFIT PENSION AND OTHER POSTRETIREMENT
PLANS — an amendment of FASB Statements No. 87, 88, 106,
and 132(R)”
In September 2006, the FASB issued Statement of Financial Accounting
Standards (SFAS) No. 158, “Employers’ Accounting for Defined Benefit
Pension and Other Postretirement Plans — an amendment of FASB
Statements No. 87, 88, 106, and 132(R)” (SFAS 158). SFAS 158
requires companies to recognize the over-funded and under-funded
status of defined benefit pension and other postretirement plans as
assets or liabilities on their balance sheets. In addition, changes in the
funded status must be recognized through other comprehensive
income in shareholders’ equity in the year in which the changes occur.
We adopted SFAS 158 on June 30, 2007. In accordance with the
transition rules in SFAS 158, this standard was adopted on a prospec-
tive basis. The adoption of SFAS 158 resulted in an adjustment to our
balance sheet, but had no impact on our net earnings or cash flow,
nor did it impact any debt covenants. SFAS 158 had no impact on our
measurement date, which continues to be as of our fiscal year-end.
Refer to Note 9 for additional information regarding our pension and
postretirement plans.
The following table reflects the effect of the adoption of SFAS 158 on
our Consolidated Balance Sheets:
	 	 	 Before	 	 After	
	 	 	 Application	 SFAS 158	 Application	
As of June 30, 2007	 	 of SFAS 158	 Adjustments	 of SFAS 158
Other noncurrent assets		 $   4,432	 $(167)	 $   4,265
Total assets		 138,181	 (167)	 138,014
Deferred income taxes		 12,214	 (199)	 12,015
Other noncurrent liabilities		 4,782	 365	 5,147
Total liabilities		 71,088	 166	 71,254
Accumulated other
comprehensive income		 950	 (333)	 617
Total shareholders’ equity		 67,093	 (333)	 66,760
Total liabilities and
shareholders’ equity		 138,181	 (167)	 138,014
FASB STANDARDS 141(R), “BUSINESS COMBINATIONS,” AND 160,
“NONCONTROLLING INTERESTS IN CONSOLIDATED FINANCIAL
STATEMENTS — AN AMENDMENT OF ARB NO. 51”
In December 2007, the FASB issued SFAS No. 141 (Revised), “Business
Combinations,” (SFAS 141(R)) and SFAS No. 160, “Noncontrolling
Interests in Consolidated Financial Statements — an amendment of
ARB No. 51” (SFAS 160). SFAS 141(R) and SFAS 160 revise the method
of accounting for a number of aspects of business combinations and
noncontrolling interests, including acquisition costs, contingencies
(including contingent assets, contingent liabilities and contingent
purchase price), the impacts of partial and step-acquisitions (including
the valuation of net assets attributable to non-acquired minority
interests) and post acquisition exit activities of acquired businesses.
SFAS 141(R) and SFAS 160 will be effective for the Company during our
fiscal year beginning July 1, 2009. The Company believes that the
adoption of SFAS 141(R) and SFAS 160 will not have a material effect
on its financial position, results of operations or cash flows.
FASB STANDARD 157, “FAIR VALUE MEASUREMENTS”
In September 2006, the FASB issued SFAS No. 157, “Fair Value
Measurements” (SFAS 157). This standard defines fair value, establishes
a framework for measuring fair value in generally accepted accounting
principles, and expands disclosures about fair value measurements.
SFAS 157, as amended, is effective for the Company beginning July 1,
2008, for certain financial assets and liabilities and beginning July 1,
2009, for non-financial assets and liabilities recognized or disclosed
at fair value on a non-recurring basis. The Company believes that the
adoption of SFAS 157 will not have a material effect on its financial
position, results of operations or cash flows.
Notes to Consolidated Financial Statements	 The Procter  Gamble Company	 63
Amounts in millions of dollars except per share amounts or as otherwise specified.
FASB STANDARD 161, “DISCLOSURES ABOUT DERIVATIVE
INSTRUMENTS AND HEDGING ACTIVITIES — AN AMENDMENT OF
FASB statement no. 133”
In March 2008, the FASB issued SFAS No. 161, “Disclosures about
Derivative Instruments and Hedging Activities — An Amendment of
FASB Statement No. 133” (SFAS 161). SFAS 161 impacts disclosures
only and will provide additional qualitative and quantitative information
on the use of derivatives and their impact on an entity’s financial
position, results of operations and cash flows. SFAS 161 will be effective
for the Company beginning January 1, 2009.
NOTE 2
ACQUISITIONS
Gillette Acquisition
On October 1, 2005, we completed our acquisition of The Gillette
Company. Pursuant to the acquisition agreement, which provided for
the exchange of 0.975 shares of The Procter  Gamble Company
common stock, on a tax-free basis, for each share of The Gillette
Company, we issued 962 million shares of The Procter  Gamble
Company common stock. The value of these shares was determined
using the average Company stock prices beginning two days before
and ending two days after January 28, 2005, the date the acquisition
was announced. We also issued 79 million stock options in exchange
for Gillette’s outstanding stock options. Under the purchase method
of accounting, the total consideration was approximately $53.4 billion
including common stock, the fair value of vested stock options and
acquisition costs. This acquisition ultimately resulted in a new Grooming
reportable segment. The Gillette oral care, batteries and personal care
businesses were subsumed within the Health Care, Fabric Care and
Home Care, and Beauty reportable segments, respectively. The operating
results of the Gillette businesses are reported in our financial statements
beginning October 1, 2005.
The Gillette Company was a market leader in several global product
categories including blades and razors, oral care and batteries. Total
sales for Gillette during its most recent pre-acquisition year ended
December 31, 2004, were $10.5 billion.
In order to obtain regulatory approval of the transaction, we were
required to divest certain overlapping businesses. We completed the
divestiture of the Spinbrush toothbrush business, Rembrandt (a Gillette
oral care product line), Right Guard and other Gillette deodorant brands
during the fiscal year ended June 30, 2006.
In connection with this acquisition, we also announced a share
buyback plan, which we completed in July 2006, under which we
acquired $20.1 billion of Company common shares either through
the open market or from private transactions.
In conjunction with the acquisition of The Gillette Company, we
recognized an assumed liability for Gillette exit costs of $1.2 billion,
including $854 in separation costs related to approximately 5,500
people, $55 in employee relocation costs and $320 in other exit
costs. These costs are primarily related to the elimination of selling,
general and administrative overlap between the two companies in
areas like Global Business Services, corporate staff and go-to-market
support, as well as redundant manufacturing capacity. These activities
are substantially complete as of June 30, 2008. Total integration plan
charges against the assumed liability were $286, $438 and $204 for
the years ended June 2008, 2007 and 2006, respectively. A total of
$121 of the liability was reversed, which resulted in a reduction to
goodwill during the year ended June 30, 2008, related to underspend-
ing on a number of projects that were concluded during the period.
Other minor business purchases and intangible asset acquisitions
totaled $418, $540 and $395 in 2008, 2007 and 2006, respectively.
Amounts in millions of dollars except per share amounts or as otherwise specified.
64	 The Procter  Gamble Company	 Notes to Consolidated Financial Statements
NOTE 3
GOODWILL AND INTANGIBLE ASSETS
The change in the net carrying amount of goodwill by Global
Business Unit (GBU) was as follows:
	 	 	 	 2008	 2007
BEAUTY GBU
Beauty, beginning of year			 $15,359	 $14,968
Acquisitions and divestitures			 187	 (18)
Translation and other			 1,357	 409
Goodwill, June 30, 2008			 16,903	 15,359
Grooming, beginning of year			 24,211	 23,586
Acquisitions and divestitures			 (269)	 289
Translation and other			 1,370	 336
Goodwill, June 30, 2008			 25,312	 24,211
HEALTH  WELL-BEING GBU
Health Care, beginning of year			 8,482	 8,387
Acquisitions and divestitures			 (59)	 5
Translation and other			 327	 90
Goodwill, June 30, 2008			 8,750	 8,482
Snacks, Coffee and Pet Care, beginning of year	 	 2,407	 2,396
Acquisitions and divestitures			 (5)	 5
Translation and other			 32	 6
Goodwill, June 30, 2008			 2,434	 2,407
HOUSEHOLD CARE GBU
Fabric Care and Home Care, beginning of year		 4,470	 4,406
Acquisitions and divestitures			 (43)	 (8)
Translation and other			 228	 72
Goodwill, June 30, 2008			 4,655	 4,470
Baby Care and Family Care, beginning of year		 1,623	 1,563
Acquisitions and divestitures			 (34)	 9
Translation and other			 124	 51
Goodwill, June 30, 2008			 1,713	 1,623
GOODWILL, NET, beginning of year			 56,552	 55,306
Acquisitions and divestitures			 (223)	 282
Translation and other			 3,438	 964
Goodwill, June 30, 2008			 59,767	 56,552
The increase in goodwill from June 30, 2007, is primarily due to
currency translation.
Identifiable intangible assets were comprised of:
	 2008	 	 2007
	 	 Gross	 	 Gross	
	 	 Carrying	 Accumulated	 Carrying	 Accumulated	
June 30	 Amount	 Amortization	 Amount	 Amortization
INTANGIBLE ASSETS
WITH DETERMINABLE
LIVES
Brands	 $  3,564	 $1,032	 $  3,317	 $  710
Patents and technology	 3,188	 1,077	 3,135	 776
Customer relationships	 1,947	 353	 1,738	 237
Other	 333	 209	 377	 188
Total	 9,032	 2,671	 8,567	 1,911
BRANDS WITH
INDEFINITE LIVES	 27,872	 —	 26,970	 —
TOTAL	 36,904	 2,671	 35,537	 1,911
The amortization of intangible assets for the years ended June 30,
2008, 2007 and 2006 was $649, $640 and $587, respectively.
Estimated amortization expense over the next five years is as follows:
2009 – $626; 2010 – $599; 2011 – $549; 2012 – $512; and 2013 – $489.
Such estimates do not reflect the impact of future foreign exchange
rate changes.
NOTE 4
SUPPLEMENTAL FINANCIAL INFORMATION
Selected components of current and noncurrent liabilities were as
follows:
June 30	 	 	 2008	 2007
ACCRUED AND OTHER LIABILITIES — current
Marketing and promotion			 $  2,760	 $2,538
Compensation expenses			 1,527	 1,390
Accrued Gillette exit costs			 257	 608
Other			 5,610	 5,050
TOTAL			 10,154	 9,586
OTHER NONCURRENT LIABILITIES
Pension benefits			 $  3,146	 $2,898
Other postretirement benefits			 512	 503
Noncurrent FIN 48 liability			 3,075	 —
Other			 1,421	 1,746
TOTAL			 8,154	 5,147
Notes to Consolidated Financial Statements	 The Procter  Gamble Company	 65
Amounts in millions of dollars except per share amounts or as otherwise specified.
NOTE 5
SHORT-TERM AND LONG-TERM DEBT
June 30	 	 	 2008	 2007
SHORT-TERM DEBT
Current portion of long-term debt		 $  1,746	 $  2,544
Commercial paper			 9,748	 9,410
Floating rate note due February 2009		 1,500	 —
Other			 90	 85
TOTAL			 13,084	 12,039
The weighted average short-term interest rates were 2.7% and 5.0%
as of June 30, 2008 and 2007, respectively, including the effects of
interest rate swaps discussed in Note 6.
June 30	 	 	 2008	 2007
LONG-TERM DEBT
4.30% USD note due August 2008		 $   500	 $   500
3.50% USD note due December 2008		 650	 650
Floating rate note due July 2009		 1,750	 —
Floating rate note due August 2009		 1,500	 —
6.88% USD note due September 2009		 1,000	 1,000
4.88% EUR note due October 2011		 1,573	 —
3.38% EUR note due December 2012		 2,203	 1,882
4.50% EUR note due May 2014		 	 2,360	 2,016
4.95% USD note due August 2014		 900	 900
4.85% USD note due December 2015		 700	 700
5.13% EUR note due October 2017		 1,731	 —
4.13% EUR note due December 2020		 944	 806
9.36% ESOP debentures due 2008 – 2021 (1)		 934	 968
4.88% EUR note due May 2027			 1,573	 1,344
6.25% GBP note due January 2030		 993	 1,001
5.50% USD note due February 2034		 500	 500
5.80% USD note due August 2034		 600	 600
5.55% USD note due March 2037		 1,400	 1,400
Capital lease obligations			 407	 628
All other long-term debt			 3,109	 11,024
Current portion of long-term debt		 (1,746)	 (2,544)
TOTAL			 23,581	 23,375
(1) Debt issued by the ESOP is guaranteed by the Company and must be recorded as debt of the
Company as discussed in Note 9.
Long-term weighted average interest rates were 4.5% and 3.3% as
of June 30, 2008 and 2007, respectively, including the effects of
interest rate swaps and net investment hedges discussed in Note 6.
The fair value of the long-term debt was $23,276 and $23,122 at
June 30, 2008 and 2007, respectively. Long-term debt maturities
during the next five years are as follows: 2009 – $1,746; 2010 – $5,508;
2011 – $43; 2012 – $1,643; and 2013 – $2,240.
NOTE 6
RISK MANAGEMENT ACTIVITIES
As a multinational company with diverse product offerings, we are
exposed to market risks, such as changes in interest rates, currency
exchange rates and commodity prices. To manage the volatility
related to these exposures, we evaluate exposures on a consolidated
basis to take advantage of logical exposure netting and correlation.
For the remaining exposures, we enter into various financial transactions,
which we account for under SFAS 133, “Accounting for Derivative
Instruments and Hedging Activities,” as amended and interpreted.
The utilization of these financial transactions is governed by our
policies covering acceptable counterparty exposure, instrument types
and other hedging practices. We do not hold or issue derivative
financial instruments for speculative trading purposes.
At inception, we formally designate and document qualifying instru-
ments as hedges of underlying exposures. We formally assess, both
at inception and at least quarterly on an ongoing basis, whether the
financial instruments used in hedging transactions are effective at
offsetting changes in either the fair value or cash flows of the related
underlying exposure. Fluctuations in the value of these instruments
generally are offset by changes in the fair value or cash flows of the
underlying exposures being hedged. This offset is driven by the high
degree of effectiveness between the exposure being hedged and the
hedging instrument. Any ineffective portion of a change in the fair
value of a qualifying instrument is immediately recognized in earnings.
Credit Risk
We have counterparty credit guidelines and normally enter into
transactions with investment grade financial institutions. Counterparty
exposures are monitored daily and downgrades in credit rating are
reviewed on a timely basis. Credit risk arising from the inability of a
counterparty to meet the terms of our financial instrument contracts
generally is limited to the amounts, if any, by which the counterparty’s
obligations exceed our obligations to the counterparty. We have not
incurred and do not expect to incur material credit losses on our risk
management or other financial instruments.
Interest Rate Management
Our policy is to manage interest cost using a mixture of fixed-rate and
variable-rate debt. To manage this risk in a cost-efficient manner, we
enter into interest rate swaps in which we agree to exchange with
the counterparty, at specified intervals, the difference between fixed
and variable interest amounts calculated by reference to an agreed-
upon notional principal amount.
Interest rate swaps that meet specific criteria under SFAS 133 are
accounted for as fair value and cash flow hedges. There were no fair
value hedging instruments at June 30, 2008, or June 30, 2007. For
cash flow hedges, the effective portion of the changes in fair value of
the hedging instrument is reported in other comprehensive income
(OCI) and reclassified into interest expense over the life of the under-
lying debt. The ineffective portion, which is not material for any year
Amounts in millions of dollars except per share amounts or as otherwise specified.
66	 The Procter  Gamble Company	 Notes to Consolidated Financial Statements
presented, is immediately recognized in earnings. The fair value of
these cash flow hedging instruments was a liability of $17 and an
asset of $53 at June 30, 2008 and 2007, respectively. During the next
12 months, $4 of the June 30, 2008 OCI balance will be reclassified
to earnings consistent with the timing of the underlying hedged
transactions.
Foreign Currency Management
We manufacture and sell our products in a number of countries
throughout the world and, as a result, are exposed to movements in
foreign currency exchange rates. The purpose of our foreign currency
hedging program is to reduce the risk caused by short-term changes
in exchange rates.
To manage this exchange rate risk, we primarily utilize forward contracts
and options with maturities of less than 18 months and currency swaps
with maturities up to five years. These instruments are intended to
offset the effect of exchange rate fluctuations on forecasted sales,
inventory purchases, intercompany royalties and intercompany loans
denominated in foreign currencies and are therefore accounted for as
cash flow hedges. The fair value of these instruments at June 30, 2008
and 2007, was $4 and $34 in assets and $37 and $2 in liabilities,
respectively. The effective portion of the changes in fair value of these
instruments is reported in OCI and reclassified into earnings in the
same financial statement line item and in the same period or periods
during which the related hedged transactions affect earnings.
The ineffective portion, which is not material for any year presented,
is immediately recognized in earnings.
Certain instruments used to manage foreign exchange exposure of
intercompany financing transactions, income from international
operations and other balance sheet items subject to revaluation do
not meet the requirements for hedge accounting treatment. In these
cases, the change in value of the instruments is designed to offset the
foreign currency impact of the related exposure. The fair value of
these instruments at June 30, 2008 and 2007, was $190 and $110 in
assets and $33 and $78 in liabilities, respectively. The change in value
of these instruments is immediately recognized in earnings. The net
impact of such instruments, included in selling, general and adminis-
trative expense, was $1,397, $56 and $87 of gains in 2008, 2007
and 2006, respectively, which substantially offset foreign currency
transaction and translation losses of the exposures being hedged.
Net Investment Hedging
We hedge certain net investment positions in major foreign subsidiaries.
To accomplish this, we either borrow directly in foreign currency and
designate all or a portion of foreign currency debt as a hedge of the
applicable net investment position or enter into foreign currency swaps
that are designated as hedges of our related foreign net investments.
Under SFAS 133, changes in the fair value of these instruments are
immediately recognized in OCI to offset the change in the value of
the net investment being hedged. Currency effects of these hedges
reflected in OCI were after-tax losses of $2,951 and $835 in 2008
and 2007, respectively. Accumulated net balances were $5,023 and
$2,072 after-tax losses as of June 30, 2008 and 2007, respectively.
Commodity Price Management
Certain raw materials utilized in our products or production processes
are subject to price volatility caused by weather, supply conditions,
political and economic variables and other unpredictable factors.
To manage the volatility related to anticipated purchases of certain of
these materials, we use futures and options with maturities generally
less than one year and swap contracts with maturities up to five years.
These market instruments generally are designated as cash flow hedges
under SFAS 133. The effective portion of the changes in fair value
for these instruments is reported in OCI and reclassified into earnings
in the same financial statement line item and in the same period or
periods during which the hedged transactions affect earnings. The
ineffective and non-qualifying portions, which are not material for
any year presented, are immediately recognized in earnings. The fair
value of these cash flow hedging instruments was an asset of $229
and $70 at June 30, 2008 and 2007, respectively. During the next
12 months, $126 of the June 30, 2008 OCI balance will be reclassified
to earnings consistent with the timing of the underlying hedged
transactions.
Insurance
The Company purchases limited discretionary insurance to cover
catastrophic property damage, business interruption and liability risk
of loss exposures. Deductibles and loss sharing will likely increase over
time, recognizing the Company’s ability to cost-effectively fund losses
from internal cash flow generation and access to capital markets.
NOTE 7
EARNINGS PER SHARE
Net earnings less preferred dividends (net of related tax benefits) are
divided by the weighted average number of common shares outstand-
ing during the year to calculate basic net earnings per common share.
Diluted net earnings per common share are calculated to give effect
to stock options and other stock-based awards (see Note 8) and
assume conversion of preferred stock (see Note 9).
Net earnings and common shares used to calculate basic and diluted
net earnings per share were as follows:
Years ended June 30	 	 2008	 2007	 2006
NET EARNINGS		 $12,075	 $10,340	 $8,684
Preferred dividends,
net of tax benefit		 (176)	 (161)	 (148)
NET EARNINGS AVAILABLE TO
COMMON SHAREHOLDERS		 11,899	 10,179	 8,536
Preferred dividends,
net of tax benefit		 176	 161	 148
DILUTED NET EARNINGS		 12,075	 10,340	 8,684
Notes to Consolidated Financial Statements	 The Procter  Gamble Company	 67
Amounts in millions of dollars except per share amounts or as otherwise specified.
Shares in millions; Years ended June 30	 	 2008	 2007	 2006
Basic weighted average common
shares outstanding		 3,080.8	 3,159.0	 3,054.9
Effect of dilutive securities
	 Conversion of preferred shares (1)	 144.2	 149.6	 154.1
	 Exercise of stock options and
		other unvested equity awards (2)	 91.8	 90.0	 76.9
DILUTED WEIGHTED AVERAGE
COMMON SHARES OUTSTANDING	3,316.8	 3,398.6	 3,285.9
(1) Despite being included currently in diluted net earnings per common share, the actual
conversion to common stock occurs pursuant to the repayment of the ESOPs’ obligations
through 2035.
(2) Approximately 40 million in 2008, 41 million in 2007 and 44 million in 2006 of the Company’s
outstanding stock options were not included in the diluted net earnings per share calculation
because to do so would have been antidilutive (i.e., the total proceeds upon exercise would
have exceeded the market value of the underlying common shares).
NOTE 8
STOCK-BASED COMPENSATION
We have stock-based compensation plans under which we annually
grant stock option and restricted stock awards to key managers and
directors. Exercise prices on options granted have been and continue
to be set equal to the market price of the underlying shares on the
date of the grant. The key manager stock option awards granted since
September 2002 are vested after three years and have a 10-year life.
The key manager stock option awards granted from July 1998
through August 2002 vested after three years and have a 15-year life.
Beginning in 2008, key managers were given the alternative to elect
up to 50% of the value of their option award in restricted stock units
(RSUs). Key manager RSUs are vested and settled in shares of common
stock five years from the grant date. The awards provided to the
Company’s directors are in the form of restricted stock and RSUs. In
addition to our key manager and director grants, we make other minor
stock options and RSU grants to employees for which the terms are
not substantially different.
A total of 229 million shares of common stock were authorized for
issuance under stock-based compensation plans approved by share-
holders in 2001 and 2003, of which 50 million remain available for
grant. An additional 20 million shares of common stock available for
issuance under a plan approved by Gillette shareholders in 2004 were
assumed by the Company in conjunction with the acquisition of The
Gillette Company in October 2005. A total of 12 million of these shares
remain available for grant under this plan. There were also 5 million
shares available for grant under the Future Shares Plan approved by the
Board of Directors in 1997. This plan was terminated in October 2007.
Total stock-based compensation expense for stock option grants was
$522, $612 and $526 for 2008, 2007 and 2006, respectively. The total
income tax benefit recognized in the income statement for these
stock-based compensation arrangements was $141, $163 and $140
for 2008, 2007 and 2006, respectively. Total compensation cost for
restricted stock, restricted stock units and other stock-based grants,
was $33, $56 and $59 in 2008, 2007 and 2006, respectively.
In calculating the compensation expense for options granted, we
utilize a binomial lattice-based model for the valuation of stock option
grants. Assumptions utilized in the model, which are evaluated and
revised, as necessary, to reflect market conditions and experience,
were as follows:
Years ended June 30	 	 2008	 2007	 2006
Interest rate		 1.3 – 3.8%	 4.3 – 4.8%	 4.5 – 4.7%
Weighted average interest rate		 3.4%	 4.5%	 4.6%
Dividend yield		 1.9%	 1.9%	 1.9%
Expected volatility		 19 – 25%	 16 – 20%	 15 – 20%
Weighted average volatility		 20%	 19%	 19%
Expected life in years		 8.3	 8.7	 8.7
Because lattice-based option valuation models incorporate ranges of
assumptions for inputs, those ranges are disclosed in the preceding
table. Expected volatilities are based on a combination of historical
volatility of our stock and implied volatilities of call options on our stock.
We use historical data to estimate option exercise and employee
termination patterns within the valuation model. The expected term
of options granted is derived from the output of the option valuation
model and represents the average period of time that options
granted are expected to be outstanding. The interest rate for periods
within the contractual life of the options is based on the U.S. Treasury
yield curve in effect at the time of grant.
A summary of options outstanding under the plans as of June 30, 2008,
and activity during the year then ended is presented below:
	 	 	 	 Weighted Avg.	
	 	 	 	 Remaining	 Aggregate	
	 	 	 Weighted Avg.	 Contractual	 Intrinsic Value	
Options in thousands	 Options	 Exercise Price	 Life in Years	 (in millions)
Outstanding,
beginning of year	 355,006	 $46.10
Granted	 28,345	 66.33
Exercised	 (43,413)	 42.32
Canceled	 (2,761)	 51.29
OUTSTANDING,
END OF YEAR	 337,177	 48.25	 6.8	 $4,474
EXERCISABLE	 244,533	 42.63	 6.1	 4,447
The weighted average grant-date fair value of options granted was
$15.91, $17.29 and $16.30 per share in 2008, 2007 and 2006,
respectively. The total intrinsic value of options exercised was $1,129,
$894 and $815 in 2008, 2007 and 2006, respectively. The total
grant-date fair value of options that vested during 2008, 2007 and
2006 was $532, $552 and $388, respectively. We have no specific
policy to repurchase common shares to mitigate the dilutive impact
of options; however, we have historically made adequate discretionary
purchases, based on cash availability, market trends and other factors,
to satisfy stock option exercise activity.
Amounts in millions of dollars except per share amounts or as otherwise specified.
68	 The Procter  Gamble Company	 Notes to Consolidated Financial Statements
At June 30, 2008, there was $565 of compensation cost that has not
yet been recognized related to stock awards. That cost is expected to
be recognized over a remaining weighted average period of 1.9 years.
Cash received from options exercised was $1,837, $1,422 and $1,229
in 2008, 2007 and 2006, respectively. The actual tax benefit realized
for the tax deductions from option exercises totaled $318, $265 and
$242 in 2008, 2007 and 2006, respectively.
NOTE 9
POSTRETIREMENT BENEFITS AND EMPLOYEE STOCK
OWNERSHIP PLAN
We offer various postretirement benefits to our employees.
Defined Contribution Retirement Plans
We have defined contribution plans which cover the majority of our
U.S. employees, as well as employees in certain other countries. These
plans are fully funded. We generally make contributions to participants’
accounts based on individual base salaries and years of service. The
primary U.S. defined contribution plan (the U.S. DC plan) comprises
the majority of the balances and expense for the Company’s defined
contribution plans. For the U.S. DC plan, the contribution rate is set
annually. Total contributions for this plan approximated 15% of total
participants’ annual wages and salaries in 2008, 2007 and 2006.
We maintain The Procter  Gamble Profit Sharing Trust (Trust) and
Employee Stock Ownership Plan (ESOP) to provide a portion of the
funding for the U.S. DC plan, as well as other retiree benefits.
Operating details of the ESOP are provided at the end of this Note.
The fair value of the ESOP Series A shares allocated to participants
reduces our cash contribution required to fund the U.S. DC plan.
Total defined contribution expense was $290, $273, and $249 in
2008, 2007 and 2006, respectively.
Defined Benefit Retirement Plans and Other Retiree Benefits
We offer defined benefit retirement pension plans to certain employees.
These benefits relate primarily to local plans outside the U.S., and to
a lesser extent, plans assumed in the Gillette acquisition covering U.S.
employees. These acquired Gillette plans were frozen effective
January 1, 2008.
We also provide certain other retiree benefits, primarily health care and
life insurance, for the majority of our U.S. employees who become
eligible for these benefits when they meet minimum age and service
requirements. Generally, the health care plans require cost sharing
with retirees and pay a stated percentage of expenses, reduced by
deductibles and other coverages. These benefits are primarily funded
by ESOP Series B shares, as well as certain other assets contributed by
the Company.
Obligation and Funded Status. We use a June 30 measurement date
for our defined benefit retirement plans and other retiree benefit
plans. The following provides a reconciliation of benefit obligations,
plan assets and funded status of these plans:
	 	 	 Other	
	 Pension Benefits (1)	 	 Retiree Benefits (2)
Years ended June 30	 	 2008	 2007	 2008	 2007
CHANGE IN BENEFIT
OBLIGATION
Benefit obligation at
beginning of year (3)		 $  9,819	 $ 9,244	 $3,558	 $3,286
Service cost		 263	 279	 95	 85
Interest cost		 539	 476	 226	 206
Participants’ contributions		 14	 19	 58	 55
Amendments		 52	 24	 (11)	 12
Actuarial (gain) loss		 (655)	 1	 (232)	 80
Acquisitions (divestitures)		 (7)	 (8)	 2	 —
Curtailments and
settlements		 (68)	 (163)	 (3)	 (1)
Special termination benefits	 1	 1	 2	 2
Currency translation
and other		 642	 431	 67	 35
Benefit payments		 (505)	 (485)	 (209)	 (202)
BENEFIT OBLIGATION
AT END OF YEAR (3)		 10,095	 9,819	 3,553	 3,558
CHANGE IN PLAN ASSETS
Fair value of plan assets
at beginning of year		 7,350	 6,203	 3,390	 3,091
Actual return on plan assets	 (459)	 736	 (29)	 429
Acquisitions (divestitures)		 —	 (2)	 —	 —
Employer contributions		 507	 565	 21	 30
Participants’ contributions		 14	 19	 58	 55
Currency translation
and other		 318	 314	 1	 1
ESOP debt impacts (4)		 —	 —	 (7)	 (14)
Benefit payments		 (505)	 (485)	 (209)	 (202)
FAIR VALUE OF PLAN
ASSETS AT END OF YEAR	 7,225	 7,350	 3,225	 3,390
FUNDED STATUS		 (2,870)	 (2,469)	 (328)	 (168)
(1) Primarily non-U.S.-based defined benefit retirement plans.
(2) Primarily U.S.-based other postretirement benefit plans.
(3) For the pension benefit plans, the benefit obligation is the projected benefit obligation.
For other retiree benefit plans, the benefit obligation is the accumulated postretirement
benefit obligation.
(4) Represents increases in the ESOP’s debt, which is netted against plan assets for Other
Retiree Benefits.
Notes to Consolidated Financial Statements	 The Procter  Gamble Company	 69
Amounts in millions of dollars except per share amounts or as otherwise specified.
	 	 	 Other	
	 Pension Benefits	 	 Retiree Benefits
Years ended June 30	 	 2008	 2007	 2008	 2007
CLASSIFICATION OF NET
AMOUNT RECOGNIZED
Noncurrent assets		 $   321	 $   469	 $ 200	 $ 347
Current liability		 (45)	 (40)	 (16)	 (12)
Noncurrent liability		 (3,146)	 (2,898)	 (512)	 (503)
NET AMOUNT RECOGNIZED	 (2,870)	 (2,469)	 (328)	 (168)
AMOUNTS RECOGNIZED IN
ACCUMULATED OTHER
COMPREHENSIVE INCOME
(AOCI)
Net actuarial loss		 715	 379	 578	 337
Prior service cost (credit)		 213	 172	 (175)	 (185)
NET AMOUNTS RECOGNIZED
IN AOCI		 928	 551	 403	 152
CHANGE IN PLAN ASSETS AND
BENEFIT OBLIGATIONS
RECOGNIZED IN
ACCUMULATED OTHER
COMPREHENSIVE INCOME
(AOCI)
Net actuarial loss — 
	 current year		 361	 n/a	 226	 n/a
Prior service cost (credit) — 
	 current year		 52	 n/a	 (11)	 n/a
Amortization of net
actuarial loss		 (9)	 n/a	 (7)	 n/a
Amortization of prior
service (cost) / credit		 (14)	 n/a	 21	 n/a
Settlement / Curtailment cost	 (32)	 n/a	 (2)	 n/a
Currency translation
and other		 19	 n/a	 24	 n/a
TOTAL CHANGE IN AOCI		 377		 251
NET AMOUNTS RECOGNIZED
IN PERIODIC BENEFIT
COST AND AOCI		 609		 33
The underfunding of pension benefits is primarily a function of the
different funding incentives that exist outside of the U.S. In certain
countries, there are no legal requirements or financial incentives
provided to companies to pre-fund pension obligations. In these
instances, benefit payments are typically paid directly from the
Company’s cash as they become due.
The accumulated benefit obligation for all defined benefit retirement
pension plans was $8,750 and $8,611 at June 30, 2008 and June 30,
2007, respectively. Pension plans with accumulated benefit obligations
in excess of plan assets and plans with projected benefit obligations in
excess of plan assets consist of the following:
	 Accumulated Benefit 	 	 Projected Benefit	
	 Obligation Exceeds the	 	 Obligation Exceeds the	
	 Fair Value of Plan Assets	
	
Fair Value of Plan Assets
Years ended June 30	 	 2008	 2007	 2008	 2007
Projected benefit obligation	 $5,277	 $4,813	 $7,987	 $6,763
Accumulated benefit
obligation		 4,658	 4,294	 6,737	 5,792
Fair value of plan assets		 2,153	 1,973	 4,792	 3,825
Net Periodic Benefit Cost. Components of the net periodic benefit
cost were as follows:
	 Pension Benefits	 	 Other Retiree Benefits
Years ended June 30	 2008	 2007	 2006	 2008	 2007	 2006
Service cost	 $ 263	 $ 279	 $ 265	 $   95	 $   85	 $   97
Interest cost	 539	 476	 383	 226	 206	 179
Expected return
on plan assets	 (557)	 (454)	 (353)	 (429)	 (407)	 (372)
Prior service
cost (credit)
amortization	 14	 13	 7	 (21)	 (22)	 (22)
Net actuarial loss
amortization	 9	 45	 76	 7	 2	 6
Curtailment and
settlement gain	 (36)	 (176)	 (4)	 (1)	 (1)	 —
GROSS BENEFIT
COST (CREDIT)	 232	 183	 374	 (123)	 (137)	 (112)
Dividends on ESOP
preferred stock	 —	 —	 —	 (95)	 (85)	 (78)
NET PERIODIC
BENEFIT COST
(CREDIT)	 232	 183	 374	 (218)	 (222)	 (190)
Pursuant to plan revisions adopted during 2007, Gillette’s U.S. defined
benefit retirement pension plans were frozen effective January 1, 2008,
at which time Gillette employees in the U.S. moved into the PG
defined contribution Profit Sharing Trust and Employee Stock Ownership
Plan. This revision resulted in a $154 curtailment gain for the year
ended June 30, 2007.
Amounts expected to be amortized from accumulated other compre-
hensive income into net period benefit cost during the year ending
June 30, 2009, are as follows:
	 	 	 	 	 	 Other	
	 	 	 	 	 Pension	 Retiree	
	 	 	 	 	 Benefits	 Benefits
Net actuarial loss				 $31	 $  4
Prior service cost (credit)				 17	 (23)
Amounts in millions of dollars except per share amounts or as otherwise specified.
70	 The Procter  Gamble Company	 Notes to Consolidated Financial Statements
Assumptions. We determine our actuarial assumptions on an annual
basis. These assumptions are weighted to reflect each country that
may have an impact on the cost of providing retirement benefits.
The weighted average assumptions for the defined benefit and other
retiree benefit calculations, as well as assumed health care trend
rates, were as follows:
	 Pension Benefits	 	 Other Retiree Benefits
Years ended June 30	 	 2008	 2007	 2008	 2007
ASSUMPTIONS USED TO
DETERMINE BENEFIT
OBLIGATIONS (1)
Discount rate		 6.3%	 5.5%	 6.9%	 6.3%
Rate of compensation
increase		 3.7%	 3.1%	 —	 —
ASSUMPTIONS USED TO
DETERMINE NET PERIODIC
BENEFIT COST (2)
Discount rate		 5.5%	 5.2%	 6.3%	 6.3%
Expected return on
plan assets		 7.4%	 7.2%	 9.3%	 9.3%
Rate of compensation
increase		 3.1%	 3.0%	 —	 —
ASSUMED HEALTH CARE
COST TREND RATES
Health care cost trend rates
assumed for next year		 —	 —	 8.6%	 9.0%
Rate to which the health care
cost trend rate is assumed to
decline (ultimate trend rate)	 —	 —	 5.1%	 5.1%
Year that the rate reaches the
ultimate trend rate		 —	 —	 2015	 2013
(1) Determined as of end of year.
(2) Determined as of beginning of year and adjusted for acquisitions.
Several factors are considered in developing the estimate for the long-
term expected rate of return on plan assets. For the defined benefit
retirement plans, these include historical rates of return of broad equity
and bond indices and projected long-term rates of return obtained
from pension investment consultants. The expected long-term rates
of return for plan assets are 8% – 9% for equities and 5% – 6% for
bonds. For other retiree benefit plans, the expected long-term rate of
return reflects the fact that the assets are comprised primarily of
Company stock. The expected rate of return on Company stock is based
on the long-term projected return of 9.5% and reflects the historical
pattern of favorable returns.
Assumed health care cost trend rates could have a significant effect
on the amounts reported for the other retiree benefit plans. A one-
percentage point change in assumed health care cost trend rates
would have the following effects:
	 	 	 One-Percentage	 One-Percentage 	
	 	 	 Point Increase	 Point Decrease
Effect on total of service and interest
cost components			 $  60	 $  (46)
Effect on postretirement benefit
obligation			 505	 (411)
Plan Assets. Our target asset allocation for the year ended June 30,
2008, and actual asset allocation by asset category as of June 30, 2008
and 2007, were as follows:
	 Target Asset Allocation
Asset Category	 Pension Benefits	 Other Retiree Benefits
Equity securities (1)			 48%		 96%
Debt securities			 52%		 4%
TOTAL			 100%		 100%
	 Asset Allocation at June 30
	 Pension Benefits	 	 Other Retiree Benefits
Asset Category	 	 2008	 2007	 2008	 2007
Equity securities (1)		 45%	 56%	 96%	 96%
Debt securities		 50%	 39%	 4%	 4%
Cash		 3%	 3%	 —	 —
Real estate		 2%	 2%	 —	 —
TOTAL		 100%	 100%	 100%	 100%
(1) Equity securities for other retiree plan assets include Company stock, net of Series B ESOP
debt of $2,809 and $2,932 as of June 30, 2008 and 2007, respectively.
Our investment objective for defined benefit retirement plan assets is
to meet the plans’ benefit obligations, while minimizing the potential
for future required Company plan contributions. The investment
strategies focus on asset class diversification, liquidity to meet benefit
payments and an appropriate balance of long-term investment return
and risk. Target ranges for asset allocations are determined by match-
ing the actuarial projections of the plans’ future liabilities and benefit
payments with expected long-term rates of return on the assets,
taking into account investment return volatility and correlations across
asset classes. Plan assets are diversified across several investment
managers and are generally invested in liquid funds that are selected
to track broad market equity and bond indices. Investment risk is
carefully controlled with plan assets rebalanced to target allocations
on a periodic basis and continual monitoring of investment managers’
performance relative to the investment guidelines established with
each investment manager.
Notes to Consolidated Financial Statements	 The Procter  Gamble Company	 71
Amounts in millions of dollars except per share amounts or as otherwise specified.
Cash Flows. Management’s best estimate of cash requirements for
the defined benefit retirement plans and other retiree benefit plans
for the year ending June 30, 2009, is $575 and $22, respectively. For
the defined benefit retirement plans, this is comprised of $180 in
expected benefit payments from the Company directly to participants
of unfunded plans and $395 of expected contributions to funded
plans. For other retiree benefit plans, this is comprised of expected
contributions that will be used directly for benefit payments. Expected
contributions are dependent on many variables, including the variability
of the market value of the plan assets as compared to the benefit
obligation and other market or regulatory conditions. In addition, we
take into consideration our business investment opportunities and
resulting cash requirements. Accordingly, actual funding may differ
significantly from current estimates.
Total benefit payments expected to be paid to participants, which
include payments funded from the Company’s assets, as discussed
above, as well as payments paid from the plans, are as follows:
	 	 	 	 	 	 Other	
	 	 	 	 	 Pension	 Retiree	
Years ending June 30	 	 	 	 Benefits	 Benefits
EXPECTED BENEFIT PAYMENTS
2009				 $  500	 $  204
2010				 505	 222
2011				 518	 240
2012				 520	 256
2013				 537	 271
2014 – 2018				 2,974	 1,590
Employee Stock Ownership Plan
We maintain the ESOP to provide funding for certain employee
benefits discussed in the preceding paragraphs.
The ESOP borrowed $1.0 billion in 1989 and the proceeds were used
to purchase Series A ESOP Convertible Class A Preferred Stock to fund
a portion of the U.S. DC plan. Principal and interest requirements of
the borrowing were paid by the Trust from dividends on the preferred
shares and from advances provided by the Company. The original
borrowing of $1.0 billion has been repaid in full, and advances from
the Company of $197 remain outstanding at June 30, 2008. Each
share is convertible at the option of the holder into one share of the
Company’s common stock. The dividend for the current year was equal
to the common stock dividend of $1.45 per share. The liquidation
value is $6.82 per share.
In 1991, the ESOP borrowed an additional $1.0 billion. The proceeds
were used to purchase Series B ESOP Convertible Class A Preferred
Stock to fund a portion of retiree health care benefits. These shares,
net of the ESOP’s debt, are considered plan assets of the Other Retiree
Benefits plan discussed above. Debt service requirements are funded by
preferred stock dividends, cash contributions and advances provided
by the Company, of which $194 is outstanding at June 30, 2008.
Each share is convertible at the option of the holder into one share of
the Company’s common stock. The dividend for the current year was
equal to the common stock dividend of $1.45 per share. The liquidation
value is $12.96 per share.
As permitted by SOP 93-6, “Employers Accounting for Employee
Stock Ownership Plans,” we have elected, where applicable, to continue
our practices, which are based on SOP 76-3, “Accounting Practices
for Certain Employee Stock Ownership Plans.” ESOP debt, which is
guaranteed by the Company, is recorded as debt (see Note 5) with an
offset to the Reserve for ESOP debt retirement, which is presented
within Shareholders’ Equity. Advances to the ESOP by the Company
are recorded as an increase in the Reserve for ESOP Debt Retirement.
Interest incurred on the ESOP debt is recorded as interest expense.
Dividends on all preferred shares, net of related tax benefits, are
charged to retained earnings.
The series A and B preferred shares of the ESOP are allocated to
employees based on debt service requirements, net of advances
made by the Company to the Trust. The number of preferred shares
outstanding at June 30 was as follows:
Shares in thousands	 	 2008	 2007	 2006
Allocated		 58,557	 60,402	 61,614
Unallocated		 18,665	 20,807	 23,125
TOTAL SERIES A		 77,222	 81,209	 84,739
Allocated		 21,134	 21,105	 21,733
Unallocated		 43,618	 44,642	 45,594
TOTAL SERIES B		 64,752	 65,747	 67,327
For purposes of calculating diluted net earnings per common share,
the preferred shares held by the ESOP are considered converted from
inception.
In connection with the Gillette acquisition, we assumed the Gillette
ESOP, which was established to assist Gillette employees in financing
retiree medical costs. These ESOP accounts are held by participants and
must be used to reduce the Company’s other retiree benefit obligations.
Such accounts reduced our obligation by $201 at June 30, 2008.
Amounts in millions of dollars except per share amounts or as otherwise specified.
72	 The Procter  Gamble Company	 Notes to Consolidated Financial Statements
NOTE 10
INCOME TAXES
Under SFAS 109, “Accounting for Income Taxes,” income taxes are
recognized for the amount of taxes payable for the current year and
for the impact of deferred tax liabilities and assets, which represent
future tax consequences of events that have been recognized differently
in the financial statements than for tax purposes. Deferred tax assets
and liabilities are established using the enacted statutory tax rates and
are adjusted for any changes in such rates in the period of change.
Earnings before income taxes consisted of the following:
Years ended June 30	 	 2008	 2007	 2006
United States		 $  9,142	 $  9,138	 $  7,410
International		 6,936	 5,572	 5,003
TOTAL		 16,078	 14,710	 12,413
The income tax provision consisted of the following:
Years ended June 30	 	 2008	 2007	 2006
CURRENT TAX EXPENSE
U.S. federal		 $1,016	 $2,667	 $1,961
International		 1,546	 1,325	 1,702
U.S. state and local		 227	 125	 178
			 2,789	 4,117	 3,841
DEFERRED TAX EXPENSE
U.S. federal		 1,267	 231	 226
International and other		 (53)	 22	 (338)
			 1,214	 253	 (112)
TOTAL TAX EXPENSE		 4,003	 4,370	 3,729
A reconciliation of the U.S. federal statutory income tax rate to our
actual income tax rate is provided below:
Years ended June 30	 	 2008	 2007	 2006
U.S. federal statutory
income tax rate		 35.0%	 35.0%	 35.0%
Country mix impacts of
foreign operations		 -6.6%	 -4.3%	 -3.6%
Income tax reserve adjustments		 -3.1%	 -0.3%	 -1.5%
Other		 -0.4%	 -0.7%	 0.1%
EFFECTIVE INCOME TAX RATE	 	 24.9%	 29.7%	 30.0%
Income tax reserve adjustments represent changes in estimated
exposures related to prior year tax positions.
As discussed in Note 1, on July 1, 2007, we adopted FASB Interpretation
No. 48, “Accounting for Uncertainty in Income Taxes” (FIN 48). The
adoption of FIN 48 resulted in a decrease to retained earnings as of
July 1, 2007, of $232, which was reflected as a cumulative effect of a
change in accounting principle, with a corresponding increase to the
net liability for unrecognized tax benefits. The impact primarily reflects
the accrual of additional statutory interest and penalties as required
by FIN 48, partially offset by adjustments to existing unrecognized tax
benefits to comply with FIN 48 measurement principles. The imple-
mentation of FIN 48 also resulted in a reduction in our net tax liabilities
for uncertain tax positions related to prior acquisitions accounted for
under purchase accounting, resulting in an $80 decrease to goodwill.
Additionally, the Company historically classified unrecognized tax
benefits in current taxes payable. As a result of the adoption of FIN 48,
unrecognized tax benefits not expected to be paid in the next 12 months
were reclassified to other noncurrent liabilities.
A reconciliation of the beginning and ending amount of unrecognized
tax benefits is as follows:
Balance at July 1, 2007				 $2,971
Increases in tax positions for prior years			 164
Decreases in tax positions for prior years			 (576)
Increases in tax positions for current year			 375
Settlements with taxing authorities			 (260)
Lapse in statute of limitations				 (200)
Currency translation				 108
Balance at June 30, 2008				 2,582
Included in the total unrecognized tax benefits is $1,563 that, if
recognized, would impact the effective tax rate in future periods.
We recognize accrued interest and penalties related to unrecognized
tax benefits in income tax expense. Accrued interest and penalties
as of June 30, 2008, were $656 and $155, respectively, and are not
included in the above table. During the fiscal year ended June 30, 2008,
we recognized $213 and $35 in interest and penalties, respectively.
The Company is present in over 140 taxable jurisdictions, and at
any point in time, has 30 – 40 audits underway at various stages of
completion. We evaluate our tax positions and establish liabilities for
uncertain tax positions that may be challenged by local authorities
and may not be fully sustained, despite our belief that the underlying
tax positions are fully supportable. Uncertain tax positions are reviewed
on an ongoing basis and are adjusted in light of changing facts and
circumstances, including progress of tax audits, developments in
case law, and closing of statute of limitations. Such adjustments are
reflected in the tax provision as appropriate. The Company has made
a concerted effort to bring its audit inventory to a more current position.
We have done this by working with tax authorities to conduct audits
for several open years at once. We have tax years open ranging from
1997 and forward. We have $318 related to uncertain tax positions
classified as current, for which we expect settlement to be made in
the next 12 months. For the remaining uncertain tax positions, it is
difficult at this time to estimate the timing of the resolution. In addition,
we are generally not able to reliably estimate the ultimate settlement
amounts until the close of the audit. While we do not expect material
changes, it is possible that the amount of unrecognized benefit with
respect to our uncertain tax positions will significantly increase or
decrease within the next 12 months related to the audits described
Notes to Consolidated Financial Statements	 The Procter  Gamble Company	 73
Amounts in millions of dollars except per share amounts or as otherwise specified.
above. At this time we are not able to make a reasonable estimate of
the range of impact on the balance of unrecognized tax benefits or
the impact on the effective tax rate related to these items.
Tax benefits credited to shareholders’ equity totaled $1,823 and
$1,066 for the years ended June 30, 2008 and 2007, respectively.
These primarily relate to the tax effects of net investment hedges,
excess tax benefits from the exercise of stock options and the impacts
of certain adjustments to pension and other retiree benefit obligations
recorded in shareholders’ equity, including the impact of adopting
SFAS 158 in 2007.
We have undistributed earnings of foreign subsidiaries of approximately
$21 billion at June 30, 2008, for which deferred taxes have not been
provided. Such earnings are considered indefinitely invested in the
foreign subsidiaries. If such earnings were repatriated, additional tax
expense may result, although the calculation of such additional taxes
is not practicable.
Deferred income tax assets and liabilities were comprised of the
following:
June 30	 	 	 2008	 2007
DEFERRED TAX ASSETS
Stock-based compensation			 $  1,082	 $  1,132
Unrealized loss on financial and
foreign exchange transactions		 1,274	 723
Pension and postretirement benefits		 633	 560
Loss and other carryforwards			 482	 439
Advance payments			 302	 183
Goodwill and other intangible assets		 267	 249
Accrued marketing and promotion expense		 125	 161
Accrued interest and taxes			 123	 —
Inventory			 114	 95
Fixed assets			 100	 85
Other			 1,048	 1,119
Valuation allowances			 (173)	 (190)
TOTAL			 5,377	 4,556
DEFERRED TAX LIABILITIES
Goodwill and other intangible assets		 $12,371	 $12,102
Fixed assets			 1,847	 1,884
Other			 151	 132
TOTAL			 14,369	 14,118
Net operating loss carryforwards were $1,515 and $1,442 at June 30,
2008 and 2007, respectively. If unused, $629 will expire between 2009
and 2028. The remainder, totaling $886 at June 30, 2008, may be
carried forward indefinitely.
NOTE 11
COMMITMENTS AND CONTINGENCIES
Guarantees
In conjunction with certain transactions, primarily divestitures, we may
provide routine indemnifications (e.g., indemnification for representa-
tions and warranties and retention of previously existing environmental,
tax and employee liabilities) of which terms range in duration and in
some circumstances are not explicitly defined. The maximum obligation
under some indemnifications is not explicitly stated and, as a result,
the overall amount of these obligations cannot be reasonably esti-
mated. Other than obligations recorded as liabilities at the time of
divestiture, we have not made significant payments for these indem-
nifications. We believe that if we were to incur a loss on any of these
matters, the loss would not have a material effect on our financial
position, results of operations or cash flows.
In certain situations, we guarantee loans for suppliers and customers.
The total amount of guarantees issued under such arrangements is
not material.
Off-Balance Sheet Arrangements
We do not have off-balance sheet financing arrangements, including
variable interest entities, under FIN 46(R), “Consolidation of Variable
Interest Entities,” that have a material impact on our financial
statements.
Purchase Commitments
We have purchase commitments for materials, supplies, services and
property, plant and equipment as part of the normal course of business.
Commitments made under take-or-pay obligations are as follows:
2009 – $1,205; 2010 – $917; 2011 – $745; 2012 – $688; 2013 – $408;
and $363 thereafter. Such amounts represent future purchases in line
with expected usage to obtain favorable pricing. Approximately 35%
of our purchase commitments relate to service contracts for information
technology, human resources management and facilities management
activities that were outsourced in recent years. Due to the proprietary
nature of many of our materials and processes, certain supply contracts
contain penalty provisions for early termination. We do not expect to
incur penalty payments under these provisions that would materially
affect our financial position, results of operations or cash flows.
Operating Leases
We lease certain property and equipment for varying periods. Future
minimum rental commitments under noncancelable operating leases
are as follows: 2009 – $299; 2010 – $288; 2011 – $240; 2012 – $196;
2013 – $185; and $448 thereafter. Operating lease obligations are
shown net of guaranteed sublease income.
Amounts in millions of dollars except per share amounts or as otherwise specified.
74	 The Procter  Gamble Company	 Notes to Consolidated Financial Statements
Litigation
We are subject to various legal proceedings and claims arising out of
our business which cover a wide range of matters such as governmental
regulations, antitrust and trade regulations, product liability, patent
and trademark matters, income taxes and other actions.
Recently, the Company became subject to a variety of investigations
into potential competition law violations in the European Union,
including investigations initiated in the fourth quarter of fiscal 2008 by
the European Commission with the assistance of the national authorities
from a variety of countries. We believe these matters involve a number
of other consumer products companies and/or retail customers. The
Company’s policy is to comply with all laws and regulations, including
all antitrust and competition laws. Competition and antitrust law
inquiries often continue for several years and, if violations are found,
can result in substantial fines. At this point, no significant formal claims
have been made against the Company or any of our subsidiaries in
connection with any of the above inquiries. We cannot at this time
predict the final financial impact of these competition law issues.
However, the ultimate resolution of these matters could result in fines
or other costs that could materially impact future results. As these
matters evolve we will, if necessary, recognize the appropriate reserves.
With respect to other litigation and claims, while considerable uncer-
tainty exists, in the opinion of management and our counsel, the
ultimate resolution of the various lawsuits and claims will not materially
affect our financial position, results of operations or cash flows.
We are also subject to contingencies pursuant to environmental laws
and regulations that in the future may require us to take action to
correct the effects on the environment of prior manufacturing and
waste disposal practices. Based on currently available information, we
do not believe the ultimate resolution of environmental remediation
will have a material adverse effect on our financial position, results of
operations or cash flows.
NOTE 12
SEGMENT INFORMATION
Effective July 1, 2007, we made a number of changes to our organi-
zational structure and certain of our key leadership positions. These
resulted in changes to our Global Business Units (GBU) and reporting
segment structure. The following discussion and segment information
reflect the organizational changes for all periods presented. We are
organized under three Global Business Units as follows:
The Beauty GBU includes the Beauty and the Grooming businesses.•	
The Beauty business is comprised of cosmetics, deodorants, prestige
fragrances, hair care, personal cleansing and skin care. The Grooming
business includes blades and razors, electric hair removal devices,
face and shave products and home appliances.
The Health and Well-Being GBU includes the Health Care and•	
the Snacks, Coffee and Pet Care businesses. The Health Care busi-
ness includes feminine care, oral care, personal health care and
pharmaceuticals. The Snacks, Coffee and Pet Care business includes
coffee, pet food and snacks.
The Household Care GBU includes the Fabric Care and Home Care as•	
well as the Baby Care and Family Care businesses. The Fabric Care and
Home Care business includes air care, batteries, dish care, fabric care
and surface care. The Baby Care and Family Care business includes
baby wipes, bath tissue, diapers, facial tissue and paper towels.
Under U.S. GAAP, we have six reportable segments: Beauty; Grooming;
Health Care; Snacks, Coffee and Pet Care; Fabric Care and Home Care;
and Baby Care and Family Care. The accounting policies of the busi-
nesses are generally the same as those described in Note 1. Differences
between these policies and U.S. GAAP primarily reflect: income taxes,
which are reflected in the businesses using applicable blended statutory
rates; the recording of fixed assets at historical exchange rates in certain
high-inflation economies; and the treatment of certain unconsolidated
investees. Certain unconsolidated investees are managed as integral
parts of our business units for management reporting purposes.
Accordingly, these partially owned operations are reflected as consoli-
dated subsidiaries in segment results, with 100% recognition of the
individual income statement line items through before-tax earnings.
Eliminations to adjust these line items to U.S. GAAP are included in
Corporate. In determining after-tax earnings for the businesses, we
eliminate the share of earnings applicable to other ownership interests,
in a manner similar to minority interest, and apply statutory tax rates.
Adjustments to arrive at our effective tax rate are also included in
Corporate.
Corporate includes certain operating and non-operating activities that
are not reflected in the operating results used internally to measure and
evaluate the businesses, as well as eliminations to adjust management
reporting principles to U.S. GAAP. Operating activities in Corporate
include the results of incidental businesses managed at the corporate
level along with the elimination of individual revenues and expenses
generated by certain unconsolidated investees discussed in the preced-
ing paragraph over which we exert significant influence, but do not
control. Operating elements also comprise certain employee benefit
costs, the costs of certain restructuring-type activities to maintain a
competitive cost structure including manufacturing and workforce
rationalization and other general corporate items. The non-operating
elements primarily include interest expense, divestiture gains and
interest and investing income. In addition, Corporate includes the
historical results of certain divested businesses, including certain Gillette
brands that were divested in 2006 as required by the regulatory
authorities in relation to the Gillette acquisition. Corporate assets
primarily include cash, investment securities and all goodwill.
We had net sales in the U.S. of $33.0 billion, $31.9 billion and
$29.5 billion for the years ended June 30, 2008, 2007 and 2006,
respectively. Assets in the U.S. totaled $73.8 billion and $73.5 billion
as of June 30, 2008 and 2007, respectively.
Our largest customer, Wal-Mart Stores, Inc. and its affiliates, accounted
for 15% of consolidated net sales in 2008, 2007 and 2006.
Notes to Consolidated Financial Statements	 The Procter  Gamble Company	 75
Amounts in millions of dollars except per share amounts or as otherwise specified.
	 	 	 	 	 	 	 Before-Tax	 	 Depreciation 	 	 Capital	
Global Segment Results	 	 	 	 	 Net Sales	 Earnings	 Net Earnings	 Amortization	 Total Assets	 Expenditures
BEAUTY GBU
	BEAUTY (1)				 2008	 $19,515	 $  3,528	 $  2,730	 $  454	 $  12,260	 $  465
					 2007	 17,889	 3,440	 2,611	 419	 11,140	 431
					 2006	 16,687	 3,262	 2,412	 380	 10,081	 384
	 GROOMING (1)				 2008	 8,254	 2,299	 1,679	 739	 27,406	 305
					 2007	 7,437	 1,895	 1,383	 729	 27,767	 314
					 2006	 5,114	 1,176	 846	 573	 28,994	 361
HEALTH AND WELL-BEING GBU
	 HEALTH CARE (1)				 2008	 14,578	 3,746	 2,506	 441	 10,597	 450
					 2007	 13,381	 3,365	 2,233	 439	 9,512	 374
					 2006	 11,831	 2,785	 1,829	 374	 9,636	 341
	 SNACKS, COFFEE AND PET CARE			 2008	 4,852	 762	 477	 136	 2,275	 105
					 2007	 4,537	 759	 477	 164	 2,176	 141
					 2006	 4,383	 627	 385	 159	 2,122	 150
HOUSEHOLD CARE GBU
	 FABRIC CARE AND HOME CARE (1)			 2008	 23,831	 5,078	 3,422	 603	 13,772	 765
					 2007	 21,469	 4,650	 3,127	 573	 12,179	 710
					 2006	 18,918	 3,905	 2,609	 521	 11,318	 599
	BABY CARE AND FAMILY CARE			 2008	 13,898	 2,700	 1,728	 612	 8,102	 763
					 2007	 12,726	 2,291	 1,440	 671	 7,731	 769
					 2006	 11,972	 2,071	 1,299	 612	 7,339	 739
CORPORATE (1)				 2008	 (1,425)	 (2,035)	 (467)	 181	 69,580	 193
					 2007	 (963)	 (1,690)	 (931)	 135	 67,509	 206
					 2006	 (683)	 (1,413)	 (696)	 8	 66,205	 93
TOTAL COMPANY (1)				 2008	 83,503	 16,078	 12,075	 3,166	 143,992	 3,046
					 2007	 76,476	 14,710	 10,340	 3,130	 138,014	 2,945
					 2006	 68,222	 12,413	 8,684	 2,627	 135,695	 2,667
(1) 2006 data includes Gillette results for the nine months ended June 30, 2006.
Amounts in millions of dollars except per share amounts or as otherwise specified.
76	 The Procter  Gamble Company	 Notes to Consolidated Financial Statements
NOTE 13
QUARTERLY RESULTS (UNAUDITED)
Quarters Ended	 	 	 	 	 	 Sept 30	 Dec 31	 Mar 31	 Jun 30	 Total Year
Net Sales					 2007 – 2008	 $20,199	 $21,575	 $20,463	 $21,266	 $83,503
						 2006 – 2007	 18,785	 19,725	 18,694	 19,272	 76,476
Operating Income					 2007 – 2008	 4,418	 4,714	 4,111	 3,840	 17,083
						 2006 – 2007	 4,054	 4,350	 3,646	 3,400	 15,450
Gross Margin					 2007 – 2008	 52.9%	 51.8%	 51.3%	 49.2%	 51.3%
						 2006 – 2007	 52.8%	 52.9%	 51.6%	 50.8%	 52.0%
Net Earnings					 2007 – 2008	 $  3,079	 $  3,270	 $  2,710	 $  3,016	 $12,075
						 2006 – 2007	 2,698	 2,862	 2,512	 2,268	 10,340
Diluted Net Earnings Per Common Share			 2007 – 2008	 $   0.92	 $   0.98	 $   0.82	 $   0.92	 $   3.64
						 2006 – 2007	 0.79	 0.84	 0.74	 0.67	 3.04
The Procter  Gamble Company	 77
Corporate Officers
CORPORATE 
COMPANY OPERATIONS
A.G. Lafley
Chairman of the Board and
Chief Executive Officer
Susan E. Arnold
President —
Global Business Units
Robert A. McDonald
Chief Operating Officer
Clayton C. Daley, Jr.
Vice Chairman and
Chief Financial Officer
Moheet Nagrath
Global Human Resources
Officer
Bruce Brown
Chief Technology Officer
R. Keith Harrison, Jr.
Global Product Supply Officer
Steven W. Jemison
Chief Legal Officer and
Secretary
Mariano Martin
Global Customer Business
Development Officer
Charlotte R. Otto
Global External Relations
Officer
Filippo Passerini
President — 
Global Business Services and
Chief Information Officer
Marc S. Pritchard
Global Marketing Officer
Jon R. Moeller
Vice President and Treasurer
Valarie L. Sheppard
Vice President and
Comptroller
GLOBAL
OPERATIONS
Werner Geissler
Vice Chairman — 
Global Operations
Deborah A. Henretta
Group President — 
Asia
Laurent L. Philippe
Group President — 
Central  Eastern Europe,
Middle East  Africa
Steven D. Bishop
President — 
North America
Giovanni Ciserani
President — 
Western Europe
Daniela Riccardi
President — 
Greater China
Jeffrey K. Schomburger
President — 
Global Wal-Mart Team
Jorge A. Uribe
President — 
Latin America
GLOBAL BEAUTY
 GROOMING
Edward D. Shirley
Vice Chairman — 
Global Beauty  Grooming
Charles V. Bergh
Group President — 
Global Personal Care
Christopher de
Lapuente
Group President — 
Global Hair Care
Juan Pedro Hernandez
President — 
Braun
Virginia C. Drosos
President — 
Global Personal Beauty
Robert Jongstra
President — 
Global Professional Care
Hartwig Langer
President — 
Global Prestige Products
GLOBAL HEALTH
 WELL-BEING
Robert A. Steele
Vice Chairman — 
Global Health 
Well-Being
Melanie Healey
Group President — 
Global Feminine 
Health Care
Charles E. Pierce
Group President — 
Global Oral Care
John P. Goodwin
President — 
Global Snacks 
Pet Care
Jamie P. Egasti
President — 
Coffee
Thomas M. Finn
President — 
Global Health Care
GLOBAL
HOUSEHOLD CARE
Dimitri Panayotopoulos
Vice Chairman — 
Global Household Care
Jorge S. Mesquita
Group President — 
Global Fabric Care
Martin Riant
Group President — 
Global Baby Care
David S. Taylor
Group President — 
Global Home Care
Mark Bertolami
President — 
Duracell
Mary Lynn Ferguson-
McHugh
President — 
Family Care
Sharon J. Mitchell
Senior Vice President — 
Research  Development,
Global Fabric Care
The following company officers have
announced their intention to retire during
the 2008/09 fiscal year:
Ravi Chaturvedi
President — 
Northeast Asia
G. Gilbert Cloyd
Chief Technology Officer
James R. Stengel
Global Marketing Officer
78	 The Procter  Gamble Company	
Board of Directors
Bruce L. Byrnes
Retired Vice Chairman of the Board — Global Brand Building Training.
Director since 2002. Also a Director of Cincinnati Bell Inc. Age 60.
Mr. Byrnes retired from the Board of Directors following the Company’s
June, 2008 Board meeting.
Kenneth I. Chenault
Chairman and Chief Executive Officer of the American Express Company
(financial services). Appointed to the Board on April 21, 2008. Also a
Director of International Business Machines Corporation. Age 57.
Member of the Audit and Compensation  Leadership Development
Committees.
Scott D. Cook
Chairman of the Executive Committee of the Board, Intuit Inc.
(software and web services). Director since 2000. Also a Director of
eBay Inc. Age 56. Member of the Compensation  Leadership
Development and Innovation  Technology Committees.
Rajat K. Gupta
Senior Partner Emeritus at McKinsey  Company (international
consulting). Director since 2007. Also a Director of The Goldman Sachs
Group, Inc. Genpact, Ltd. and American Airlines. Age 59. Member
of the Audit and Innovation  Technology Committees.
A.G. Lafley
Chairman of the Board and Chief Executive Officer of the Company.
Director since 2000. Also a Director of General Electric Company and
Dell Inc. Age 61.
Charles R. Lee
Retired Chairman of the Board and Co-Chief Executive Officer of
Verizon Communications Inc. (telecommunication services). Director
since 1994. Also a Director of The DIRECTV Group, Inc., Marathon
Oil Corporation, United Technologies Corporation and US Steel
Corporation. Age 68. Chair of the Audit Committee and member
of the Compensation  Leadership Development Committee.
Lynn M. Martin
Former Professor at the J.L. Kellogg Graduate School of Management,
Northwestern University and former Chair of the Council for the
Advancement of Women and Advisor to the firm of Deloitte 
Touche LLP for Deloitte’s internal human resources and minority
advancement matters. Director since 1994. Also a Director of ATT Inc.,
Ryder System, Inc., Dreyfus Funds and Constellation Energy Group, Inc.
Age 68. Member of the Governance  Public Responsibility and
Innovation  Technology Committees.
W. James McNerney, Jr.
Chairman of the Board, President and Chief Executive Officer of
The Boeing Company (aerospace, commercial jetliners and military
defense systems). Director since 2003. Age 59. Presiding Director,
Chair of the Compensation  Leadership Development Committee
and member of the Governance  Public Responsibility Committee.
Johnathan A. Rodgers
President and Chief Executive Officer of TV One, LLC (media and
communications). Director since 2001. Also a Director of Nike, Inc.
Age 62. Member of the Innovation  Technology Committee.
John F. Smith, Jr.
Retired Chairman of the Board and Chief Executive Officer of General
Motors Corporation (automobiles and related businesses) and retired
Chairman of the Board of Delta Air Lines, Inc. Director since 1995.
Also a Director of Swiss Reinsurance Company. Age 70. Mr. Smith
retired from the Board of Directors following the Company’s April, 2008
Board meeting.
Ralph Snyderman, M.D.
Chancellor Emeritus, James B. Duke Professor of Medicine at Duke
University. Director since 1995. Also a Director of Targacept, Inc.
and a Venture Partner of NEA. Age 68. Chair of the Innovation 
Technology Committee and member of the Audit Committee.
Margaret C. Whitman
Former President and Chief Executive Officer of eBay Inc. (global
internet company that includes online marketplaces, payments and
communications). Director since 2003. Also a Director of eBay Inc.
and Dreamworks Animation SKG, Inc. Age 52. Chair of the
Governance  Public Responsibility Committee and member of
the Compensation  Leadership Development Committee.
Patricia A. Woertz
Chairman, Chief Executive Officer and President of Archer Daniels
Midland Company (agricultural processors of oilseeds, corn, wheat,
and cocoa). Appointed to the Board on January 8, 2008. Age 55.
Member of the Audit and Governance  Public Responsibility
Committees.
Ernesto Zedillo
Former President of Mexico, Director of the Center for the Study of
Globalization and Professor in the field of International Economics
and Politics at Yale University. Director since 2001. Also a Director
of Alcoa Inc. and Electronic Data Systems Corporation. Age 56.
Member of the Governance  Public Responsibility and Innovation 
Technology Committees.
The Board of Directors has FOUR committees:
Audit Committee
Compensation  Leadership Development Committee
Governance  Public Responsibility Committee
Innovation  Technology Committee
The Procter  Gamble Company	 79
Shareholder Information
IF …
You need online access or help with your account•	
You are interested in our certificate safekeeping service•	
You want to arrange for direct deposit or reinvestment of dividends•	
You have a lost, stolen or destroyed stock certificate•	
CALL PERSON-TO-PERSON
Shareholder Services representatives are available•	
Monday – Friday, 9AM – 4PM EST at 1-800-742-6253
(call 1-513-983-3034 outside the USA and Canada)
• Automated service available after USA business hours
CONTACT PG — 24 HOURS A DAY
Visit us online at www.pg.com/investor, where you can get stock•	
purchase information, transaction forms, Company annual reports
and webcasts
E-mail us at shareholders.im@pg.com•	
Call for financial information at 1-800-764-7483•	
COMMON STOCK PRICE RANGE AND DIVIDENDS
	 Price Range
	 	 2007–2008	 2007–2008	 2006–2007 	 2006–2007	
Quarter Ended	 High	 Low	 High	 Low
September 30	 $70.73	 $60.89	 $62.85	 $55.25
December 31	 75.18	 67.90	 64.73	 61.50
March 31	 73.81	 62.74	 66.30	 60.42
June 30	 71.20	 60.44	 64.75	 60.76
	 Dividends
Quarter Ended	 	 	 2007–2008	 2006–2007
September 30			 $0.350	 $0.310
December 31			 0.350	 0.310
March 31			 0.350	 0.310
June 30			 0.400	 0.350
DIVIDEND HISTORY
PG has paid dividends without interruption since its incorporation in
1890, and has increased dividends each year for the past 52 fiscal years.
Over the past 52 years, PG’s compound annual dividend growth has
exceeded 9%.
CORPORATE HEADQUARTERS
The Procter  Gamble Company
P.O. Box 599
Cincinnati, OH 45201-0599
TRANSFER AGENT/SHAREHOLDER SERVICES
The Procter  Gamble Company
Shareholder Services Department
P.O. Box 5572
Cincinnati, OH 45201-5572
REGISTRAR
The Bank of New York Trust Company, N.A.
Corporate Trust Division
525 Vine Street, Suite 900
Cincinnati, OH 45202
EXCHANGE LISTING
New York, Paris
STOCK SYMBOL
PG
SHAREHOLDERS OF COMMON STOCK
There were approximately 2,231,000 common stock shareowners,
including shareholders of record, participants in the Shareholder
Investment Program, participants in PG stock ownership plans and
beneficial owners with accounts at banks and brokerage firms, as of
June 30, 2008.
FORM 10-K
Shareholders may obtain a copy of PG’s 2008 report to the
Securities and Exchange Commission on Form 10-K by going to
www.pg.com/investor or by calling us at 1-800-764-7483. This
information is also available at no charge by sending a request to
Shareholder Services at the address listed above.
The most recent certifications by our Chief Executive and Chief Financial
Officer pursuant to Section 302 of the Sarbanes-Oxley Act of 2002
are filed as exhibits to our Form 10-K for the fiscal year ended June 30,
2008. We have also filed with the New York Stock Exchange the most
recent Annual CEO certification as required by Section 303A.12(a) of
the New York Stock Exchange Listed Company Manual.
ANNUAL MEETING
The next annual meeting of shareholders will be held on Tuesday,
October 14, 2008. A full transcript of the meeting will be available
from Susan Felder, Assistant Secretary. Ms. Felder can be reached at
299 East Sixth Street, Cincinnati, Ohio 45202-3315.
80	 The Procter  Gamble Company	
Amounts in millions,	
except per share amounts	 	 2008	 2007	 2006	 2005	 2004	 2003	 2002	 2001	 2000	 1999	 1998
Net Sales		$  83,503	$  76,476	$  68,222	 $56,741	 $51,407	 $43,377	 $40,238	 $39,244	 $39,951	 $38,125	 $37,154
Gross Margin		 42,808	 39,790	 35,097	 28,869	 26,264	 21,155	 19,159	 17,071	 18,395	 16,901	 16,019
Operating Income		 17,083	 15,450	 13,249	 10,469	 9,382	 7,312	 6,073	 4,260	 5,678	 6,130	 5,581
Net Earnings		 12,075	 10,340	 8,684	 6,923	 6,156	 4,788	 3,910	 2,612	 3,363	 3,683	 3,472
Net Earnings Margin		 14.5%	 13.5%	 12.7%	 12.2%	 12.0%	 11.0%	 9.7%	 6.7%	 8.4%	 9.7%	 9.3%
Basic Net Earnings per
Common Share		$    3.86	$    3.22	$    2.79	 $   2.70	 $   2.34	 $   1.80	 $   1.46	 $   0.96	 $   1.24	 $   1.35	 $   1.25
Diluted Net Earnings per
Common Share		 3.64	 3.04	 2.64	 2.53	 2.20	 1.70	 1.39	 0.92	 1.17	 1.27	 1.18
Dividends Per
Common Share		 1.45	 1.28	 1.15	 1.03	 0.93	 0.82	 0.76	 0.70	 0.64	 0.57	 0.51
Restructuring Program
Charges (1)		$ —	$ —	$ —	 $ —	 $ —	 $   751	 $   958	 $  1,850	 $   814	 $   481	 $ —
Research and
Development Expense		 2,226	 2,112	 2,075	 1,940	 1,802	 1,665	 1,601	 1,769	 1,899	 1,726	 1,546
Advertising Expense		 8,667	 7,937	 7,122	 5,929	 5,466	 4,487	 3,782	 3,729	 3,906	 3,542	 3,638
Total Assets		 143,992	 138,014	 135,695	 61,527	 57,048	 43,706	 40,776	 34,387	 34,366	 32,192	 31,042
Capital Expenditures		 3,046	 2,945	 2,667	 2,181	 2,024	 1,482	 1,679	 2,486	 3,018	 2,828	 2,559
Long-Term Debt		 23,581	 23,375	 35,976	 12,887	 12,554	 11,475	 11,201	 9,792	 9,012	 6,265	 5,774
Shareholders’ Equity		 69,494	 66,760	 62,908	 18,475	 18,190	 17,025	 14,415	 12,560	 12,673	 12,352	 12,493
(1) Restructuring program charges, on an after-tax basis, totaled $538, $706, $1,475, $688 and $285 for 2003, 2002, 2001, 2000 and 1999, respectively.
Financial Summary (Unaudited)
The Procter  Gamble Company	 81
Shareholder Return Performance Graphs
The following graph compares the five-year cumulative total return of PG’s common stock as compared with the SP 500 Stock Index,
the Dow Jones Industrial Average Index, and a composite group comprised of the SP Household Products Index, the SP Paper Products Index,
the SP Personal Products Index, the SP Health Care Index and the SP Food Index. The composite group is weighted based on PG’s current
fiscal year revenues. The graph assumes $100 was invested on June 30, 2003 and that all dividends were reinvested.
Comparison of five-year cumulative total return
PG has paid dividends without interruption since its incorporation along with the increased dividends each year for the past 52 fiscal years.
PG’s compound annual dividend growth rate has exceeded 9% over the last 52 years.
dividends per share (split-adjusted)
(in dollars)	 	 	 	 	 	 	 2003	 2004	 2005	 2006	 2007	 2008
PG							 100	 124	 123	 132	 149	 151
Composite Group							 100	 128	 127	 143	 175	 164
SP 500							 100	 119	 127	 138	 166	 144
DJIA							 100	 119	 119	 133	 163	 142
 
(in dollars; split-adjusted)	 	 	 	 	 	 	 	 1956	 1969	 1982	 1995	 2008
Dividends per Share								 $0.01	 $0.04	 $0.13	 $0.35	 $1.45
82	 The Procter  Gamble Company	
PG at a Glance
	 	 	 	 Net Sales	
	 	 	 	 by GBU (1)
GBU	 Reportable Segment	 Key Products	 Billion Dollar Brands	 (in billions)
Beauty 	 Beauty 	 Cosmetics, Deodorants, Hair Care, Personal	 Head  Shoulders, Olay, 	 $ 27.8
		 Cleansing, Prestige Fragrances, Skin Care	 Pantene, Wella
		 Grooming	 Blades and Razors, Electric Hair Removal Devices,	 Braun, Fusion, Gillette, Mach3
		 Face and Shave Products, Home Appliances
HEALTH AND WELL-BEING 	 Health Care 	 Feminine Care, Oral Care, Personal Health Care,	 Actonel, Always, Crest, Oral-B	 $19.4
		 Pharmaceuticals
		 Snacks, Coffee 	 Coffee, Pet Food, Snacks 	 Folgers, Iams, Pringles	
	 and Pet Care
Household Care 	 Fabric Care and 	 Air Care, Batteries, Dish Care, Fabric Care,	 Ariel, Dawn, Downy, Duracell, 	 $37.7
	 Home Care	 Surface Care	 Gain, Tide
		 Baby Care and 	 Baby Wipes, Bath Tissue, Diapers, Facial Tissue,	 Bounty, Charmin, Pampers
	 Family Care 	 Paper Towels
(1) Partially offset by net sales in corporate to eliminate the sales of unconsolidated entities included in business unit results.
Recognition
PG is recognized as a leading global company, including a
#5 ranking on Fortune’s “Global Most Admired Companies,” the
#2 ranking on Fortune’s “Top Companies for Leaders” survey,
the #4 ranking on Barron’s “World’s Most Respected List,”
a #8 ranking on Business Week’s list of “World’s Most Innovative
Companies,” top rankings on the Dow Jones Sustainability
Index from 2000 – 2008, the “Advertiser of the Year” award
at the 2008 Cannes International Advertising Festival, and a
consistent #1 ranking within our industry on Fortune’s Most
Admired list for 23 of 24 total years and for 11 years in a row.
PG ranks among the top companies for Executive Women
(National Association for Female Executives), African Americans
(Working Mother and Black Enterprise Magazines), and Diversity
(Diversity Inc.Magazine).
Supplier diversity is a fundamental business strategy at PG.
In 2008, PG again spent over $1.9 billion with minority- and
women-owned businesses. Since 2005, PG has been a member
of the Billion Dollar Roundtable, a forum of 14 corporations that
spend more than $1 billion annually with diverse suppliers.
Design:VSAPartners,Inc.
The paper utilized in the printing of this annual report is certified by SmartWood to the
FSC Standards, which promotes environmentally appropriate, socially beneficial and
economically viable management of the world’s forests. The paper contains a mix of pulp
that is derived from FSC certified well-managed forests; post-consumer recycled paper
fibers and other controlled sources.
At PG, sustainability is embedded
into both our business strategy and
our holistic view of innovation.
By incorporating sustainability into
the rhythm of our work, we delight
consumers who want to make
sustainable choices but do not want
to make trade-offs in performance
or value. We believe this is where
PG innovation can make the most
meaningful difference.
By viewing innovation systemically through the
lens of sustainability:
We define innovation broadly, looking
for sustainability opportunities at every
touch-point along the path of our products.
This definition encompasses raw materials, formulation, manufacturing,
customization, logistics, customers, and consumers. In fact, we find that
a big innovation in one part of the path often sparks innovations in other
areas. For example, when we moved our line of liquid laundry detergents in
North America to a 2x concentration, we delivered significant environmental
improvements in water, energy, and CO2 usage as a result of the product /
packaging changes and a significant reduction in distribution miles.
In addition, we innovated in our customer interface to reduce solid waste.
We invest in innovation to improve the
environmental profile of our operations
and products.
In addition to investing in product development of more sustainable
products, we have systematized the process of sustainably designing and
building new facilities. In Box Elder, Utah, we recently broke ground on
a state-of-the art manufacturing facility that will deliver improvements in
energy, water, solid waste and indoor environmental quality.
We manage innovation with discipline,
using science-based, rigorous tools such
as life cycle assessment (LCA).
These tools aid in identifying sustainability opportunities for our products,
from discovery through disposal to potential reuse. LCA shows that
consumers use a vast amount of energy to heat water for laundry.
We optimized Ariel laundry detergent to have excellent cleaning
performance in cold water. We then partnered with several external
thought leaders to educate consumers to “Turn to 30°C” to save energy,
and we are making a measurable difference. In the UK, for example,
this has helped move from 2% of consumers who washed in cold in 2002,
to 17% today. In packaging, software has been developed that optimizes
material use, leading to decreases in the amount of plastic used.
This innovation has been shared externally and supported by WRAP
(The Waste  Resources Action Programme) in the UK.
We deliver innovation with a balance of
sustainable improvements, seen and unseen.
Some improvements, like reducing waste with a smaller Bounty paper towel
for smaller spills, are obvious product changes to the consumer. Others, such
as innovations in our manufacturing operations, are not visible — yet they
can deliver substantial sustainability improvements. For example, changes in
our manufacturing processes over the last five years on Bounty and Charmin
have reduced energy, CO2 and water usage.
We lead innovation by inspiring our employees
to take more personal responsibility in
delivering the Company’s sustainability goals.
This past Earth Day, we launched an employee engagement program
called “Take the R for Tomorrow.” This program is already delivering results
by increasing employee recycling and video collaboration instead of travel.
Our people, along with our external partners, are also establishing innovative
solutions to help improve the lives of millions of children in need through
our PG Live, Learn and Thrive™ programs. In China recently, our employees
proudly marked the opening of our 140th PG Hope School to help educate
children in rural areas.
While PG has a long track record of sustainability leadership and results,
we recognize our impact as a global company and accept our responsibility
for continual improvement. This is embedded in who we are and what we do.
And, we will remain committed to helping solve the world’s sustainability
challenges because we are designed to innovate, now and for generations
to come.
We invite you to learn more. Please visit www.pg.com/sustainability.
Sustainability
 Innovation
Improving quality of life, now and for generations to come
© 2008 Procter  Gamble
00046002

2008 Annual Report P&G

  • 1.
  • 2.
    Contents Letter to Shareholders2 Defining Innovation 10 Investing in Innovation 14 Managing Innovation 18 Delivering Innovation 22 Leading Innovation 26 Financial Contents 35 Corporate Officers 77 Board of Directors 78 Shareholder Information 79 11-Year Financial Summary 80 PG at a Glance 82 Financial Highlights Financial Summary (Unaudited) Amounts in millions, except per share amounts 2008 2007 2006 2005 2004 Net Sales $83,503 $76,476 $68,222 $56,741 $51,407 Operating Income 17,083 15,450 13,249 10,469 9,382 Net Earnings 12,075 10,340 8,684 6,923 6,156 Net Earnings Margin 14.5% 13.5% 12.7% 12.2% 12.0% Basic Net Earnings Per Common Share $   3.86 $   3.22 $   2.79 $   2.70 $   2.34 Diluted Net Earnings Per Common Share 3.64 3.04 2.64 2.53 2.20 Dividends Per Common Share 1.45 1.28 1.15 1.03 0.93
  • 3.
    PG is designedto innovate consistently and successfully in every part of our business. We define innovation broadly, in terms of what it is, where it comes from, and who’s responsible for it. We invest in innovation at industry-leading levels with ongoing productivity savings. We manage innovation with discipline. We deliver innovation that builds consumer trust and loyalty over time. We lead innovation on leading global brands and with an outstanding team of innovation leaders. PG is Designed to Innovate… and to grow.
  • 4.
    A.G. Lafley Chairman ofthe Board and Chief Executive Officer 1. 2001 EPS excludes $0.61 per share of costs from the Organization 2005 restructuring program and amortization of goodwill and indefinite-lived intangible assets. Note: An explanation and reconciliation of free cash flow and organic sales for 2008 is provided on page 55. At the heart of PG’s design for growth is our capability to innovate — broadly, reliably, and successfully, year after year, in every part of our business. We innovate across more categories and on more leading brands than any other consumer products company. We have a broader range of science and technology than any of our competitors. We invest more in innovation and marketing support than any other consumer products company. We deliver an unrelenting stream of innovation with systematic discipline. And PG’s businesses are run by women and men who are not only globally experienced general managers but also highly skilled innovation leaders. This helps PG deliver consistent, reliable innovation and reliable, sustainable growth. Innovation drives growth. We saw this in fiscal 2008, as PG delivered another year of innovation-driven growth at or above the Company’s target levels for sales, earnings-per-share and cash generation. Fiscal 2008 Results Net sales increased 9%, to $83.5 billion. Organic sales• increased 5%. Diluted earnings per share increased 20%, to $3.64 per share.• Free cash flow from operating activities was $12.8 billion,• or 106% of net earnings, well ahead of the 90% cash productivity target. Fiscal 2008 was PG’s seventh consecutive year of organic sales growth at or ahead of the long-term target range; brand and new product innovations, particularly in developing markets, accounted for virtually all this sales growth. Over the same period, diluted earnings per share have grown at a compound average growth rate of 13%,(1) well ahead of our long-term target. We’ve generated more than $60 billion in free cash flow since the beginning of the decade. Most importantly, we’ve delivered consistently strong total shareholder return over the past ten-, five-, three- and one-year periods, above the Dow Jones Industrial Average. Fellow PG Shareholders: In last year’s annual report, I explained how PG is designed to grow. We’ve designed a global, diversified business portfolio that enables PG to grow consistently and reliably. We’ve developed the core strengths — consumer understanding, brand-building, innovation, go-to-market capability, and scale —  that are needed to win in the consumer products industry. We manage the business with rigorous strategic, financial and operating discipline. We’ve built the most diverse, globally experienced team of business leaders in PG’s 171-year history. These elements work in combination to ensure PG can meet or exceed its growth targets reliably year after year. 2 The Procter Gamble Company
  • 5.
    PG Report Card ProgressAgainst PG’s Goals and Strategies Growth results Average annual Goals 2008 2001–2008 Organic Sales Growth (1) 4 – 6% 5% 6% Earnings-per-Share Growth 10%+ 20% 13%(2) Free Cash Flow Productivity (3) 90%+ 106% 118% Growth Strategies (2001–2008) Grow from the core: Leading Brands, Big Markets, Top Customers Volume up 7%, on average, for PG’s 24 billion- dollar brands (4) Volume up 7%, on average, for PG’s top 16 countries (5) Volume up 8%, on average, for PG’s top 10 retail customers (5) Develop faster-growing, higher-margin, more asset-efficient businesses Beauty sales more than doubled to $19.5 billion; profits tripled to $2.7 billion Health Care sales more than doubled to $14.6 billion; profit increased 4-fold to $2.5 billion Home Care sales more than doubled; profits more than tripled Accelerate growth in developing markets and among low-income consumers Developing market sales up 18% per year Over one-third of total company sales growth from developing markets Developing market profit margins comparable to developed market margins (1) Organic sales exclude the impacts of acquisitions, divestitures and foreign exchange, which were 6%, on average, in 2001-2008. (2) 2001 EPS excludes $0.61 per share of costs from the Organization 2005 restructuring program and amortization of goodwill and indefinite-lived intangible assets. (3) Free cash flow productivity is the ratio of free cash flow to net earnings. (4) Excludes the impact of adding newly acquired billion-dollar brands to the portfolio. (5) Excludes impact of adding Gillette. PG’s sales growth in fiscal 2008 came from a diverse mix of businesses and was driven primarily by innovation. Baby and Family Care organic sales increased 8%. Charmin• delivered double-digit organic volume growth behind the introduction of Charmin UltraStrong and a complete restage of the brand line-up. Pampers delivered double-digit volume growth — and became PG’s first $8 billion brand — behind the continued strength of Pampers Baby Stages of Development. Bounty introduced Bounty Extra Soft and upgraded Bounty Basic. Fabric and Home Care grew organic sales 6%, driven by liquid• laundry detergent compaction — a disruptive innovation rolled out across the entire North America laundry portfolio —  along with strong product innovation on Tide, Gain, Ariel, Downy, and Febreze. Beauty organic sales increased 4%, behind the continuing• success of Olay Definity and Regenerist product innovation, new product and package innovation on Head Shoulders, and a revolutionary new home hair-colorant called Perfect 10 on Nice ‘N Easy. Grooming grew organic sales 4%, led by more than 40%• top-line growth on the superior Fusion male shaving system. Fusion became PG’s 24th billion-dollar brand. Health Care organic sales grew 3%, driven by strong innovation• across the Health Care business: Crest Pro-Health Night Paste and Rinse, Oral-B Cross-Action Pro-Health Brush, Always Clean and Always Fresh, and comfort upgrades on the Naturella brand. Snacks, Coffee and Pet Care organic sales increased 4%, led• by the launch of Dunkin Donuts® retail coffee, a number of Pringles initiatives — including Rice Infusion, Extreme Flavors and Pringles Stix — and Iams Proactive Health for dogs and Healthy Naturals for cats. Growth was broad-based across all geographic regions, with mid-single-digit sales growth in developed markets and double- digit sales growth in developing markets. We successfully completed the integration of Gillette, exceeding cost synergy and dilution targets. Revenue synergies are on target, with significant upside potential over the next three to five years. We’ve just begun to leverage the Gillette and Oral-B brands, both strong platforms for innovation. The Procter Gamble Company 3
  • 6.
    On June 4,2008, we announced our agreement to merge PG’s coffee business with The J.M. Smucker Company. The agreement maximizes the after-tax value of the coffee business for PG shareholders and minimizes earnings-per-share dilution versus other alternatives. We expect to complete the transaction during the second quarter of fiscal 2009. Sustaining Growth through Innovation This is strong performance, but the challenge of sustaining growth is greater today than at any time in the past 50 years. Commodity and energy costs continue to rise for companies. Consumers are facing higher food and gas prices, declining home values, and rising levels of unemployment. The question shareholders and prospective investors are asking is: ”How will PG sustain growth in today’s challenging and uncertain economic environment?” The answer is clear to all of us at PG: we will continue to innovate in every part of our business. Innovation is at the heart of PG’s business model. It is the primary way we delight consumers, create value with retail partners, and create new business models to deliver consistent, sustainable growth at or ahead of the Company’s goals. A lot of companies talk about innovation, but PG has demonstrated the capability — over decades — to innovate consistently, reliably and successfully. We have a long list of innovation firsts in our industry: Tide was the first heavy-duty laundry detergent• Crest, the first fluoride toothpaste clinically proven to prevent• tooth decay Downy, the first ultra-concentrated rinse-add fabric softener• Pert Plus, the first 2-in-1 shampoo and conditioner• Head• Shoulders, the first pleasant-to-use shampoo effective against dandruff Pampers, the first affordable, mass-marketed disposable diaper• Bounty, the first three-dimensional paper towel• Always, the first feminine protection pad with an innovative,• dry-weave topsheet. Febreze, the first fabric and air care products that actually• remove odors from fabrics and the air Crest White Strips, the first patented in-home teeth whitening• technology PG continues to be one of the few companies in our industry that creates new categories and brands, new performance standards, and new definitions of consumer value. Swiffer and Febreze created entirely new product categories. Crest Pro-Health, Olay Regenerist and Definity, Pampers Baby Stages of Development, and Tide with Bleach redefined high performance in their categories. Olay innovation has created new consumer experiences that are as good as — or better than — several- hundred-dollar department and specialty store brands. We innovate so consistently across our diverse portfolio of businesses, and so consistently over time, because we’ve created a unique design for innovation at PG. 1. We define innovation broadly. 2. We invest in innovation at industry-leading levels. 3. We manage innovation with discipline. 4. We deliver innovation that builds consumer trust and loyalty over time. 5. We lead innovation with global brands and an outstanding team of innovation leaders. This integrated, end-to-end approach is complemented by PG’s global scale and scope, which is unrivaled in our industry. The result is an innovation design that enables PG to win with consumers and retail customers and to generate sustainable long-term growth and shareholder value. Defining Innovation Broadly We define innovation broadly. We innovate in every area where our brands touch consumers’ lives: the package and product, the shopping experience, the in-home product usage experience, and every aspect of communication. We also create innovative new business models and organizational structures. By innovating so broadly, we get to see more innovation opportunities and to leverage more innovation resources than more narrowly focused competitors. Our Family Care business is a good example. Twenty years ago, we created a proprietary paper-making process that enables us to produce the strongest, softest, most absorbent paper towels and tissues on the market. But our approach to innovation in Tissues and Towels is driven by consumers, not by the technology. 4 The Procter Gamble Company
  • 7.
    Consumers don’t allwant the same benefits from a brand like Bounty. Some consumers want a paper towel designed for spills and light cleaning; it’s important to them not to be wasteful. We created Bounty Basic for these consumers, which is just right for everyday tasks but not over-designed. We created Bounty UltraStrong for consumers who value strength and absorbency and Bounty Extra Soft for those who want more softness. All these products use the same paper-making technology, but provide highly tailored benefits to meet specific consumer needs. We also tailor marketing and communications to specific consumer needs. Bounty Basic consumers aren’t persuaded by television advertising; they get all the brand communication they need at the store shelf. Other consumers are receptive to information about our brands at different times and places, and we respond with communication and marketing plans tailored to their desires and preferences. We’re able to innovate broadly and successfully because we engage consumers as co-designers of innovation. We live with consumers in their homes, shop with them in stores, and observe their daily behavior for days, weeks and even months at a time. Consumers are active participants in PG’s innovation process, and we keep them involved in every step that guides a new product or idea from concept to launch. We also involve external innovation partners to turbo-charge PG’s internal innovative capability — an approach we call “Connect and Develop.” Six years ago, only 15% of our product initiatives included innovation from outside PG. Today, more than half of all PG innovation includes an external partner. In just the past year, we evaluated more than 5,000 innovation opportunities from small entrepreneurs, universities, research institutes, and large companies. This is a fourfold increase over the number of external innovations we were considering at the beginning of the decade. Designed to Innovate Defining PG defines innovation broadly Investing PG invests in innovation at industry-leading levels Managing PG manages innovation with disciplineDelivering PG delivers innovation that builds consumer trust and loyalty over time Leading PG leads innovation with global brands and outstanding innovation leaders The Procter Gamble Company 5
  • 8.
    By defining innovationso broadly — what it is, where it comes from, who’s responsible for it — we continually expand and unleash PG’s innovation potential. The best proof of our innovation capability is the number of top-selling new products that come from PG. The IRI Pacesetters study tracks and ranks the most successful new consumer products introduced in the U.S. For the past 13 years, one-third of the most successful Pacesetter products, on average, have come from PG and Gillette — more than our top six competitors combined. In 2008, 5 of the 10 best-selling new products came from PG, including Tide Simple Pleasures detergent, Febreze Noticeables air fresh- ener, the new Herbal Essences line of products, Crest Pro-Health toothpaste, and Olay Definity skin care products. Investing in Innovation Another point of difference is PG’s ability to invest in innovation at industry-leading levels. We invest more than $2 billion a year in RD, nearly twice the level of our closest competitor, Unilever, and roughly equal to the combined total of our other major competitors — Avon, Clorox, Colgate, Energizer, Henkel, Kimberly Clark, L’Oreal, and Reckitt Benckiser. We also maintain a high level of marketing investment in our brands. PG’s advertising investment has averaged about 10% of sales over the past 15 years. We maintain this strong level of innovation and marketing investment, while continuing to grow margins, by continually increasing PG’s productivity. The more productive we become, the more we can redeploy people and dollars to innovation. PG has a strong track record of reliable productivity growth. Sales per employee have grown more than threefold and net earnings per employee are up eightfold since 1980. Over the past 10 years, PG’s productivity on a sales-per-employee basis has grown at an average rate of 6% a year. This performance is more than twice the U.S. average of roughly 2.5% productivity growth per year. PG grows productivity so reliably because we take a very systemic approach. A good example of this is Global Business Services — PG’s shared services business model. Early this decade, we significantly reduced the cost of business services by centralizing and standardizing PG systems, infrastructure and services. We then focused on improved service levels and greater value creation, ultimately creating a global business services organization that has been recognized externally as the best shared-services organization in the world, and which has delivered nearly $600 million of cumulative cost savings to date —  a substantial portion of which we’ve reinvested in innovation. In addition, GBS — in collaboration with our RD and Engineering functions — is making PG a more productive and effective innovator by accelerating the use of virtualization, computer modeling and simulation. Virtualization is enabling PG brands to co-design products with consumers. The same technologies allow us to show retailers virtual in-store displays for half the cost and less than half the time required for physical shelf designs. Computer modeling and simulation saved PG about 17 years of design time in the last year alone. We’re convinced we can become even more productive, increasing productivity 7–8% a year. We’re making our brand portfolio more productive by focusing even more on our largest leading brands — the 44 brands with sales of $500 million or more that represent 85% of sales and more than 90% of profits. We’re getting more disciplined about how to manage the remaining brands in PG’s portfolio, investing in small brands that have potential to become billion-dollar brands of the future, supporting brands that may not have global potential but are local jewels in some markets, and consolidating or divesting underperforming brands. And, we’re seizing even more opportunities to leverage PG scale by eliminating duplicative activities, centralizing more functional support, and consolidating some small countries into regional hubs. We’re also going after cost savings throughout the Company. We have clearly defined goals for controlling overhead spending. Businesses projected to grow significantly faster than the balance of the portfolio have an overhead target equal to or less than half their projected sales growth; slower-growing businesses and all corporate functions are committed to zero overhead growth; businesses growing below company goals and/or with significant cost-structure issues must reduce overhead spending every year. This discipline reflects our commitment to flat or declining headcount for the foreseeable future. These and other efforts throughout the Company are critical. Productivity fuels innovation. Innovation drives growth. Managing Innovation with Discipline The next factor that sets PG apart as an innovator is discipline. We don’t rely on “Eureka!” moments; we take a systematic approach to innovation. For example, we’re highly systematic about how we organize for innovation. We don’t take a “one-size-fits-all” approach but we’re deliberate about creating the right structure for different kinds of innovation work. Our Corporate Innovation Fund, for example, specializes in high-risk, high-reward ideas; it’s essentially an in-house venture capital firm that does initial concept, design, engineering, and qualification work and then 6 The Procter Gamble Company
  • 9.
    hands over successfulideas to the appropriate business units. The FutureWorks team focuses exclusively on innovations that can create entirely new businesses. There are new-business development teams in every global business unit focusing on opportunities to create adjacent categories. Innovation centers help us solve tough innovation challenges by providing simulated in-home and in-store environments where PG teams can isolate themselves and interact with consumers and shoppers for days or even weeks at a time. Once an idea is qualified and begins moving through our product launch system, the innovation team continues to face go / no-go gates at every critical milestone. At each gate, we make decisions about which initiatives are ready to progress, which need further work, and which should be stopped. Every decision is grounded in maximizing the productivity of innovation investments and generating shareholder value. This disciplined approach is essential to innovation success. It builds accountability into both the creative and executional aspects of innovation. PG’s Family Care business is a good example here, as well. Family Care is one of PG’s strongest value-creating businesses. They’ve innovated broadly across brand platforms — Bounty, Charmin and Puffs — while delivering industry-leading, double-digit total shareholder return for the past one-, three- and five-year periods in a highly capital- intensive category. They’ve increased gross margins 7% and have delivered free cash flow well above the Company’s 90% cash productivity target for the past five years, despite invest- ments in innovation and in new manufacturing capacity to support growth. There are similar stories in Fabric Care, Feminine Care, Baby Care, Beauty Care, and Health Care. These are the results of disciplined innovation. Delivering a Steady Stream of Innovation What I’ve explained so far — the way we think about innovation, our ability to invest in it, and the discipline with which we manage it — are the elements of PG’s innovation design that are difficult to see from the outside. Each of these factors helps to set PG apart as an innovator. What counts most, however, is the innovation that consumers experience day after day, year after year. We earn consumer trust and loyalty over time by delivering an unending stream of innovation that consumers learn to expect from PG brands. We plan three-to-five years out and fill our pipeline with three distinct kinds of innovation. Disruptive innovation• creates new categories, new segments, or entirely new sources of consumer consumption. These are innovations that address consumer needs no other brand or product has met. Virtually all of PG’s billion-dollar brands were created with disruptive innovations. Sustaining innovation• is what we focus on most. These are extensions or improvements of existing products: big initiatives that meet consumer needs by filling gaps, eliminating consumer trade-offs, or providing new benefits. Examples include Pampers Caterpillar-Flex, which improved the fit and comfort of baby diapers, and Crest Pro-Health Rinse, the Crest brand’s entry into the mouth-rinse category adjacent to toothpastes. Commercial innovation• generates trial on existing products without a product or package change. Examples include the Gillette Champions and Pampers Unicef programs, marketing efforts that give consumers new reasons to be interested in and loyal to a PG brand. Always is a great example of how this multidimensional innovation strategy builds loyalty and category leadership. We introduced Always in 1984 as the first feminine protection pad with an innovative, dry-weave topsheet. In 1986, the brand set yet another performance standard with its proprietary “wings” product, followed by Ultra Thin products in 1991. These three disruptive innovations brought years of competitive advantage. In addition to these disruptive innovations, we have maintained a steady pace of product upgrades with sustaining innovations like Always Fresh, Always Clean and Always Overnight. This year, Always is leading innovation again, with a disruptive initiative called Always Infinity that uses a unique pad design and new, state-of-the-art technology to bring a new level of superior protection and absorbency to consumers. Always has also delivered a steady stream of meaningful commercial innovation. The brand’s school education programs teach girls about puberty, and introduce them to the category and our brands. Another commercial innovation, from both Always and Tampax, is beinggirl.com, a unique website that enables teens to get information in a safe, discreet environment and to interact with peers facing similar life-stage issues. This combination of disruptive, sustaining and commercial innovation keeps a brand like Always growing year after year. Always has grown in 21 of the 24 years since launch and has increased its U.S. market share from 14% to 48%, and today has a global share of 31%. There are examples like Always throughout PG’s brand portfolio. The Procter Gamble Company 7
  • 10.
    Leading Innovation Making PG’sdesign for innovation work is the job of leadership. Innovation is a human activity and leaders must unleash the creativity, initiative, leadership, and productivity of the innovators in their businesses. This requires a blend of intelligence and empathy. Empathy is incredibly important in a diverse, people- intensive business like ours. Most of our creativity and innovation happens in teams, and often the teammates are working in different parts of the world. To lead in this kind of environment, we need a balance of intellectual skills and empathic skills. We have to develop the intuition to understand and appreciate people’s intentions, feelings and motivations — all of which have been shaped by experiences that may be sharply different from those we’ve grown up with ourselves. At the same time, innovation leaders must be decision-makers. They must exercise the judgment and the courage to take innovation risks and to understand the role fast failure plays in the innovation process, while also being willing to stop projects and reallocate resources to bigger innovation opportunities when necessary. I’m a big believer that innovation leaders are made, not born. They learn to get comfortable with uncertainty. They learn to become more open-minded, to co-create with consumers, and to be receptive to ideas from different disciplines and industries. They learn to become both strategists and operational managers, to be agile and disciplined. As they learn and gain experience, they become more effective at leveraging PG’s design for innovation to deliver consistent, sustainable growth. The ability to lead effective innovation programs is required at PG, particularly at the general manager and president levels. Good innovation leaders need to be cultivated and promoted —  and I hold myself accountable for helping to select and develop the innovation leaders who run PG businesses around the world. Ensuring PG has the leaders and the pipeline to innovate for the next ten years is one of my most fundamental responsibilities as chief executive. Leveraging Global Scale and Scope The most differentiating aspect of PG’s approach to innovation is the scale and scope of our business and brand portfolio, science and technology platforms, and geographic reach. The diversity of our business portfolio creates highly valuable scale benefits. Our Health Beauty businesses take advantage of purchasing pools created by Household businesses such as laundry, diapers and paper products. This enables them to purchase packing materials and basic commodities at lower prices than their direct competitors. Similarly, Household Care enjoys economies of scale created by the large advertising budgets supporting our Health Beauty Care businesses. We use these scale advantages to invest in innovation. The diversity of PG’s brand portfolio gives us the opportunity to innovate in more aspects of consumers’ lives than nearly any other company. PG brands are in every room of the house, at virtually every hour of the day. As a result, we get to see more of consumers’ needs than other companies. This helps us spot more problems PG innovation can help solve and more aspirations PG brands can help achieve. Our science and technology portfolio is another huge scale advantage. Bleach technology from Laundry has been used in Health Beauty Care products such as Crest White Strips and Nice ‘n Easy Perfect 10 Hair Colorant. Non-woven top sheet technology started in Diapers, traveled to Feminine Care then moved to Swiffer and Olay Daily Facials. Proprietary perfume technology has been used to enhance the performance of Bounce, Febreze, Fine Fragrances, Camay and most recently Secret and Gillette Clinical Strength deodorant. We’re now combining Gillette’s expertise in mechanical engineering with our expertise in chemical engineering. Companies that compete primarily in Beauty can’t benefit from such technology transfer because they don’t have a Laundry business. Home Care competitors can’t move a substrate technology from diapers or feminine hygiene if they’re not in those businesses. There is no other company in our industry whose portfolio of businesses and brands, sciences and technologies is as broad, as deep or as diverse as PG’s. This is a very significant source of competitive advantage. We use our diverse mix of sciences and technologies to make innovation connections that other companies cannot make on their own. Another area in which we can leverage PG scale is our geographic reach. In developed markets like the U.S., where PG brands can be found in virtually every household, we leverage household penetration as a scale advantage. In developing markets, we’re using our portfolio of leading brands to attract and build a network of best-in-class, often exclusive distributors in countries such as China, India and Russia. Today our distributor network in China reaches about 800 million people. In India, our distributor network covers 4.5 million stores, an increase of two million stores in just five years. In Russia, we now have access to 80% of the population. 8 The Procter Gamble Company
  • 11.
    PG’s global scaleallows us to quickly flow innovation across developing countries. We create innovation to meet consumer needs in a particular region and then quickly flow that technology across multiple countries faster than competition. For example, consumers who wash clothing by hand need improved rinsing with less water. This is a common need in many developing countries. We launched Downy Single Rinse in Mexico, and have since expanded it into 12 countries, including China, the Philippines, and Peru. We did the same with Naturella, an innovative feminine protection product created specifically for low-income consumers in Latin America; we’re now expanding Naturella throughout Eastern Europe. We’ve created highly cost-effective laundry detergent formulations that we’ve expanded rapidly across developing markets. We’ve created a “better and cheaper” dentifrice formulation for Crest that was first introduced in China and has now been expanded into Eastern European markets — and has also been introduced as an important cost innovation in several developed markets. We’re able to do all this because we’ve built the systems and go-to-market scale that allow us to move an entire innovation —  concept, brand, product formulation, package, marketing, and in-store presence — to multiple markets almost simultaneously. With this geographic reach and capability, in developed and developing markets alike, we can expand innovation around the world and into millions of homes very quickly. Designed to Innovate — and Grow We’ve built PG’s business model around innovation because it’s the primary driver of superior consumer value and profitable organic sales growth in the consumer products industry. The companies that lead innovation are growth catalysts and generally capture a substantial portion of the growth they stimulate. I don’t know of a company that has sustained growth and industry leadership over the long term that has not also been the innovation leader. Innovation is especially important in tough economic periods. Consumers will continue to buy premium-priced products as long as they’re confident they’re getting value for their money. This is why innovation is so important. Price is an element of value, but the real driver of value perception is relative pricing, not absolute pricing, combined with product performance and brand equity. Innovation drives value. It differentiates our brands in the hearts and minds of consumers. It enables category leadership. It stimulates growth and prevents commoditization of the categories in which we compete. It drives premium pricing and higher gross and operating margins. This reality plays to PG strengths as an innovator. We innovate more broadly than any other company in our industry. We invest more in innovation and marketing support. We bring a richer mix of innovation to market with greater discipline and strong leadership. We’ve designed an innovation capability that is unmatched in the consumer products industry. Most important of all, PGers around the world see innovation as their job. They look for opportunities to innovate in every part of the business. Consumer researchers are developing innovative new ways to learn from consumers. Marketers are finding new ways and new places to engage consumers. Technicians operating lines in PG plants are creating innovative ideas for making products better, faster and cheaper. Innovation has always been at the heart of PG’s business model, but today it’s not the province of only one or two functions within the Company. Innovation is the focus of our entire organization. PG’s innovation capability is stronger and more robust today than at any time in the Company’s history — and this is why I’m confident innovation will continue to be the primary driver of sustainable sales and earnings-per-share growth at or ahead of PG’s long-term targets. PG is designed to innovate, and to grow. A.G. Lafley Chairman of the Board and Chief Executive Officer August 12, 2008 The Procter Gamble Company 9
  • 12.
  • 13.
    IN NG INNOVATION PG definesinnovation broadly —  what it is, where it comes from, and who’s responsible for it. What innovation is at PG: It’s everything we do that improves the value consumers get from putting their trust in PG brands. Innovation ranges from product formulation, package design and consumer communications to supply systems, business models and organizational productivity. Where innovation comes from at PG: Inside, across 22 global product categories and more than a hundred technology areas. Outside, from nearly two million potential innova- tion partners worldwide. Learn more about how PG connects to external innovation partners at www.pgconnectdevelop.com. Who’s responsible for innovation at PG: In a word, everyone. We maintain strict accountability for innovation success, but we encourage all PGers to innovate. We are all challenged to find new ways of delivering a better brand experience at a lower cost, which ultimately drives superior consumer value. The Procter Gamble Company 13
  • 14.
    N NG INNOVATION Head Shoulders is now the best-selling shampoo in the world. By innovating broadly, Head  Shoulders doubled its global sales in just five years. Consumer Insights Great innovation begins with a deep understanding of current and potential consumers. Most consumers felt Head Shoulders delivered good dandruff control, but many assumed they had to trade off beauty benefits. This research clearly defined the brand team’s challenge in developing new product, package and marketing innovations. Product Innovation The challenge: keep improving antidandruff performance while innovating to satisfy consumers’ beauty desires. A new focus on scalp health as the first step toward beautiful hair has appealed to a broad range of consumers beyond those concerned with dandruff. In addition, line extensions, such as “Sensitives,” have appealed to consumers with sensitive scalps, and on-package endorsements from dermatological associations have helped drive trial.
  • 15.
    Package and GraphicsInnovation The simple, elegant curve of the new Head Shoulders bottle design conveys the softer, more cosmetic side of the brand, while the bottle’s straight side reflects the strength and efficacy that consumers expect from Head Shoulders. The dramatic, intuitive graphic has strengthened brand equity and made it much easier for consumers to find the product that’s right for them. Marketing Innovation The package curve has become a consistent design feature in all global consumer communications, including TV, print, Internet and outdoor advertising. This consistent graphic look has helped build equity in the Head Shoulders brand at every consumer touch-point. Go-to-Market Innovation The business team developed a tool to evaluate scalp health and recommend the right Head Shoulders product. Millions of scalp evaluations have been done in and near retail stores around the world, helping consumers take the first step toward healthy, beautiful hair. Supply Chain Innovation PG’s hair care RD and supply chain experts developed creative solutions to produce the challenging new package along with selective product formulation improvements in record time. The new, equity-enhancing package was launched in more than 140 countries in just nine months, yielding amazing speed-to-market to delight Head Shoulders consumers around the world. Head Shoulders now generates about $2 billion in annual sales for PG. With strong momentum and a robust innovation pipeline, Head Shoulders should remain one of PG’s fastest-growing billion-dollar brands. The Procter Gamble Company 12
  • 16.
  • 17.
    ININNOVATION ST NG PG investsmore in innovation and marketing support than any other consumer products company. This level of investment is funded primarily by ongoing productivity efforts and rigorous cost discipline. Productivity and cost savings discipline are deeply ingrained in PG’s culture. Every organization has specific goals for cost savings and productivity improvements, and we manage restructuring work as an ongoing business activity. Steady investment in innovation and brand building is a top priority in both good times and challenging times alike. Decades of experience have taught us that building strong, innovation-leading brands that deliver superior consumer value is the best way to deliver consistently strong value creation for shareholders. The Procter Gamble Company 17
  • 18.
    ININNOVATION ST NG Maintaining consistentinvestment in innovation and marketing requires a relentless focus on productivity improvements and cost savings. Innovation, Productivity Growth Innovation, productivity and growth is a virtuous cycle at PG. In our industry, innovation and productivity are the key drivers of profitable organic sales growth. Innovation creates superior consumer value, differentiates brands, and prevents the commoditization of categories. Productivity fuels investment in innovation and brand-building, acting as an engine of both top- and bottom-line growth. Historical Productivity Improvement PG’s organizational productivity has increased both significantly and consistently over the years. Since 1980, it has jumped more than threefold, growing at a compound average rate of nearly 5% a year — more than twice the broad-based U.S. productivity rate. Net earnings per employee are up more than eight-fold, growing at an average of nearly 8% per year. Productivity Savings Projects We are constantly improving productivity in all areas of the business and all elements of cost. Net Sales - Cost of Products Sold Raw Packaging Materials Manufacturing Expenses Finished Product Logistics - Selling, General Administrative Costs Marketing Sales Research Administration Operating Profit - Interest Expense - Other Income Expense Pretax Profit - Taxes Net Earnings
  • 19.
    PG researchers arecontinually searching for new formulations and designs that lower cost, improve performance and increase value for consumers. For instance, new formulations of laundry detergents significantly reduced our use of packaging material, leading to cost savings, more consumer convenience and less waste for the environment. materials productivity We are building more local, multi-category manufacturing plants closer to the consumer, enabling local materials sourcing, lower distribution costs, and lower import duties. This also helps PG build strong international relationships and deepens our understanding of local consumer needs. manufacturing productivity We are generating cost savings in shipping and warehousing while improving service levels to customers by optimizing the Company’s finished-product supply chain, including cutting the number of distribution centers in half. distribution productivity All of PG’s major global brands have changed their mix of marketing tools to reach target consumers more cost effectively. In Feminine Care, for instance, Always and Tampax have reduced TV advertising budgets in favor of higher-return magazine ads and our “BeingGirl.com” website. marketing productivity PG is reducing go-to-market costs with streamlined organization designs in developing markets, smaller local organizations, and faster decision-making. We are implementing these designs in the Latin America, Central and Eastern Europe and ASEAN markets. go-to-market productivity PG has reduced RD costs as a percentage of sales, increased the value of the innovation pipeline and led the industry in innovation delivered to market by leveraging a global network of external innovation partners. rd productivity PG is driving down overhead costs as a percentage of sales by reducing senior management positions, cutting the number of managers on international assignments, moving toward a corporate shared services structure, and reducing staffing duplication among global, regional and local organizations. organizational productivity The Procter Gamble Company 16
  • 20.
  • 21.
    AG NG INNOVATION PG isa disciplined innovator. We select innovation projects, allocate resources, and bring innovation to market with disciplined processes and systems that ensure a steady new-product pipeline for every PG business. We select innovation projects by identifying consumer-inspired ideas that will build the most short- and long- term shareholder value, whether the ideas begin with PG or our partners. We allocate resources to innovation projects by applying rigorous success criteria at every step. Innovations must meet all criteria before moving to the next stage of development and investment. We bring innovation to market with plans and goals that span multiple years, and with disciplined systems that help ensure high levels of innovation success. The Procter Gamble Company 21
  • 22.
    AG NG INNOVATION 1 2 Game-changinginnovations like 2x concentrated liquid laundry detergents are successful because we apply a disciplined, systematic approach to innovation management. PG’s Innovation Process Search Discover. Great innovation ideas come from many places, including consumers, customers, external partners, and our own research. Many small investments are made to test the viability of new ideas, focusing on the long-term market potential of a new technology or product concept. Each year, PG researchers and business development professionals explore an estimated 5,000 new innovation ideas. Select Resource. With the data from the initial research phase, our disciplined selection process allocates limited resources — human and financial — to the most promising innovation opportunities. Projects are sometimes combined to create even bigger con- sumer opportunities while conserving resources. PG spends over $2 billion each year on RD, by far the most in the consumer products industry —  but each dollar of research funding and each hour of research time is treated like a scarce commodity.
  • 23.
    3 4 Design Qualify. Next, multifunctional teams — including professionals from product research, marketing, manufacturing, engineering, finance, and other functions — develop comprehensive plans to deliver against challenging success criteria. They leverage best-in-class tools, including virtual product and package design and consumer testing, to qualify each idea technically, conceptually and financially before it is approved for market launch. PG has built world-class expertise in 11 core technology areas, each critical to creating and qualifying winning innovations in our product categories. Launch Leverage. Finally, an innovation is introduced to consumers and retail customers along with a plan to help deliver key business objectives, including retail distribution, correct pricing, consumer trial, repeat purchase, and ultimately sales and profit. The performance of a new innovation is monitored and measured against these goals. We routinely modify plans to keep new innovations growing for years after launch, and many new brands and products are still building consumer trial after years in the market. The Procter Gamble Company 20
  • 24.
  • 25.
    VER NG INNOVATION PG deliversa consistent stream of innovation with a balanced combination of disruptive, sustaining and commercial innovations. Disruptive innovation at PG is innovation that creates new product categories, stimulates new consumer consumption, or resets performance standards in existing categories. Sustaining innovation at PG is the relentless stream of product, package, and other improvements that keep brands growing in the years following big, disruptive innovations. Commercial innovation at PG is marketing, communica- tions, and in-store innovations that build consumer awareness and trial between product or package improvements. The Procter Gamble Company 25
  • 26.
    ER NG INNOVATION Gillette hasbuilt the leading male grooming business in the world by delighting consumers with a consistent stream of innovation that improves the consumer experience and strengthens brand equity. Mach3 turbo 2002 Improved blade and lubricating strip technology, delivering the closest, most comfortable shave to date with less irritation M3power 2005 M3Power ra inspired by h performance young guns 2004 New marketing campaign including top NASCAR drivers world cup 1994 Gillette was a leading World Cup sponsor from 1960 to 2006 sensor excel 1993 The addition of five flexible microfins for a closer shave trac II plus 1988 The addition of the lubricating strip onto the Trac II blade cartridges m3 power 2004 First powered razor with improved blade technology Atra plus 1985 The first razor with a lubricating strip for increased glide Trac II 1971 Gillette’s first twin-blade shaving system for a closer shave Mach3 1998 World’s first triple-blade razor, taking shaving performance to a new level Sensor 1990 The first razor with spring-mounted blades for increased closeness and comfort Atra 1977 The first razor with a pivoting head to hug the contours of the face The Gillette innovation portfolio Every seven or eight years, Gillette launches an entirely new platform, such as Gillette Fusion, that sets a new standard for the brand and for the category. We enhance product performance and brand equity between these disruptive innovations with meaningful product and design initiatives every 12 to 18 months. In addition, we maintain a steady pace of commercial innovation. This mix keeps brands like Gillette growing year after year, often for decades.
  • 27.
    Fusion Phantom 2007 Fusion razor featuringa new sleek, black design Fusion Phenom 2008 New razor color leveraging “Gillette Champions” commercial innovation Champions 2008 New marketing campaign featuring three of the world’s top athletes r nitro azor high- e vehicles Disruptive Innovation Sustaining Innovation Commercial Innovation Fusion / Fusion Power 2006 First five-blade shaving system with unique trimmer blade, setting a new standard for shaving closeness and comfort The Procter Gamble Company 24
  • 28.
    LEAD 26 The Procter Gamble Company
  • 29.
    D NG INNOVATION PG peopleand PG brands are the innovation leaders of the consumer products industry. PG people are innovation leaders who know how to inspire and manage innovation with creativity and discipline. The ability to lead effective innovation programs is required at PG, particularly at the general manager and president levels. PG brands — PG’s 44 largest brands — 24 that generate over $1 billion in annual sales and 20 with sales between $500 million and $1 billion — are global plat- forms for innovation. They enable us to commercialize innovation faster, more effectively and more efficiently than would be possible on smaller, less successful brands. The Procter Gamble Company 27
  • 30.
    10 16 1 3 7 6 2 4 5 8 9 11 12 17 15 22 20 13 14 18 21 19 1. Jon Moeller VicePresident and Treasurer 2. Valarie Sheppard Vice President and Comptroller 3. Keith Harrison Global Product Supply Officer 4. Mariano Martin Global Customer Business Development Officer 5. Nancy Swanson Vice President — Corporate 6. Filippo Passerini President — Global Business Services and Chief Information Officer 7. Joan Lewis Vice President — Global Consumer and Market Knowledge 8. Moheet Nagrath Global Human Resources Officer 9. Steve Jemison Chief Legal Officer and Secretary 10. Giovanni Ciserani President — Western Europe 11. Bruce Brown Chief Technology Officer 12. Claudia Kotchka Vice President — Design Innovation Strategy 13. Charlotte Otto Global External Relations Officer 14. Jim Stengel Global Marketing Officer, Retiring 15. Marc Pritchard Global Marketing Officer 16. Laurent Philippe Group President — Central Eastern Europe, Middle East Africa 17. Deb Henretta Group President — Asia 18. Daniela Riccardi President — Greater China 19. Werner Geissler Vice Chairman— Global Operations 20. Jorge Uribe President — Latin America 21. Steve Bishop President — North America 22. Jeff Schomburger President — Global Wal-Mart Team 23. Jamie Egasti President — Coffee 24. John Goodwin President — Global Snacks Pet Care 28 The Procter Gamble Company
  • 31.
    26 27 28 30 31 33 34 36 37 38 39 41 40 42 35 32 29 23 25 24 25. MelanieHealey Group President — Global Feminine Health Care 26. Rob Steele Vice Chairman — Global Health Well-Being 27. Dimitri Panayotopoulos Vice Chairman — Global Household Care 28. Charlie Pierce Group President — Global Oral Care 29. Tom Finn President — Global Health Care 30. Martin Riant Group President — Global Baby Care 31. Jorge Mesquita Group President — Global Fabric Care 32. David Taylor Group President — Global Home Care 33. Juan Pedro Hernandez President — Braun 34. Gina Drosos President — Global Personal Beauty 35. Mary Lynn Ferguson-McHugh President — Family Care 36. Mark Bertolami President — Duracell 37. Sharon Mitchell Senior Vice President —  Research Development, Global Fabric Care 38. Ed Shirley Vice Chairman — Global Beauty Grooming 39. Chip Bergh Group President — Global Personal Care 40. Chris de Lapuente Group President — Global Hair Care 41. Hartwig Langer President — Global Prestige Products 42. Robert Jongstra President — Global Professional Care (Not pictured) Ravi Chaturvedi President — Northeast Asia, Retiring Gil Cloyd Chief Technology Officer, Retiring The Procter Gamble Company 33
  • 32.
    Since the beginningof the decade, PG has more than doubled the number of brands in its portfolio thatgenerateoverabilliondollarsinannualsales —  from 10 to 24. The most recent addition to the billion-dollar brand club is Gillette Fusion, which went from launch to billion-dollar stature in just two years, the fastest in PG history. Global Beauty Grooming Billion-Dollar Brands 29 The Procter Gamble Company
  • 33.
  • 34.
    PG’s brand portfolionow includes 20 brands that generate between $500 million and $1 billion in annual sales. Combined with the billion-dollar brands, PG’s top 44 brands account for more than 85% of PG sales and 90% of profits. Global Health Well-Being $500 Million to $1 Billion
  • 35.
    The Procter Gamble Company 32
  • 36.
    Susan Arnold President —  Global BusinessUnits Bob McDonald Chief Operating Officer Ed Shirley Vice Chairman —  Global Beauty Grooming Clayt Daley, Jr. Vice Chairman and Chief Financial Officer Rob Steele Vice Chairman —  Global Health Well-Being A.G. Lafley Chairman of the Board and Chief Executive Officer Dimitri Panayotopoulos Vice Chairman —  Global Household Care Werner Geissler Vice Chairman —  Global Operations Executive Leadership From left to right: 34 The Procter Gamble Company
  • 37.
    The Procter Gamble Company 35 Financial Contents Management’s Responsibility for Financial Reporting 36 Management’s Report on Internal Control over Financial Reporting 37 Reports of Independent Registered Public Accounting Firm 37 Management’s Discussion and Analysis Overview 39 Summary of 2008 Results 42 Forward-Looking Statements 42 Results of Operations 42 Segment Results 44 Financial Condition 49 Significant Accounting Policies and Estimates 51 Other Information 54 Audited Consolidated Financial Statements Consolidated Statements of Earnings 56 Consolidated Balance Sheets 57 Consolidated Statements of Shareholders’ Equity 58 Consolidated Statements of Cash Flows 59 Notes to Consolidated Financial Statements 60
  • 38.
    36 The Procter Gamble Company Management’s Responsibility for Financial Reporting At The Procter Gamble Company, we take great pride in our long history of doing what’s right. If you analyze what’s made our company successful over the years, you may focus on our brands, our marketing strategies, our organization design and our ability to innovate. But if you really want to get at what drives our company’s success, the place to look is our people. Our people are deeply committed to our Purpose, Values and Principles. It is this commitment to doing what’s right that unites us. This commitment to doing what’s right is embodied in our financial reporting. High-quality financial reporting is our responsibility — one we execute with integrity, and within both the letter and spirit of the law. High-quality financial reporting is characterized by accuracy, objectivity and transparency. Management is responsible for maintaining an effective system of internal controls over financial reporting to deliver those characteristics in all material respects. The Board of Directors, through its Audit Committee, provides oversight. We have engaged Deloitte Touche LLP to audit our Consolidated Financial Statements, on which they have issued an unqualified opinion. Our commitment to providing timely, accurate and understandable information to investors encompasses: Communicating expectations to employees. Every employee —  from senior management on down — is required to be trained on the Company’s Worldwide Business Conduct Manual, which sets forth the Company’s commitment to conduct its business affairs with high ethical standards. Every employee is held personally accountable for compliance and is provided several means of reporting any concerns about violations of the Worldwide Business Conduct Manual, which is available on our website at www.pg.com. Maintaining a strong internal control environment. Our system of internal controls includes written policies and procedures, segregation of duties and the careful selection and development of employees. The system is designed to provide reasonable assurance that transactions are executed as authorized and appropriately recorded, that assets are safeguarded and that accounting records are sufficiently reliable to permit the preparation of financial statements conforming in all material respects with accounting principles generally accepted in the United States of America. We monitor these internal controls through control self-assessments conducted by business unit management. In addition to performing financial and compliance audits around the world, including unannounced audits, our Global Internal Audit organization provides training and continuously improves internal control processes. Appropriate actions are taken by management to correct any identified control deficiencies. Executing financial stewardship. We maintain specific programs and activities to ensure that employees understand their fiduciary responsibilities to shareholders. This ongoing effort encompasses financial discipline in strategic and daily business decisions and brings particular focus to maintaining accurate financial reporting and effective controls through process improvement, skill development and oversight. Exerting rigorous oversight of the business. We continuously review business results and strategic choices. Our Global Leadership Council is actively involved — from understanding strategies to reviewing key initiatives, financial performance and control assessments. The intent is to ensure we remain objective, identify potential issues, continuously challenge each other and ensure recognition and rewards are appro- priately aligned with results. Engaging our Disclosure Committee. We maintain disclosure controls and procedures designed to ensure that information required to be disclosed is recorded, processed, summarized and reported timely and accurately. Our Disclosure Committee is a group of senior-level execu- tives responsible for evaluating disclosure implications of significant business activities and events. The Committee reports its findings to the CEO and CFO, providing an effective process to evaluate our external disclosure obligations. Encouraging strong and effective corporate governance from our Board of Directors. We have an active, capable and diligent Board that meets the required standards for independence, and we welcome the Board’s oversight. Our Audit Committee comprises independent directors with significant financial knowledge and experience. We review significant accounting policies, financial reporting and internal control matters with them and encourage their independent discussions with external auditors. Our corporate governance guidelines, as well as the charter of the Audit Committee and certain other committees of our Board, are available on our website at www.pg.com. PG has a strong history of doing what’s right. Our employees embrace our Purpose, Values and Principles. We take responsibility for the quality and accuracy of our financial reporting. We present this information proudly, with the expectation that those who use it will understand our company, recognize our commitment to performance with integrity and share our confidence in PG’s future. A.G. Lafley Clayton C. Daley, Jr. Chairman of the Board Vice Chairman and and Chief Executive Officer Chief Financial Officer
  • 39.
    The Procter Gamble Company 37 Management’s Report on Internal Control over Financial Reporting Report of Independent Registered Public Accounting Firm Management is responsible for establishing and maintaining adequate internal control over financial reporting of The Procter Gamble Company (as defined in Rule 13a-15(f) under the Securities Exchange Act of 1934, as amended). Our internal control over financial reporting is designed to provide reasonable assurance regarding the reliability of financial reporting and the preparation of financial statements for external purposes in accordance with generally accepted accounting principles in the United States of America. Strong internal controls is an objective that is reinforced through our Worldwide Business Conduct Manual, which sets forth our commit- ment to conduct business with integrity, and within both the letter and the spirit of the law. The Company’s internal control over financial reporting includes a Control Self-Assessment Program that is conducted annually by substantially all areas of the Company and is audited by the internal audit function. Management takes the appropriate action to correct any identified control deficiencies. Because of its inherent limitations, any system of internal control over financial reporting, no matter how well designed, may not prevent or detect misstatements due to the possibility that a control can be circumvented or overridden or that misstatements due to error or fraud may occur that are not detected. Also, because of changes in conditions, internal control effectiveness may vary over time. Management assessed the effectiveness of the Company’s internal control over financial reporting as of June 30, 2008, using criteria established in Internal Control — Integrated Framework issued by the Committee of Sponsoring Organizations of the Treadway Commission (COSO) and concluded that the Company maintained effective internal control over financial reporting as of June 30, 2008, based on these criteria. Deloitte Touche LLP, an independent registered public accounting firm, has audited the effectiveness of the Company’s internal control over financial reporting as of June 30, 2008, as stated in their report which is included herein. A.G. Lafley Clayton C. Daley, Jr. Chairman of the Board Vice Chairman and and Chief Executive Officer Chief Financial Officer August 12, 2008 To the Board of Directors and Shareholders of The Procter Gamble Company We have audited the accompanying Consolidated Balance Sheets of The Procter Gamble Company and subsidiaries (the “Company”) as of June 30, 2008 and 2007, and the related Consolidated Statements of Earnings, Shareholders’ Equity, and Cash Flows for each of the three years in the period ended June 30, 2008. These financial statements are the responsibility of the Company’s management. Our responsibility is to express an opinion on these financial statements based on our audits. We conducted our audits in accordance with the standards of the Public Company Accounting Oversight Board (United States). Those standards require that we plan and perform the audit to obtain reasonable assurance about whether the financial statements are free of material misstatement. An audit includes examining, on a test basis, evidence supporting the amounts and disclosures in the financial statements. An audit also includes assessing the accounting principles used and significant estimates made by management, as well as evaluating the overall financial statement presentation. We believe that our audits provide a reasonable basis for our opinion. In our opinion, such Consolidated Financial Statements present fairly, in all material respects, the financial position of the Company at June 30, 2008 and 2007, and the results of its operations and cash flows for each of the three years in the period ended June 30, 2008, in conformity with accounting principles generally accepted in the United States of America. As discussed in Note 1 to the Consolidated Financial Statements, the Company adopted the provisions of FASB Interpretation No. 48, “Accounting for Uncertainty in Income Taxes — an interpretation of FASB Statement No. 109,” effective July 1, 2007. Also, as discussed in Note 1 to the Consolidated Financial Statements, the Company adopted the provisions of SFAS No. 158, “Employers’ Accounting for Defined Benefit Pension and Other Postretirement Plans, an amendment of FASB Statements No. 87, 88, 106, and 132(R),” effective June 30, 2007. We have also audited, in accordance with the standards of the Public Company Accounting Oversight Board (United States), the Company’s internal control over financial reporting as of June 30, 2008, based on the criteria established in Internal Control — Integrated Framework issued by the Committee of Sponsoring Organizations of the Treadway Commission and our report dated August 12, 2008, expressed an unqualified opinion on the Company’s internal control over financial reporting. Cincinnati, Ohio August 12, 2008
  • 40.
    38 The Procter Gamble Company Report of Independent Registered Public Accounting Firm To the Board of Directors and Shareholders of The Procter Gamble Company We have audited the internal control over financial reporting of The Procter Gamble Company and subsidiaries (the “Company”) as of June 30, 2008, based on criteria established in Internal Control —  Integrated Framework issued by the Committee of Sponsoring Organizations of the Treadway Commission. The Company’s manage- ment is responsible for maintaining effective internal control over financial reporting and for its assessment of the effectiveness of internal control over financial reporting, included in Management’s Report on Internal Control Over Financial Reporting. Our responsibility is to express an opinion on the Company’s internal control over financial reporting based on our audit. We conducted our audit in accordance with the standards of the Public Company Accounting Oversight Board (United States). Those standards require that we plan and perform the audit to obtain reasonable assurance about whether effective internal control over financial reporting was maintained in all material respects. Our audit included obtaining an understanding of internal control over financial reporting, assessing the risk that a material weakness exists, testing and evaluating the design and operating effectiveness of internal control based on the assessed risk, and performing such other procedures as we considered necessary in the circumstances. We believe that our audit provides a reasonable basis for our opinion. A company’s internal control over financial reporting is a process designed by, or under the supervision of, the company’s principal executive and principal financial officers, or persons performing similar functions, and effected by the company’s board of directors, management, and other personnel to provide reasonable assurance regarding the reliability of financial reporting and the preparation of financial statements for external purposes in accordance with generally accepted accounting principles. A company’s internal control over financial reporting includes those policies and procedures that (1) pertain to the maintenance of records that, in reasonable detail, accurately and fairly reflect the transactions and dispositions of the assets of the company; (2) provide reasonable assurance that transactions are recorded as necessary to permit preparation of financial statements in accordance with generally accepted accounting principles, and that receipts and expenditures of the company are being made only in accordance with authorizations of management and directors of the company; and (3) provide reasonable assurance regarding prevention or timely detection of unauthorized acquisition, use, or disposition of the company’s assets that could have a material effect on the financial statements. Because of the inherent limitations of internal control over financial reporting, including the possibility of collusion or improper management override of controls, material misstatements due to error or fraud may not be prevented or detected on a timely basis. Also, projections of any evaluation of the effectiveness of the internal control over financial reporting to future periods are subject to the risk that the controls may become inadequate because of changes in conditions, or that the degree of compliance with the policies or procedures may deteriorate. In our opinion, the Company maintained, in all material respects, effective internal control over financial reporting as of June 30, 2008, based on the criteria established in Internal Control — Integrated Framework issued by the Committee of Sponsoring Organizations of the Treadway Commission. We have also audited, in accordance with the standards of the Public Company Accounting Oversight Board (United States), the Consolidated Financial Statements as of and for the year ended June 30, 2008 of the Company and our report dated August 12, 2008 expressed an unqualified opinion on those financial statements and included an explanatory paragraph regarding the Company’s adoption of the provisions of FASB Interpretation No. 48, “Accounting for Uncertainty in Income Taxes — an interpretation of FASB Statement No. 109,” effective July 1, 2007 and the Company’s adoption of the provisions of SFAS No. 158, “Employers’ Accounting for Defined Benefit Pension and Other Postretirement Plans, an amendment of FASB Statements No. 87, 88, 106, and 132(R),” effective June 30, 2007. Cincinnati, Ohio August 12, 2008
  • 41.
    The Procter Gamble Company 39 The purpose of this discussion is to provide an understanding of PG’s financial results and condition by focusing on changes in certain key measures from year to year. Management’s Discussion and Analysis (MDA) is organized in the following sections: Overview• Summary of 2008 Results• Forward-Looking Statements• Results of Operations• Segment Results• Financial Condition• Significant Accounting Policies and Estimates• Other Information• Throughout MDA, we refer to measures used by management to evaluate performance including unit volume growth, net outside sales and after-tax profit. We also refer to a number of financial measures that are not defined under accounting principles generally accepted in the United States of America (U.S. GAAP), including organic sales growth, free cash flow and free cash flow productivity. We believe these measures provide investors with important information that is useful in understanding our business results and trends. The explana- tion of these measures at the end of MDA provides more details on the use and the derivation of these measures. Management also uses certain market share and market consumption estimates to evaluate performance relative to competition despite some limitations on the availability and comparability of share information. References to market share and market consumption in MDA are based on a combination of vendor-reported consumption and market size data, as well as internal estimates. On October 1, 2005, we completed the acquisition of The Gillette Company for $53.4 billion. The Gillette acquisition ultimately resulted in the creation of Grooming, a new reportable segment, primarily consisting of Gillette’s Blades and Razors and Braun businesses. Results of Gillette’s Personal Care, Oral Care and Duracell businesses were primarily subsumed within the Beauty, the Health Care and the Fabric Care and Home Care reportable segments, respectively. Our discussion of 2007 results within MDA are in comparison to 2006 results that included the Gillette business only for the nine-month period from October 1, 2005 (the acquisition date) through June 30, 2006. We previously provided details regarding the changes to our reportable segment structure resulting from the integration of the Gillette busi- nesses (as presented in our Form 8-K filed on October 31, 2007). OVERVIEW PG’s business is focused on providing branded consumer goods products. Our goal is to provide products of superior quality and value to improve the lives of the world’s consumers. We believe this will result in leadership sales, profits and value creation, allowing employees, shareholders and the communities in which we operate to prosper. Our products are sold in more than 180 countries primarily through mass merchandisers, grocery stores, membership club stores and drug stores. We continue to expand our presence in other channels including department stores, salons and “high frequency stores,” the neighborhood stores which serve many consumers in developing markets. We have on-the-ground operations in approximately 80 countries. Our market environment is highly competitive, with global, regional and local competitors. In many of the markets and industry segments in which we sell our products, we compete against other branded products as well as retailers’ private-label brands. Additionally, many of the product segments in which we compete are differentiated by price (referred to as premium, mid-tier and value-tier products). Generally speaking, we compete with premium and mid-tier products and are well positioned in the industry segments and markets in which we operate — often holding a leadership or significant market share position. Organizational Structure Our organizational structure is comprised of three Global Business Units (GBUs) and a Global Operations group. The Global Operations group consists of the Market Development Organization (MDO) and Global Business Services (GBS). Global Business Units Our three GBUs are Beauty, Health and Well-Being, and Household Care. The primary responsibility of the GBUs is to develop the overall strategy for our brands. They identify common consumer needs, develop new product innovations and upgrades, and build our brands through effective commercial innovations, marketing and sales. Under U.S. GAAP, the business units comprising the GBUs are aggre- gated into six reportable segments: Beauty; Grooming; Health Care; Snacks, Coffee and Pet Care; Fabric Care and Home Care; and Baby Care and Family Care. The following provides additional detail on our GBUs and reportable segments and the key product and brand composition within each. Management’s Discussion and Analysis
  • 42.
    40 The Procter Gamble Company Management’s Discussion and Analysis Reportable % of % of Net GBU Segment Net Sales* Earnings* Key Products Billion-Dollar Brands Beauty Beauty 23% 22% Cosmetics, Deodorants, Hair Care, Personal Head Shoulders, Cleansing, Prestige Fragrances, Skin Care Olay, Pantene, Wella Grooming 10% 13% Blades and Razors, Electric Hair Removal Braun, Fusion, Devices, Face and Shave Products, Home Gillette, Mach3 Appliances Health and Well-Being Health Care 17% 20% Feminine Care, Oral Care, Personal Health Actonel, Always, Care, Pharmaceuticals Crest, Oral-B Snacks, Coffee 6% 4% Coffee, Pet Food, Snacks Folgers, Iams, and Pet Care Pringles Household Care Fabric Care and 28% 27% Air Care, Batteries, Dish Care, Fabric Care, Ariel, Dawn, Downy, Home Care Surface Care Duracell, Gain, Tide Baby Care and 16% 14% Baby Wipes, Bath Tissue, Diapers, Facial Bounty, Charmin, Family Care Tissue, Paper Towels Pampers * Percent of net sales and net earnings for the year ended June 30, 2008 (excluding results held in Corporate). Beauty Beauty: We are a global market leader in beauty and compete in markets which comprise approximately $230 billion in global retail sales. Most of the beauty markets in which we compete are highly fragmented with a large number of global and local competitors. We are the global market leader in hair care with over 20% of the global market share. In skin care, we compete primarily with the Olay brand, which is the top facial skin care retail brand in the world. We are also one of the global market leaders in prestige fragrances, primarily behind the Gucci, Hugo Boss and Dolce Gabbana fragrance brands. Grooming: This segment consists of blades and razors, face and shave preparation products (such as shaving cream), electric hair removal devices and small household appliances. We hold leadership market share in the manual blades and razors market on a global basis and in almost all of the geographies in which we compete. Our global manual blades and razors market share is about 70%, primarily behind Mach3, Fusion, Venus and the Gillette franchise. Our electric hair removal devices and small home appliances are sold under the Braun brand in a number of markets around the world, where we compete against both global and regional competitors. Our primary focus in this area is in electric hair removal devices, such as electric razors and epilators, where we hold over 30% and over 50% of the male and female markets, respectively. Health and Well-Being Health Care: We compete in oral care, feminine care, and pharma- ceuticals and personal health. In oral care, there are several global competitors in the market, and we have the number two market share position at approximately 20% of the global market. We are the global market leader in the feminine care category with about one-third of the global market share. In pharmaceuticals and personal health, we have approximately one-third of the global bisphosphonates market for the treatment of osteoporosis under the Actonel brand. We are the market leader in nonprescription heartburn medications and in respiratory treatments behind Prilosec OTC and Vicks, respectively. Snacks, Coffee and Pet Care: In snacks, we compete against both global and local competitors and have a global market share of approximately 10% in the potato chips market behind our Pringles brand. Our coffee business competes almost solely in North America, where we hold a leadership position with approximately one-third of the U.S. market, primarily behind our Folgers brand. We have announced plans to separate our coffee business and merge it with The J. M. Smucker Company in a transaction that is expected to close in the second quarter of fiscal 2009. In pet care, we compete in several markets around the globe in the premium pet care segment, behind the Iams and Eukanuba brands. The vast majority of our pet care business is in North America, where we have about a 10% share of the market. Household Care Fabric Care and Home Care: This segment is comprised of a variety of fabric care products, including laundry cleaning products and fabric conditioners; home care products, including dish care, surface cleaners and air fresheners; and batteries. In fabric care, we generally have the number one or number two share position in the markets in which we compete and are the global market leader, with approximately one-third of the global market share. Our global home care market share is about 20% across the categories in which we compete. In batteries, we compete primarily behind the Duracell brand and have over 40% of the global alkaline battery market share. Baby Care and Family Care: In baby care, we compete primarily in diapers, training pants and baby wipes, with over one-third of the global market share. We are the number one or number two baby care competitor in most of the key markets in which we compete, primarily behind Pampers, the Company’s largest brand, with annual net sales of approximately $8 billion. Our family care business is predominantly a North American business comprised primarily of the Bounty paper towel and Charmin toilet tissue brands, with U.S. market shares of over 40% and over 25%, respectively.
  • 43.
    Management’s Discussion andAnalysis The Procter Gamble Company 41 Global Operations Market Development Organization Our MDO is responsible for developing go-to-market plans at the local level. The MDO includes dedicated retail customer, trade channel and country-specific teams. It is organized along seven geographic regions: North America, Western Europe, Northeast Asia, Central Eastern Europe/Middle East/Africa, Latin America, ASEAN/Australia/India and Greater China. Throughout MDA, we reference business results in developing markets, which we define as the aggregate of Central Eastern Europe/Middle East/Africa, Latin America, ASEAN/Australia/ India and Greater China, and developed markets, which are comprised of North America, Western Europe and Northeast Asia. Global Business Services GBS provides technology, processes and standard data tools to enable the GBUs and the MDO to better understand the business and better serve consumers and customers. The GBS organization is responsible for providing world-class solutions at a low cost and with minimal capital investment. Strategic Focus PG is focused on strategies that we believe are right for the long-term health of the Company and will increase returns for our shareholders. The Company’s annual financial targets are: Organic sales growth of 4% to 6%. This is comprised of:• 3% to 5% pre-Gillette organic sales growth target, plus–– 1% of growth acceleration behind revenue synergies associated–– with the Gillette acquisition. Diluted net earnings per share (EPS) growth of 10% or better,• excluding the net impact of Gillette dilution. Free cash flow productivity of 90% or greater (defined as the ratio• of operating cash flow less capital expenditures to net earnings). Capital spending at or below 4% of net sales annually.–– In order to achieve these targets, we focus on our core strengths of consumer understanding, branding, innovation, go-to-market capability and global scale and scope against the following growth areas: Grow our leading brands in our biggest markets and with our• winning customers. Shift our portfolio mix to faster-growing businesses with higher• gross margins that are less asset-intensive. Grow disproportionately in developing markets and with value-• conscious consumers. To sustain consistent and reliable sales and earnings growth in line with our financial targets, we have identified four key enablers: Building a diversified and balanced portfolio of businesses,• brands and geographies to deliver consistent, reliable top- and bottom-line growth. Our portfolio of businesses provides a unique combination of stability, scale and growth. We compete primarily in 22 global product categories and are a market leader in over two-thirds of these categories. In addition, our portfolio includes 24 brands that generate over $1 billion in annual sales and 20 brands that generate between $500 million and $1 billion in annual sales. Combined, these 44 brands account for 85% or more of our sales and profits. These brands are platforms for future innovations that will drive sales growth, expand categories for retail customers and differentiate brands in the minds of consumers. Our geo- graphic portfolio includes a healthy balance of developed and developing market businesses. Approximately 40% of sales are generated from the United States, our home market, and develop- ing markets account for approximately 30% of sales. We will continue to invest to grow market sizes and share in developed regions, and will continue to expand our product range in faster- growing developing markets. Investing in innovation and core P• G capabilities and strengths to enable us to reach more of the world’s consumers with quality, affordable products. This includes expanding our presence in markets and reaching more consumers where we are underrep- resented, including value-conscious consumers. Leveraging the Company’s organizational structure to drive clear• focus, accountability and improved go-to-market capability. We have an organizational structure that works together to leverage our knowledge and scale at the global level with a deep understand- ing of the consumer and customer at the local level. The GBU organizations leverage their consumer understanding to–– develop the overall strategy for our brands. They identify common consumer needs, develop new products and build our brands through effective marketing innovations and product upgrades. The GBU is focused on winning the “second moment of truth” —  when the consumer uses the product and evaluates how well the product meets his or her expectations. The MDO develops go-to-market plans at the local level, leverag-–– ing their understanding of the local consumers and customers. The MDO is focused on winning the “first moment of truth” —  when a consumer stands in front of the shelf and chooses a product from among many competitive offerings. Global Business Services operates as the “back office” for the GBUs–– and the MDO, providing cost-effective world-class technology, processes and standard data tools to better understand the busi- ness and better serve consumers and customers. GBS personnel, or highly efficient and effective third-party partners, provide these services. Focusing on cost improvement and cash productivity. • Each organization is evaluated on its ability to support the Company’s financial goals and increase total shareholder return. This includes an evaluation of net sales growth, earnings growth, profit margin expansion and cash productivity. Our organizations are evaluated on their ability to generate cash, for example, by increasing produc- tivity, improving capacity utilization, meeting capital spending targets and reducing working capital required to run the business.
  • 44.
    42 The Procter Gamble Company Management’s Discussion and Analysis SUMMARY OF 2008 RESULTS For the fiscal year ended June 30, 2008, we delivered our seventh consecutive year of sales growth and free cash flow productivity at or above our stated targets. Net sales increased 9% to $83.5 billion.• Organic sales, which exclude the impacts of acquisitions, divestitures–– and foreign exchange, increased 5%, in line with our post-Gillette organic sales growth target range of 4% to 6%. Every reportable segment delivered year-on-year organic sales–– growth. Diluted net earnings per share increased 20% to $3.64.• Earnings per share grew behind 11% operating profit growth.–– Cash flow from operating activities was $15.8 billion.• Free cash flow productivity was 106%, ahead of our 90% target.–– Forward-Looking Statements We discuss expectations regarding future performance, events and outcomes, such as our business outlook and objectives, in annual and quarterly reports, press releases and other written and oral communi- cations. All such statements, except for historical and present factual information, are “forward-looking statements,” and are based on financial data and our business plans available only as of the time the statements are made, which may become out-of-date or incomplete. We assume no obligation to update any forward-looking statements as a result of new information, future events or other factors. Forward-looking statements are inherently uncertain and investors must recognize that events could be significantly different from our expectations. Ability to Achieve Business Plans. We are a consumer products company and rely on continued demand for our brands and products. To achieve business goals, we must develop and sell products that appeal to consumers and retail trade customers. Our continued success is dependent on leading-edge innovation with respect to both products and operations and on the continued positive reputations of our brands. This means we must be able to obtain patents and respond to technological advances and patents granted to competition. Our success is also dependent on effective sales, advertising and marketing programs in an increasingly fragmented media environment. Our ability to innovate and execute in these areas will determine the extent to which we are able to grow existing sales and volume profitably, especially with respect to the product categories and geographic markets (including developing markets) in which we have chosen to focus. There are high levels of competitive activity in the environments in which we operate. To address these challenges, we must respond to competitive factors, including pricing, promotional incentives, trade terms and product initiatives. We must manage each of these factors, as well as maintain mutually beneficial relationships with our key customers, in order to effectively compete and achieve our business plans. Since our goals include a growth component tied to acquisitions, we must manage and integrate key acquisitions, such as the Gillette and Wella acquisitions, including achieving the cost and growth synergies in accordance with stated goals. Cost Pressures. Our costs are subject to fluctuations, particularly due to changes in commodity prices, raw materials, cost of labor, foreign exchange and interest rates. Therefore, our success is dependent, in part, on our continued ability to manage these fluctuations through pricing actions, cost savings projects, sourcing decisions and certain hedging transactions. We also must manage our debt and currency exposure, especially in volatile countries. We need to maintain key manufacturing and supply arrangements, including sole supplier and sole manufacturing plant arrangements. We must implement, achieve and sustain cost improvement plans, including our outsourcing projects and those related to general overhead and workforce rationalization. Global Economic Conditions. Economic changes, terrorist activity and political unrest may result in business interruption, inflation, deflation or decreased demand for our products. Our success will depend, in part, on our ability to manage continued global political and/or economic uncertainty, especially in our significant geographic markets, as well as any political or economic disruption due to terrorist and other hostile activities. Regulatory Environment. Changes in laws, regulations and the related interpretations may alter the environment in which we do business. This includes changes in environmental, competitive and product- related laws, as well as changes in accounting standards and taxation requirements. Our ability to manage regulatory, tax and legal matters (including product liability, patent, intellectual property and competition law matters) and to resolve pending legal matters within current estimates may impact our results. RESULTS OF OPERATIONS Net Sales Net sales increased 9% in 2008 to $83.5 billion behind 4% unit volume growth, a favorable 5% foreign exchange impact and a positive 1% pricing impact. Favorable foreign exchange resulted primarily from the strengthening of European and other currencies relative to the U.S. dollar. Price increases were taken across a number of our businesses primarily to offset higher commodity costs. Mix had a negative 1% impact on net sales primarily due to disproportionate growth in developing regions, where selling prices are below the Company average. Each reportable segment posted year-on-year volume growth, with mid-single-digit growth in Fabric Care and Home Care, Baby Care and Family Care, Grooming and Health Care and low-single-digit growth in Beauty and Snacks, Coffee and Pet Care. Each geographic region posted year-on-year volume growth except Western Europe, which was down low-single digits due to the impact of divestitures. Excluding the impact of acquisitions and divestitures, every geographic region delivered year-on-year volume growth. Volume grew primarily behind initiative activity on key brands and continued double-digit growth in developing regions. Organic sales increased 5% behind organic volume growth of 5%, which excludes the impact of acquisi- tions and divestitures. Each reportable segment posted year-on-year organic sales and organic volume growth.
  • 45.
    Management’s Discussion andAnalysis The Procter Gamble Company 43 Net sales increased 12% in 2007 to $76.5 billion. Sales were up behind 9% unit volume growth, including the impact of an extra three months of Gillette results in 2007. Organic volume increased 5%. Developing regions continued to lead the growth with double-digit increases for the year. All reportable segments increased organic volume for the year except the Snacks, Coffee and Pet Care segment. Higher pricing, primarily in coffee and Health Care, contributed 1% to sales growth. Product mix had no net impact on sales as a more premium product mix driven by the additional three months of Gillette results in 2007 was offset by the negative mix impact of disproportionate growth in developing markets, where the average unit sales price is lower than the Company average. Favorable foreign exchange contributed 2% to net sales growth. Organic sales increased 5% versus 2006 with each reportable segment posting year-on-year growth. Operating Costs Gross margin was down 70 basis points in 2008 to 51.3% of net sales. Commodity and energy cost increases had a negative impact on gross margin of about 200 basis points. These were largely offset by the benefits of scale leverage from volume growth and cost savings projects resulting from manufacturing efficiency improvements and product reformulations. Gross margin was 52.0% in 2007, an increase of 60 basis points versus the prior year. Higher commodity and energy costs had a negative impact of approximately 60 basis points on gross margin. These were more than offset by scale leverage from organic volume growth, higher pricing and cost savings projects. The additional three months of the Gillette business in 2007, which has a higher gross margin than the base PG business, drove additional gross margin improvement of approxi- mately 30 basis points. Total selling, general and administrative expenses (SGA) increased 6% to $25.7 billion in 2008. The increase was driven by higher overhead and marketing spending to support business growth. SGA as a percentage of net sales was down 100 basis points. Overhead spending was down as a percentage of net sales for the total Company and for each reportable segment primarily due to volume scale leverage, a focus on overhead productivity and incremental synergy savings from the Gillette acquisition. Marketing spending as a percentage of net sales was in line with previous year levels. SGA in 2007 increased 11%, or $2.5 billion, to $24.3 billion. SGA increased primarily due to the additional three months of Gillette in 2007 and to support business growth, partially offset by overhead and media purchasing synergies from the Gillette integration. The additional three months of Gillette in 2007 accounted for approximately $1.1 billion of the increase, including approximately $160 million of incremental acquisition-related expenses. The incremental acquisition- related expenses were comprised of three additional months of intangible asset amortization resulting from revaluing intangible assets in the opening balance sheet of the acquired Gillette business, costs to restructure the business post-acquisition and other integration-related expenses. SGA as a percentage of net sales was 31.8% in 2007, an improvement of 20 basis points versus 2006. Overhead expenses as a percentage of net sales were down due to volume scale leverage, overhead cost control and synergies from the Gillette integration. Marketing spending as a percentage of net sales in 2007 was roughly in line with prior year levels despite media purchasing synergies gener- ated by the Gillette acquisition and a continued focus on marketing return-on-investment (ROI) programs. Basis Point Basis Point Comparisons as a percentage of net sales; Years ended June 30 2008 Change 2007 Change 2006 Gross margin 51.3% (70) 52.0% 60 51.4% Selling, general and administrative 30.8% (100) 31.8% (20) 32.0% Operating margin 20.5% 30 20.2% 80 19.4% Earnings before income taxes 19.3% 10 19.2% 100 18.2% Net earnings 14.5% 100 13.5% 80 12.7%
  • 46.
    44 The Procter Gamble Company Management’s Discussion and Analysis Non-Operating Items Non-operating items primarily include interest expense, divestiture gains and interest and investment income. Interest expense increased 13% to $1.5 billion in 2008 driven by a higher interest rate on our long-term borrowings and a higher debt level to fund the Company’s previously announced share repurchase program. Under this share repurchase program, which began in July 2007, we plan to repurchase between $24 – $30 billion of PG stock over a three-year period. In 2007, interest expense increased 17% to $1.3 billion due to the financing costs associated with the debt issued to fund the share repurchase program executed in conjunction with the acquisition of Gillette in October 2005. The repurchase program associated with Gillette was completed in July 2006. Other non-operating income in 2008 decreased $102 million versus the prior year period primarily due to lower current period interest income. Interest income declined in 2008 primarily due to lower interest rates and cash balances. Divestiture gains on the sale of minor brands in 2008 were in line with previous year levels. Other non-operating income increased $281 million in 2007 to $564 million primarily due to higher divestiture gains in 2007. Our tax rate declined in 2008 from 29.7% to 24.9%. Approximately 3 percentage points of this decline was due to discrete adjustments to reserves for previously existing uncertain tax positions in the U.S. and other countries. The balance of the decline was primarily driven by a more favorable geographic mix of earnings and a reduction in the German statutory tax rate, which reduced our deferred tax liabilities related to acquired intangible assets. Our effective tax rate in 2007 was down 30 basis points versus 2006 primarily due to a more favor- able country mix impact in 2007, partially offset by higher levels of reserve releases in 2006. Net Earnings Net earnings increased 17% to $12.1 billion in 2008 behind sales growth and a 100-basis point improvement in net earnings margin. Net earnings margin increased due to lower SGA as a percentage of net sales and a lower tax rate, which more than offset lower gross margin. Net earnings in 2007 increased 19% to $10.3 billion behind sales growth, including the additional three months of Gillette results and earnings margin expansion. Net earnings margin expanded 80 basis points primarily behind gross margin improvement. Diluted net earnings per share in 2008 were up 20% versus the prior year to $3.64 per share. Diluted net earnings per share growth exceeded net earnings growth due to share repurchase activity. We repurchased $10 billion of treasury shares in 2008 under a previ- ously announced share buyback program that started in July 2007. Gillette was modestly accretive to our earnings per share results in 2008, compared to dilution of approximately $0.10 – $0.12 per share in 2007. The elimination of Gillette dilution on our earnings per share drove approximately 4 percentage points of earnings per share growth in 2008. Diluted net earnings per share in 2007 increased 15% to $3.04 primarily behind earnings growth, partially offset by the impact of a net increase in the weighted average shares outstanding in 2007 versus 2006 resulting from the incremental shares issued in conjunction with the Gillette acquisition on October 1, 2005. SEGMENT RESULTS Results for the segments reflect information on the same basis we use for internal management reporting and performance evaluation. Within the Beauty GBU, we provide data for the Beauty and the Grooming reportable segments. In the Health and Well-Being GBU, we provide data for the Health Care and the Snacks, Coffee and Pet Care reportable segments. In the Household Care GBU, we provide data for the Fabric Care and Home Care and the Baby Care and Family Care reportable segments. The results of these reportable business segments do not include certain non-business unit specific costs such as interest expense, investing activities and certain restructuring costs. These costs are reported in our Corporate segment and are included as part of our Corporate segment discussion. Additionally, as described in Note 12 to the Consolidated Financial Statements, we have investments in certain companies over which we exert significant influence, but do not control the financial and operating decisions and, therefore, do not consolidate them (“unconsolidated entities”). Since certain of these investments are managed as integral parts of the Company’s business units, they are accounted for as if they were consolidated subsidiaries for management and segment reporting purposes. This means pretax earnings in the business units include 100% of each pretax income statement component. In determining after-tax earnings in the business units, we eliminate the share of earnings applicable to other ownership interests, in a manner similar to minority interest, and apply the statutory tax rates. Eliminations to adjust each line item to U.S. GAAP are included in our Corporate segment. Beauty Beauty Change vs. Change vs. (in millions of dollars) 2008 Prior Year 2007 Prior Year* Volume n/a +2% n/a +4% Net sales $19,515 +9% $17,889 +7% Net earnings $  2,730 +5% $  2,611 +8% * The Gillette business was acquired on October 1, 2005. Therefore, the fiscal 2007 growth rates are versus a base period that included only 9 months of Gillette Beauty results (e.g., deodorants products). Beauty net sales increased 9% in 2008 to $19.5 billion behind 2% volume growth and 6% of favorable foreign exchange. Favorable product mix had a positive 1% impact on net sales primarily due to stronger growth in skin care and prestige fragrances, which have
  • 47.
    Management’s Discussion andAnalysis The Procter Gamble Company 45 higher than segment average unit selling prices. This more than offset the impact of disproportionate growth in developing regions, which have lower selling prices than the segment average. Skin care volume was up mid-single digits driven by growth on Olay behind the Definity and Regenerist initiatives. Our global skin care market share was up slightly, driven primarily by about a 1 point increase in our U.S. market share. Prestige fragrances volume was up low-single digits and organic volume was up high-single digits behind new product launches on Dolce Gabbana and Hugo Boss. Retail hair care volume was up mid-single digits, led by high-single-digit growth in developing markets. Retail hair care volume in developed regions was flat as a double-digit volume increase on Head Shoulders was offset by a double-digit volume decline on Pantene in North America. Hair color volume increased low-single digits as growth on Nice ‘N Easy behind the Perfect 10 launch more than offset declines on other color brands. Professional hair care volume declined mid-single digits as growth from color was more than offset by declines in care and styling. Overall, global hair care market share was in line with the prior year level. Volume in deodorants was down low-single digits primarily due to competitive activity and market softness in Western Europe. Net earnings in Beauty increased 5% to $2.7 billion in 2008 as the impact of higher sales was partially offset by a lower net earnings margin. Net earnings margin was down 60-basis points as lower gross margin and the impact of base period divestiture gains on minor brands more than offset the benefit of a lower tax rate due to geographic mix. Gross margin was down due to higher commodity costs, which more than offset the benefit of increased volume scale leverage and manufacturing cost savings projects. SGA increased slightly as higher marketing spending as a percentage of net sales was partially offset by lower overhead spending as a percentage of net sales. In 2007, Beauty net sales increased 7% to $17.9 billion behind 4% unit volume growth. Volume growth was driven by initiative activity across categories and continued expansion in developing regions, where volume increased high-single digits. Prestige fragrances volume was up double-digits behind The One, Boss Selection and Boss Femme fragrance initiatives and the addition of Dolce Gabbana. Skin care volume was up high-single digits behind the Olay Definity and Regenerist product initiatives. Hair care volume grew mid-single digits as a result of product initiatives on Pantene, Head Shoulders and Herbal Essences and continued expansion in developing regions. Beauty sales benefited from a 1% positive mix impact primarily due to disproportionate growth in prestige fragrances, which has a higher than segment average unit selling price. This was offset by higher levels of promotional activity, which resulted in a negative 1% pricing impact. Favorable foreign exchange contributed 3% to net sales. Net earnings increased 8% in 2007 to $2.6 billion primarily behind net sales growth. Earnings margin increased 15 basis points primarily due to lower SGA as a percentage of net sales and divestiture gains on several minor Beauty brands, partially offset by the negative mix impact from lower SK-II shipments. SGA improved as higher marketing spending as a percentage of net sales to support initiative activity was more than offset by lower overhead expenses as a percentage of net sales resulting from the benefit of volume scale leverage and Gillette- related synergy savings. SK-II shipments were down in 2007 due to the sales disruption in Asia resulting from the voluntary temporary suspension of SK-II shipments in China early in the 2007 fiscal year. Grooming Change vs. Change vs. (in millions of dollars) 2008 Prior Year 2007 Prior Year* Volume n/a +5% n/a +36% Net sales $8,254 +11% $7,437 +45% Net earnings $1,679 +21% $1,383 +63% * The Gillette business was acquired on October 1, 2005. Therefore, the fiscal 2007 growth rates are versus a base period that included only 9 months of Gillette Grooming results. Grooming net sales increased 11% to $8.3 billion in 2008. Net sales were up behind 5% volume growth, a 7% favorable foreign exchange impact and a 2% positive pricing impact driven by price increases on premium shaving systems. Product mix had a negative 3% impact on net sales as positive product mix from growth on the premium-priced Fusion brand was more than offset by the impact of disproportionate growth in developing regions, where selling prices are below the segment average. Blades and razors volume increased high-single digits behind double-digit growth in developing regions driven primarily by Volume Volume with Excluding Acquisitions Acquisitions Foreign Net Sales Net Sales Change Drivers vs. Year Ago (2008 vs. 2007) Divestitures Divestitures Exchange Price Mix/Other Growth Beauty Beauty 2% 3% 6% 0% 1% 9% Grooming 5% 6% 7% 2% -3% 11% Health and Well-Being Health Care 4% 4% 5% 1% -1% 9% Snacks, Coffee and Pet Care 2% 2% 3% 3% -1% 7% Household Care Fabric Care and Home Care 6% 6% 5% 1% -1% 11% Baby Care and Family Care 4% 8% 4% 1% 0% 9% Total Company 4% 5% 5% 1% -1% 9% Sales percentage changes are approximations based on quantitative formulas that are consistently applied.
  • 48.
    46 The Procter Gamble Company Management’s Discussion and Analysis Fusion expansion and Prestobarba3 launch. In developed regions, blades and razors volume was down low-single digits as double-digit growth on Fusion was more than offset by lower shipments of legacy shaving systems. Fusion delivered more than $1 billion in net sales for 2008, making it the Company’s 24th billion-dollar brand. Braun volume was down mid-single digits primarily due to supply constraints at a contract manufacturer, the announced exits of certain appliance businesses and the divestiture of the thermometer and blood pressure devices business. Net earnings in Grooming were up 21% in 2008 to $1.7 billion behind net sales growth and a 170-basis point earnings margin expansion. Earnings margin improved behind lower SGA as a percentage of net sales, partially offset by a reduction in gross margin. Gross margin declined due to higher costs incurred at a contract manufacturer on the Braun home appliance business, which more than offset benefits from higher pricing and volume scale leverage. SGA as a percentage of net sales was down primarily due to lower overhead spending driven largely by synergies from the integration of Gillette into PG’s infrastructure. In 2007, net sales in Grooming increased 45% to $7.4 billion on 36% unit volume growth, including the impact of the extra three months of Gillette results in fiscal 2007. Organic sales increased 6% during the year, with organic volume up 2%. Blades and razors organic volume was up mid-single digits primarily behind the continued expansion of the Fusion razor system and growth of Mach3 in countries where Fusion has not yet launched. Fusion was launched in North America in fiscal 2006 and expanded into other markets including Western Europe in fiscal 2007. In Braun, organic volume was down low-single digits as the impact of the launches of 360 Complete and Contour razors in North America and Pulsonic razors in Germany and Japan were more than offset by lower volume on household appliances in Europe. Favorable product mix, primarily behind the launch of the premium Fusion razors, contributed 3% to net sales. Price increases taken across most shaving systems added an additional 2% to net sales and favorable foreign exchange added an additional 4%. Net earnings increased 63% in 2007 to $1.4 billion. The extra three months of Gillette results in fiscal 2007 contributed 46% of the total earnings growth. The remaining growth was due to organic sales growth and integration-driven synergy savings, partially offset by higher marketing investment behind Fusion and incremental acquisition- related charges. We incurred approximately $40 million of incremental acquisition-related charges in fiscal 2007. The incremental acquisition- related charges are primarily comprised of amortization charges from revaluing intangible assets in the opening balance sheet, partially offset by base period product costs related to revaluing Gillette’s opening inventory balance. Amortization charges were higher in fiscal 2007 due to the extra three months of Gillette results in the period. Health and Well-Being Health Care Change vs. Change vs. (in millions of dollars) 2008 Prior Year 2007 Prior Year* Volume n/a +4% n/a +8% Net sales $14,578 +9% $13,381 +13% Net earnings $  2,506 +12% $  2,233 +22% * The Gillette business was acquired on October 1, 2005. Therefore, the fiscal 2007 growth rates are versus a base period that included only 9 months of Gillette Health Care results (e.g., Oral-B). Health Care net sales increased 9% in 2008 to $14.6 billion behind a 4% increase in unit volume. Foreign exchange had a positive 5% impact on net sales and price increases added 1% to net sales. Disproportionate growth in developing regions, which have selling prices below the segment average, resulted in a negative 1% mix impact. Feminine care volume increased mid-single digits and organic volume was up high-single digits behind double-digit growth on Naturella and high-single digit growth on Always, which more than offset a low-single digit decline on Tampax. Our global feminine care market share increased slightly in 2008 to about 38%. Oral care volume was up mid-single digits behind initiative-driven growth on Oral-B toothbrushes and Crest. U.S. market share on Crest dentifrice was in line with the previous year. Volume in pharmaceuticals and personal health was up low-single digits as the impact of adding the Swiss Precision Diagnostics business was largely offset by lower shipments of Actonel, Prilosec OTC and PuR. The PuR decline was from adjustments to a Whirlpool® water filters licensing agreement. Prilosec OTC volume began to decline in the third fiscal quarter of 2008 due to the recent loss of marketplace exclusivity and the entry of competing products into the market. This is expected to continue and to have an adverse effect on the results of the Health Care seg- ment in future periods. Net earnings in Health Care were up 12% in 2008 to $2.5 billion due to higher net sales and a 50-basis point improvement in net earnings margin. Net earnings margin increased as reduced SGA as a percent- age of net sales more than offset lower gross margin. Gross margin was down due to higher commodity costs and a less profitable mix driven primarily by disproportionate growth in developing regions and lower shipments of Prilosec OTC, which more than offset the benefit of increased volume scale leverage and manufacturing cost savings. SGA improved primarily behind lower overhead spending as a percentage of net sales due to a focus on productivity improvement and Gillette synergy benefits. Health Care net sales increased 13% in 2007 to $13.4 billion behind an 8% increase in unit volume. Sales and volume were up as a result of three additional months of Gillette oral care results in fiscal 2007 and growth on the base PG business. Health Care organic sales increased 7% behind 5% organic volume growth. Oral care organic volume grew mid-single digits behind double-digit growth in develop- ing regions, high-single-digit growth on Oral-B and the launch of Crest Pro-Health toothpaste in North America. Pharmaceuticals and personal health volume increased low-single digits behind growth on
  • 49.
    Management’s Discussion andAnalysis The Procter Gamble Company 47 Prilosec OTC, partially offset by lower volume on Actonel due to strong competitive activity in the osteoporosis market. Our U.S. market share on Prilosec OTC increased about 1-point during the year. Feminine care volume was up high-single digits, led by double-digit growth in developing regions. Successful initiative activity in North America on the Always Clean and Fresh initiatives and product upgrades on Tampax Pearl more than offset the impact of strong competitive activity in Western Europe and Northeast Asia, resulting in a 1-point increase in our global feminine care market share. Pricing, primarily in pharmaceuticals and personal health, contributed 2% to segment net sales growth. A more premium product mix added an additional 1% to net sales as disproportionate growth on Crest Pro-Health in North America more than offset the negative impact from higher relative growth in developing regions. Foreign exchange had a positive 2% impact on net sales. Net earnings grew 22% to $2.2 billion in 2007 behind organic sales growth, the additional three months of Gillette oral care results and earnings margin expansion. Earnings margin increased 120 basis points behind increased gross margin on our base business and lower SGA as a percentage of net sales. SGA improved primarily due to lower overhead expenses as a percentage of net sales resulting from volume scale leverage, Gillette synergy savings and lower research and development costs in our pharmaceuticals business driven by further leveraging external RD networks and higher clinical milestone payments in the base period. Snacks, Coffee and Pet Care Change vs. Change vs. (in millions of dollars) 2008 Prior Year 2007 Prior Year Volume n/a +2% n/a +0% Net sales $4,852 +7% $4,537 +4% Net earnings $  477 0% $  477 +24% Snacks, Coffee and Pet Care net sales increased 7% to $4.9 billion in 2008. Net sales grew behind a 2% volume increase, a positive 3% price impact resulting from price increases in coffee and pet care and a 3% favorable foreign exchange impact. Product mix had a negative 1% impact on net sales from a decline in coffee volume, which has higher selling prices than the segment average. Snacks volume was up high-single digits behind the launch of Rice Infusion in Western Europe and Extreme Flavors and Pringles Stix in North America. Coffee volume declined low-single digits as growth from the launch of the Dunkin’ Donuts® line was more than offset by lower volume on the balance of the business due to higher price gaps versus branded competition and reductions in trade inventory levels ahead of an upcoming product restage. Coffee market share in the U.S. was up about 1 point versus the prior year, primarily due to favorable mix impacts from the premium-priced Dunkin’ Donuts® line. In pet care, volume was down low-single digits due to negative impacts from the voluntary wet pet food recall in the U.S. in March 2007 that contrib- uted to about a 1% decline in our U.S. market share. Net earnings in Snacks, Coffee and Pet Care were $477 million in 2008, in line with the prior year. Higher sales were offset by lower net earnings margin. Net earnings margin was down 70 basis points as lower gross margin more than offset improved SGA expenses as a percentage of net sales. Gross margin was down as higher commodity costs across the segment more than offset price increases, base period pet food recall impacts and manufacturing cost savings. SGA decreased as a percentage of net sales due to reductions in both overhead and marketing spending as a percentage of net sales. Hurricane Katrina insurance payments were received in both the current and previous fiscal years and, therefore, had minimal impact on the segment’s year-on-year net earnings growth rate. We previously announced plans to separate our coffee business into a separate operating company. In June 2008, we announced an agreement with The J. M. Smucker Company to merge the separated coffee company into The J. M. Smucker Company in an all-stock reverse Morris Trust transaction. We expect the transaction to close in the second quarter of fiscal 2009. The coffee business comprised $1.8 billion of net sales in 2008. Snacks, Coffee and Pet Care net sales increased 4% in 2007 to $4.5 billion. Unit volume was in line with the prior year as growth in coffee was offset by a decline in pet care. Snacks volume was in line with the prior year. Coffee volume was up high-single digits primarily due to a low base period that included a reduction in the coffee business from Hurricane Katrina and 2007 volume from the launches of Folgers Simply Smooth and Gourmet Selections. Pet care volume was down mid-single digits versus the year-ago period due to strong competitive activity and the impacts of a voluntary recall. In March 2007, we voluntarily recalled certain Iams and Eukanuba wet pet foods to help ensure maximum pet safety following the discovery of contaminated materials at a pet food supplier. Price increases in coffee and favorable product mix from disproportionate coffee growth each had a positive 1% impact on net sales. Foreign exchange had a positive 2% impact on net sales. Net earnings in 2007 increased 24% to $477 million. Earnings increased behind sales growth and a base period comparison that included costs related to Hurricane Katrina, which more than offset a decline in 2007 gross margin from the impacts of higher commodity costs and expenses associated with the pet food recall. Household Care Fabric Care and Home Care Change vs. Change vs. (in millions of dollars) 2008 Prior Year 2007 Prior Year* Volume n/a +6% n/a +10% Net sales $23,831 +11% $21,469 +13% Net earnings $  3,422 +9% $  3,127 +20% * The Gillette business was acquired on October 1, 2005. Therefore, the fiscal 2007 growth rates are versus a base period that included only 9 months of Gillette Fabric Care and Home Care results (e.g., batteries). Fabric Care and Home Care net sales in 2008 increased 11% to $23.8 billion. Volume was up 6%, price increases added 1% and favorable foreign exchange added 5% to net sales growth. This was partially offset by a negative 1% mix impact primarily from dispro- portionate growth in developing regions and a shift toward large sizes in fabric care, both of which have selling prices below the segment
  • 50.
    48 The Procter Gamble Company Management’s Discussion and Analysis average. Fabric care volume increased mid-single digits behind high- single-digit growth in developing regions and mid-single-digit growth in developed regions. Growth was driven by the liquid laundry detergent compaction launch in North America and initiative activity on Tide, Gain, Ariel and Downy. Home care volume was up mid-single digits due to double-digit growth in developing regions and high-teens growth on Febreze from the launch of Febreze Candles. Batteries volume was up mid-single digits behind double-digit growth in developing regions and mid-single-digit growth in developed regions. Net earnings in Fabric Care and Home Care increased 9% to $3.4 billion in 2008 primarily behind higher net sales. Net earnings margin was down 20 basis points primarily due to lower gross margin, partially offset by a reduction in SGA as a percentage of net sales. Gross margin was down due to higher commodity costs, which more than offset benefits from pricing, increased volume scale leverage and manufacturing cost savings projects. SGA improved as a percentage of net sales due to lower overhead spending as a percentage of net sales resulting from a focus on overhead productivity improvements. Fabric Care and Home Care net sales increased 13% in 2007 to $21.5 billion. Sales growth was driven by a 10% increase in volume and a 3% favorable foreign exchange impact. The extra three months of batteries results in fiscal 2007 contributed 3% to the segment’s sales growth and 2% to segment volume growth. Volume was up high-single digits in both fabric care and home care led by double- digit growth in developing regions. In developed regions, fabric care volume grew mid-single digits and home care volume grew high- single digits behind product initiatives such as Tide Simple Pleasures, Gain Joyful Expressions, Febreze Noticeables, upgrades on Swiffer and the launch of Fairy auto-dishwashing in Western Europe. Our market share in both fabric care and home care increased by about 1 point globally during the year. In batteries, organic volume increased mid- single digits behind high-single-digit developing region growth from expanded distribution in high-frequency stores in Latin America. Net earnings in 2007 were up 20% to $3.1 billion behind organic sales growth, the additional three months of batteries results and an 80-basis point improvement in net earnings margin. Earnings margin improved behind higher gross margin and lower SGA as a percentage of net sales. The gross margin improvement was driven by scale benefits of volume growth and cost savings projects that more than offset higher commodity costs. SGA improved primarily behind lower overhead expenses as a percentage of net sales resulting from volume scale leverage and Gillette synergy savings. Baby Care and Family Care Change vs. Change vs. (in millions of dollars) 2008 Prior Year 2007 Prior Year Volume n/a +4% n/a +5% Net sales $13,898 +9% $12,726 +6% Net earnings $  1,728 +20% $  1,440 +11% Baby Care and Family Care net sales increased 9% in 2008 to $13.9 billion. Volume was up 4%, including the impact of the Western European family care divestiture. Price increases contributed 1% to net sales and foreign exchange had a positive 4% impact on net sales. Organic volume and organic sales, which exclude the impacts of the Western European family care divestiture and foreign ex- change, both grew 8%. Organic volume growth was balanced across the segment with high-single-digit growth in both baby care and family care. Baby care volume in developed regions was up mid-single digits behind growth on the Pampers Baby Stages of Development and on the Baby Dry Caterpillar Flex initiative. In developing regions, baby care volume was up double-digits behind continued growth on Pampers. Baby care market share in the U.S. was up nearly 1 point to about 29%. Family care volume was down low-single digits due to the divestiture of the Western European family care business but was up high-single digits on an organic basis behind the Bounty and Charmin product restages. U.S. market share on both Bounty and Charmin was up over 1 point to about 45% and 28%, respectively. Net earnings in Baby Care and Family Care were up 20% to $1.7 billion in 2008 behind higher net sales and earnings margin expansion. Net earnings margin improved 110 basis points primarily behind higher gross margin and lower SGA as a percentage of net sales. Gross margin was up due to a more profitable product mix following the Western Europe family care divestiture, the benefit of increased volume scale leverage, pricing and manufacturing cost savings projects, which more than offset higher commodity and energy costs. SGA improved as a percentage of net sales due to lower overhead spend- ing as a percentage of net sales, partially offset by higher marketing expenses as a percentage of net sales. Baby Care and Family Care net sales increased 6% in 2007 to $12.7 billion behind 5% unit volume growth. Baby care volume grew mid-single digits with developing regions up double digits. In devel- oped regions, baby care volume was up low-single digits as growth on Pampers Baby Stages of Development and Baby Dry Caterpillar Flex more than offset softness on Pampers in Western Europe and Luvs in North America from lower competitor pricing of both branded and private label products. Family care volume increased mid-single digits behind product performance upgrades on Bounty and continued growth on Bounty and Charmin Basic products. Disproportionate growth on baby care in developing regions and on the Basic tier products, which have a lower average selling price, led to a negative 1% mix impact. Favorable foreign exchange contributed 2% to sales growth. Net earnings in Baby Care and Family Care increased 11% to $1.4 billion in 2007 behind net sales growth and a 50-basis point improvement in net earnings margin. Earnings margin increased as lower SGA as a percentage of net sales more than offset a reduction in gross margin. Gross margin was down slightly as manufacturing cost savings and volume scale leverage were more than offset by the impact of higher pulp costs and a less profitable product mix. SGA improved as a percentage of net sales due to lower overhead expenses from volume scale leverage and a reduction in marketing expenses as a percentage of net sales.
  • 51.
    Management’s Discussion andAnalysis The Procter Gamble Company 49 Corporate Corporate includes certain operating and non-operating activities not allocated to specific business units. These include: the incidental businesses managed at the corporate level; financing and investing activities; other general corporate items; the historical results of certain divested brands and categories, including certain Gillette brands that were divested as required by regulatory authorities in relation to the Gillette acquisition; and certain restructuring-type activities to maintain a competitive cost structure, including manufacturing and workforce rationalization. Corporate also includes reconciling items to adjust the accounting policies used in the segments to U.S. GAAP. The most significant reconciling items include income taxes (to adjust from statu- tory rates that are reflected in the segments to the overall Company effective tax rate), adjustments for unconsolidated entities (to eliminate sales, cost of products sold and SGA for entities that are consolidated in the segments but accounted for using the equity method for U.S. GAAP) and minority interest adjustments for subsidiaries where we do not have 100% ownership. Since both unconsolidated entities and less than 100% owned subsidiaries are managed as integral parts of the Company, they are accounted for similar to a wholly owned subsidiary for management and segment purposes. This means our segment results recognize 100% of each income statement component through before-tax earnings in the segments, with eliminations for unconsolidated entities in Corporate. In determining segment after- tax net earnings, we apply the statutory tax rates (with adjustments to arrive at the Company’s effective tax rate in Corporate) and eliminate the share of earnings applicable to other ownership interests, in a manner similar to minority interest. Corporate net sales primarily reflect the adjustment to eliminate the sales of unconsolidated entities included in business unit results. Net sales decreased $462 million primarily driven by higher adjustments to eliminate the impact of joint venture net sales for unconsolidated entities that are reflected as sales in the business segments. These adjustments increased due to sales growth of existing unconsolidated entities and the addition of the Swiss Precision Diagnostics business. In 2008, net earnings in Corporate increased $464 million. The increase was driven primarily by a lower tax rate resulting from the net benefits of adjustments to reserves for uncertain tax positions. Corporate segment net earnings declined $235 million in 2007 primarily due to higher interest expenses and higher Gillette integration costs. Interest expense was up $185 million primarily due to the financing costs associated with the debt issued to fund the share repurchase program announced in conjunction with the Gillette acquisition. FINANCIAL CONDITION We believe our financial condition continues to be of high quality, as evidenced by our ability to generate substantial cash from operations and ready access to capital markets at competitive rates. Operating cash flow provides the primary source of funds to finance operating needs and capital expenditures. Excess operating cash is used first to fund shareholder dividends. Other discretionary uses include share repurchases and “tack-on” acquisitions to complement our portfolio of brands and geographies. As necessary, we may supplement operating cash flow with debt to fund these activities. The overall cash position of the Company reflects our strong business results and a global cash management strategy that takes into account liquidity management, economic factors and tax considerations. Operating Activities Operating cash flow was $15.8 billion in 2008, an increase of 18% over the prior year. Both operating cash flow and the increase in operating cash flow over the prior year resulted primarily from higher net earnings and non-cash charges (depreciation and amortization, stock-based compensation and deferred income taxes). Working capital balances increased primarily to support business growth resulting in a net use of cash. Inventory days on hand increased by 8 days primarily due to foreign exchange and higher material costs, partially offset by accounts receivable and accounts payable impacts. Accounts payable days were up 4 days due to higher material values and increased capital expenditures in the fourth quarter. Accounts receivable days were down 2 days primarily due to the harmonization of Gillette trade terms, which historically carried longer payment terms than PG. Operating cash flow in 2007 increased 18% to $13.4 billion. Operating cash flow increased as a result of higher net earnings, including the benefit of an additional three months of Gillette in 2007. Net earnings, adjusted for non-cash items (primarily depreciation and amortization, share-based compensation and deferred income taxes) was partially offset by cash used to fund working capital. Working capital increased in 2007 primarily to support business growth. Free Cash Flow. We view free cash flow as an important measure because it is one factor impacting the amount of cash available for dividends and discretionary investment. It is defined as operating cash flow less capital expenditures and is one of the measures used to evaluate senior management and determine their at-risk compensation. In 2008, free cash flow was $12.8 billion, compared to $10.5 billion in 2007. Free cash flow increased primarily as a result of higher operating cash flow. Capital expenditures increased from $2.9 billion in 2007 to $3.0 billion in 2008 representing 3.6% of net sales. Free cash flow productivity, defined as the ratio of free cash flow to net earnings, was 106% in 2008, ahead of the Company’s 90% target. In 2007, free cash flow was $10.5 billion, compared to $8.7 billion in 2006 as a result of higher operating cash flow. Free cash flow productivity was 101% in 2007.
  • 52.
    50 The Procter Gamble Company Management’s Discussion and Analysis Investing Activities Net investing activities used $2.5 billion of cash in both 2008 and 2007. Acquisitions. Acquisitions used $381 million of cash in 2008 primarily for the acquisition of Frederic Fekkai, a premium hair care brand, in Beauty. In 2007, acquisitions used $492 million of cash for several minor transactions, primarily in Beauty and Health Care, including the Swiss Precision Diagnostics business. Capital Spending. We view capital spending efficiency as a critical component of our overall cash management strategy. Capital expen- ditures in 2008 were $3.0 billion, compared to $2.9 billion in 2007. Capital spending as a percentage of net sales was 3.6% in 2008, compared to 3.9% in 2007. Proceeds from Asset Sales. Proceeds from asset sales were $928 million in 2008 primarily behind the sale of our Western Europe family care business as well as several minor Beauty and Health Care divestitures. In 2007, proceeds from asset sales were $281 million primarily due to the divestitures of Pert in North America, Sure and several non-strategic minor Beauty brands. Financing Activities Dividend Payments. Our first discretionary use of cash is dividend payments. Dividends per common share increased 13% to $1.45 per share in 2008. This increase represents the 52nd consecutive fiscal year the Company has increased its common share dividend. Total dividend payments to both common and preferred shareholders were $4.7 billion, $4.2 billion and $3.7 billion in 2008, 2007 and 2006, respectively. Long-Term and Short-Term Debt. We maintain debt levels we consider appropriate after evaluating a number of factors, including cash flow expectations, cash requirements for ongoing operations, investment and financing plans (including acquisitions and share repurchase activities) and the overall cost of capital. Total debt was $36.7 billion in 2008, $35.4 billion in 2007 and $38.1 billion in 2006. Debt increased in 2008 primarily to fund the Company’s treasury share repurchase program discussed below. The decrease in debt in 2007 was primarily due to the utilization of operating cash flow to pay down existing balances. Liquidity. Our primary source of liquidity is cash generated from operations. We believe internally generated cash flows adequately support business operations, capital expenditures and shareholder dividends, as well as a level of other discretionary cash uses (e.g., for minor acquisitions or share repurchases). We are able to supplement our liquidity needs, as required, with broad access to financing in capital markets and four bank credit facilities. Broad access to financing includes commercial paper programs in multiple markets at favorable rates given our strong credit ratings (including separate U.S. dollar and Euro multicurrency programs). We maintain four bank credit facilities: a $6 billion 364-day facility expiring in August 2008, a $6 billion 5-year facility expiring in August 2012, a $3 billion 5-year facility expiring in August 2012 and a $1.8 billion 364-day facility expiring in June 2009. The facility expiring in August 2008 is no longer needed and is not planned to be replaced. The remaining credit facilities are in place to support our ongoing commercial paper program and can be extended for certain periods of time as specified in, and in accordance with, the terms of each credit agreement. We anticipate that these facilities will remain largely undrawn for the foreseeable future. These credit facilities do not have cross-default or ratings triggers, nor do they have material adverse events clauses, except at the time of signing. In addition to these credit facilities, we have an automatically effective registration statement on Form S-3 filed with the SEC that is available for registered offerings of short- or long-term debt securities. The Company’s Moody’s and Standard Poor’s (SP) short-term credit ratings are P-1 and A-1+, respectively. Our Moody’s and SP long-term credit ratings are Aa3 with a negative outlook and AA- with a stable outlook, respectively. Treasury Purchases. Total share repurchases in 2008 were $10.0 bil- lion, nearly all of which were made under our publicly announced share repurchase plan. Under this plan, which began in July 2007, the Company expects to repurchase $24 – 30 billion of Company shares at a rate of $8 – 10 billion per year. Total share repurchases in 2007 were $5.6 billion. Guarantees and Other Off-Balance Sheet Arrangements. We do not have guarantees or other off-balance sheet financing arrangements, including variable interest entities, which we believe could have a material impact on financial condition or liquidity. Contractual Commitments. The following table provides information on our contractual commitments as of June 30, 2008.
  • 53.
    Management’s Discussion andAnalysis The Procter Gamble Company 51 Less Than After (in millions of dollars) Total 1 Year 1–3 Years 3–5 Years 5 Years Recorded liabilities Total debt $36,321 $13,063 $  5,426 $3,807 $14,025 Capital leases 407 55 90 76 186 Unrecognized tax benefit (1) 318 318 — — — Other Interest payments relating to long-term debt 13,084 1,230 1,921 1,746 8,187 Operating leases (2) 1,656 299 528 381 448 Minimum pension funding (3) 1,401 575 826 — — Purchase obligations (4) 4,326 1,205 1,662 1,096 363 Total Contractual Commitments 57,513 16,745 10,453 7,106 23,209 (1) As of June 30, 2008, the Company’s Consolidated Balance Sheet reflects a liability for unrecognized tax benefits of $3.4 billion, including $811 of interest and penalties. Due to the high degree of uncertainty regarding the timing of future cash outflows of liabilities for unrecognized tax benefits beyond one year, a reasonable estimate of the period of cash settlement for the next twelve months beyond the balance sheet date of June 30, 2008, can not be made. (2) Operating lease obligations are shown net of guaranteed sublease income. (3) Represents future pension payments to comply with local funding requirements. The projected payments beyond fiscal year 2011 are not currently determinable. (4) Primarily reflects future contractual payments under various take-or-pay arrangements entered into as part of the normal course of business. Commitments made under take-or-pay obligations represent future purchases in line with expected usage to obtain favorable pricing. Approximately 36% relates to service contracts for information technology, human resources management and facilities management activities that were outsourced in recent years. While the amounts listed represent contractual obligations, we do not believe it is likely that the full contractual amount would be paid if the underlying contracts were canceled prior to maturity. In such cases, we generally are able to negotiate new contracts or cancellation penalties, resulting in a reduced payment. The amounts do not include obligations related to other contractual purchase obligations that are not take-or-pay arrangements. Such contractual purchase obligations are primarily purchase orders at fair value that are part of normal operations and are reflected in historical operating cash flow trends. We do not believe such purchase obligations will adversely affect our liquidity position. product return allowances is recorded as a reduction of sales within the same period that the revenue is recognized. We offer sales incentives to customers and consumers through various programs, consisting primarily of customer pricing allowances, merchandising funds and consumer coupons. The cost of these programs is recognized as incurred and recorded as a reduction of sales. Given the nature of our business, revenue recognition practices do not contain estimates that materially affect results of operations. Income Taxes Our annual tax rate is determined based on our income, statutory tax rates and the tax impacts of items treated differently for tax purposes than for financial reporting purposes. Tax law requires certain items to be included in the tax return at different times than the items are reflected in the financial statements. Some of these differences are permanent, such as expenses that are not deductible in our tax return, and some differences are temporary, reversing over time, such as depreciation expense. These temporary differences create deferred tax assets and liabilities. Deferred tax assets generally represent items that can be used as a tax deduction or credit in future years for which we have already recorded the tax benefit in our income statement. Deferred tax liabilities generally represent tax expense recognized in our financial statements for which payment has been deferred, or expenditures for which we have already taken a deduction in our tax return but have not yet been recognized in our financial statements or assets recorded at fair value in business combinations for which there was no corre- sponding tax basis adjustment. SIGNIFICANT ACCOUNTING POLICIES AND ESTIMATES In preparing our financial statements in accordance with U.S. GAAP, there are certain accounting policies that are particularly important. These include revenue recognition, income taxes, certain employee benefits, acquisitions, and goodwill and intangible assets. We believe these accounting policies, and others set forth in Note 1 to the Consolidated Financial Statements, should be reviewed as they are integral to understanding the results of operations and financial condition of the Company. In the case of revenue recognition, these policies simply represent required accounting and there is minimal judgment or estimation involved. In other areas, they may represent a choice between acceptable accounting methods or may require substantial judgment or estimation in their application. Due to the nature of our business, these estimates generally are not considered highly uncertain at the time of estimation, meaning they are not expected to result in changes that would materially affect our financial condition, results of operations or cash flows in any given year. The Company has discussed the selection of significant accounting policies and the effect of estimates with the Audit Committee of the Company’s Board of Directors. Revenue Recognition Most of our revenue transactions represent sales of inventory, and we recognize revenue when title, ownership and risk of loss transfer to the customer, which can be on the date of shipment or the date of receipt by the customer. The revenue recorded is presented net of sales and other taxes we collect on behalf of governmental authorities and includes shipping and handling costs, which generally are included in the list price to the customer. A provision for payment discounts and
  • 54.
    52 The Procter Gamble Company Management’s Discussion and Analysis Inherent in determining our annual tax rate are judgments regarding business plans, planning opportunities and expectations about future outcomes. Realization of certain deferred tax assets is dependent upon generating sufficient taxable income in the appropriate jurisdiction prior to the expiration of the carry-forward periods. Although realization is not assured, management believes it is more likely than not that our deferred tax assets, net of valuation allowances, will be realized. We operate in multiple jurisdictions with complex regulatory environ- ments subject to different interpretations by the taxpayer and respective governmental taxing authorities. In certain of these jurisdictions we may take positions that management believes are supportable, but are potentially subject to successful challenge by the applicable taxing authority. We evaluate our tax positions and establish liabilities in accor- dance with Financial Accounting Standards Board Interpretation No. 48, “Accounting for Uncertainty in Income Taxes” (FIN 48). We review these tax uncertainties in light of the changing facts and circumstances, such as the progress of tax audits, and adjust them accordingly. We have a number of audits in process in various jurisdictions. Although the resolution of these tax positions is uncertain, based on currently available information, we believe that the ultimate outcomes will not have a material adverse effect on our financial position, results of operations or cash flows. Because there are a number of estimates and assumptions inherent in calculating the various components of our tax provision, certain changes or future events such as changes in tax legislation, geographic mix of earnings, completion of tax audits or earnings repatriation plans could have an impact on those estimates and our effective tax rate. Employee Benefits We sponsor various post-employment benefits throughout the world. These include pension plans, both defined contribution plans and defined benefit plans, and other post-employment benefit (OPEB) plans, consisting primarily of health care and life insurance for retirees. For accounting purposes, the defined benefit and OPEB plans require assumptions to estimate the projected and accumulated benefit obligations, including the following variables: discount rate; expected salary increases; certain employee-related factors, such as turnover, retirement age and mortality; expected return on assets and health care cost trend rates. These and other assumptions affect the annual expense and obligations recognized for the underlying plans. Our assumptions reflect our historical experiences and management’s best judgment regarding future expectations. In accordance with U.S. GAAP, the net amount by which actual results differ from our assumptions is deferred. If this net deferred amount exceeds 10% of the greater of plan assets or liabilities, a portion of the deferred amount is included in expense for the following year. The cost or benefit of plan changes, such as increasing or decreasing benefits for prior employee service (prior service cost), is deferred and included in expense on a straight- line basis over the average remaining service period of the employees expected to receive benefits. The expected return on plan assets assumption is important, since many of our defined benefit plans and our primary OPEB plan are funded. The process for setting the expected rates of return is described in Note 9 to the Consolidated Financial Statements. For 2008, the average return on assets assumption for pension plan assets and OPEB assets was 7.4% and 9.3%, respectively. A change in the rate of return of 0.5% for both pension and OPEB assets would impact annual benefit expense by less than $50 million after tax. Since pension and OPEB liabilities are measured on a discounted basis, the discount rate is a significant assumption. Discount rates used for our U.S. defined benefit and OPEB plans are based on a yield curve constructed from a portfolio of high quality bonds for which the timing and amount of cash outflows approximate the estimated payouts of the plan. For our international plans, the discount rates are set by benchmarking against investment grade corporate bonds rated AA or better. The average discount rate on the defined benefit pension plans of 6.3% represents a weighted average of local rates in countries where such plans exist. A 0.5% change in the discount rate would impact annual after-tax benefit expense by less than $50 million. The rate on the OPEB plan of 6.9% reflects the higher interest rates generally applicable in the U.S., which is where a majority of the plan participants receive benefits. A 0.5% change in the discount rate would impact annual after-tax OPEB expense by less than $10 million. Certain defined contribution pension and OPEB benefits in the U.S. are funded by the Employee Stock Ownership Plan (ESOP), as discussed in Note 9 to the Consolidated Financial Statements. Acquisitions We account for acquired businesses using the purchase method of accounting. Under the purchase method, our Consolidated Financial Statements reflect the operations of an acquired business starting from the completion of the acquisition. In addition, the assets acquired and liabilities assumed must be recorded at the date of acquisition at their respective estimated fair values, with any excess of the purchase price over the estimated fair values of the net assets acquired recorded as goodwill. Significant judgment is required in estimating the fair value of intan- gible assets and in assigning their respective useful lives. Accordingly, we typically obtain the assistance of third-party valuation specialists for significant items. The fair value estimates are based on available historical information and on future expectations and assumptions deemed reasonable by management, but are inherently uncertain. We typically use an income method to estimate the fair value of intangible assets, which is based on forecasts of the expected future cash flows attributable to the respective assets. Significant estimates and assumptions inherent in the valuations reflect a consideration of other marketplace participants, and include the amount and timing of future cash flows (including expected growth rates and profitability), the underlying product or technology life cycles, economic barriers to entry, a brand’s relative market position and the discount rate applied to the cash flows. Unanticipated market or macroeconomic events and circumstances may occur, which could affect the accuracy or validity of the estimates and assumptions.
  • 55.
    Management’s Discussion andAnalysis The Procter Gamble Company 53 Determining the useful life of an intangible asset also requires judg- ment. Certain brand intangibles are expected to have indefinite lives based on their history and our plans to continue to support and build the acquired brands. Other acquired brands are expected to have determinable useful lives. Our assessment as to brands that have an indefinite life and those that have a determinable life is based on a number of factors including competitive environment, market share, brand history, underlying product life cycles, operating plans and the macroeconomic environment of the countries in which the brands are sold. Our estimates of the useful lives of determinable-lived intangibles, primarily including brands, technologies and customer relationships, are primarily based on these same factors. All of our acquired technology and customer-related intangibles are expected to have determinable useful lives. Other significant estimates associated with the accounting for acqui- sitions include exit costs. Provided certain criteria are met, exit costs related to acquired operations are treated as assumed liabilities. If those criteria are not met, the costs are treated as operating expenses of the combined company as incurred. Exit costs, consisting primarily of severance costs, facility closure and other exit costs related to redundant manufacturing, selling, general and administrative functions, are based upon plans that have been committed to by management but which are subject to refinement. Significant estimates and assump- tions inherent in the calculation of exit costs relate to the number of employees that will be terminated, future costs to operate and eventually vacate duplicate facilities and costs to terminate agreements. These estimates and assumptions may change as we execute approved plans. Decreases to the estimated costs are generally recorded as an adjustment to goodwill. Increases to the estimates are generally recorded as an adjustment to goodwill during the purchase price allocation period (generally within one year of the acquisition date) and as operating expenses thereafter. Goodwill and Intangible Assets Acquired intangible assets may represent indefinite-lived assets (e.g., certain trademarks or brands), determinable-lived intangibles (e.g., certain trademarks or brands, customer relationships, patents and technologies) or residual goodwill. Of these, only the costs of determinable-lived intangibles are amortized to expense over their estimated life. The value of indefinite-lived intangible assets and residual goodwill is not amortized, but is tested at least annually for impairment. Our impairment testing for goodwill is performed sepa- rately from our impairment testing of indefinite-lived intangibles. We test goodwill for impairment, at least annually, by reviewing the book value compared to the fair value at the reportable unit level. We test individual indefinite-lived intangibles at least annually by reviewing the individual book values compared to the fair value. Considerable management judgment is necessary to evaluate the impact of operating and macroeconomic changes and to estimate future cash flows to measure fair value. Assumptions used in the Company’s impairment evaluations, such as forecasted growth rates and cost of capital, are consistent with internal projections and operating plans. We believe such assumptions and estimates are also comparable to those that would be used by other marketplace participants. When certain events or changes in operating conditions occur, indefinite-lived intangible assets may be reclassified to a determinable life asset and an additional impairment assessment may be performed. We did not recognize any material impairment charges for goodwill or intangible assets during the years presented. The recorded value of goodwill and intangible assets from recently acquired businesses are derived from more recent business operating plans and macroeconomic environmental conditions and therefore are more susceptible to an adverse change that could require an impair- ment charge. Indefinite-lived intangible assets totaled $27.9 billion at June 30, 2008, of which $24.7 billion represent recently acquired Gillette intangible assets. The Gillette indefinite-lived intangible assets were recorded at estimated fair values as of the acquisition date. Total goodwill is $59.8 billion at June 30, 2008, of which $38.0 billion results from the Gillette acquisition. Such goodwill reflects the residual amount from a purchase price allocation as of the acquisition date. Because the Gillette intangible and goodwill amounts represent current values as of the relatively recent acquisition date, such amounts are more susceptible to an impairment risk if business operating results or macroeconomic conditions deteriorate. New Accounting Pronouncements As more fully discussed in Notes 1 and 10 to the Consolidated Financial Statements, on July 1, 2007, we adopted FASB Interpretation No. 48, “Accounting for Uncertainty in Income Taxes — an interpretation of FASB Statement No.109” (FIN 48). FIN 48 addresses the accounting and disclosure of uncertain tax positions. FIN 48 prescribes a recognition threshold and measurement attribute for the financial statement recognition and measurement of a tax position taken or expected to be taken in a tax return. The difference between the tax benefit recognized in the financial statements for a position in accordance with FIN 48 and the tax benefit claimed in the tax return is referred to as an unrecognized tax benefit. As more fully discussed in Notes 1 and 9 to the Consolidated Financial Statements, we adopted SFAS No. 158, “Employers’ Accounting for Defined Benefit Pension and Other Postretirement Plans — an amend- ment of FASB Statements No. 87, 88, 106, and 132(R),” (SFAS 158) at June 30, 2007. SFAS 158 requires companies to recognize the over- funded and under-funded status of defined benefit pension and other postretirement plans as assets or liabilities on their balance sheets and to recognize previously unrecognized changes in that funded status, in the year in which changes occur, through other comprehensive income in shareholders’ equity. In September 2006 the FASB issued SFAS No. 157, “Fair Value Measurements” (SFAS 157). This standard defines fair value, establishes a framework for measuring fair value in generally accepted accounting principles, and expands disclosures about fair value measurements. The standard, as amended, is effective for the Company beginning July 1, 2008, for certain financial assets and liabilities and beginning July 1, 2009, for non-financial assets and liabilities recognized or disclosed at fair value on a nonrecurring basis. We believe that the adoption of SFAS 157 will not have a material effect on our financial position, results of operations or cash flows.
  • 56.
    54 The Procter Gamble Company Management’s Discussion and Analysis In December 2007, the FASB issued SFAS No. 141 (Revised), “Business Combinations” (SFAS 141(R)) and SFAS No. 160, “Noncontrolling Interests in Consolidated Financial Statements — an amendment of ARB No. 51” (SFAS 160). SFAS 141(R) and SFAS 160 revise the method of accounting for a number of aspects of business combinations and noncontrolling interests, including acquisition costs, contingencies (including contingent assets, contingent liabilities and contingent purchase price), the impacts of partial and step-acquisitions (including the valuation of net assets attributable to non-acquired minority interests), and post acquisition exit activities of acquired businesses. SFAS 141(R) and SFAS 160 will be effective for the Company during our fiscal year beginning July 1, 2009. In March 2008, the FASB issued SFAS No. 161, “Disclosures about Derivative Instruments and Hedging Activities — an amendment of FASB Statement No. 133“ (SFAS 161). SFAS 161 impacts disclosures only and will provide additional qualitative and quantitative information on the use of derivatives and their impact on an entity’s financial position, financial performance, and cash flows. SFAS 161 will be effective for the Company beginning January 1, 2009. No other new accounting pronouncement issued or effective during the fiscal year has had or is expected to have a material impact on the Consolidated Financial Statements. OTHER INFORMATION Hedging and Derivative Financial Instruments As a multinational company with diverse product offerings, we are exposed to market risks such as changes in interest rates, currency exchange rates and commodity prices. To manage the volatility related to these exposures, we evaluate our exposures on a global basis to take advantage of the direct netting opportunities and of currency, interest rate and commodity correlations that exist within the portfolio. For the remaining exposures, we enter into various derivative transactions in accordance with the Company’s hedging policies that are designed to partially, or entirely, offset changes in the underlying exposures being hedged. We do not hold or issue derivative financial instruments for speculative trading purposes. Note 6 to the Consolidated Financial Statements includes a detailed discussion of our accounting policies for financial instruments. Derivative positions are monitored using techniques including market valuation, sensitivity analysis and value-at-risk modeling. The tests for interest rate, currency rate and commodity price exposures discussed below are based on the CorporateManager™ value-at-risk model using a one-year horizon and a 95% confidence level. The model incorporates the impact of correlation (the degree to which exposures move together over time) and diversification (from holding multiple currency, commodity and interest rate instruments) and assumes that financial returns are normally distributed. Estimates of volatility and correlations of market factors are drawn from the RiskMetrics™ dataset as of June 30, 2008. In cases where data is unavailable in RiskMetrics™ , a reasonable proxy is included. Our market risk exposures relative to interest rates, currency rates and commodity prices, as discussed below, have not changed materially versus the previous reporting period. In addition, we are not aware of any facts or circumstances that would significantly impact such exposures in the near term. Interest Rate Exposure on Financial Instruments. Interest rate swaps are used to hedge exposures to interest rate movement on underlying debt obligations. Certain interest rate swaps denominated in foreign currencies are designated to hedge exposures to currency exchange rate movements on our investments in foreign operations. These currency interest rate swaps are designated as hedges of the Company’s foreign net investments. Based on our overall interest rate exposure as of and during the year ended June 30, 2008, including derivative and other instruments sensitive to interest rates, we believe a near-term change in interest rates, at a 95% confidence level based on historical interest rate movements, would not materially affect our financial statements. Currency Rate Exposure on Financial Instruments. Because we manufacture and sell products in a number of countries throughout the world, we are exposed to the impact on revenue and expenses of movements in currency exchange rates. The primary purpose of our currency hedging activities is to reduce the risk that our financial position will be adversely affected by short-term changes in exchange rates. Corporate policy prescribes the range of allowable hedging activity. We primarily use forward contracts and options with maturities of less than 18 months. In addition, we enter into certain currency swaps with maturities of up to five years to hedge our exposure to exchange rate movements on intercompany financing transactions. We also use purchased currency options with maturities of generally less than 18 months and forward contracts to hedge against the effect of exchange rate fluctuations on intercompany royalties and to offset a portion of the effect of exchange rate fluctuations on income from international operations. Based on our overall currency rate exposure as of and during the year ended June 30, 2008, we believe, at a 95% confidence level based on historical currency rate movements, the impact of a near-term change in currency rates on derivative and other instruments would not materially affect our financial statements. Commodity Price Exposure on Financial Instruments. We use raw materials that are subject to price volatility caused by weather, supply conditions, political and economic variables and other unpredictable factors. In addition to fixed price contracts, we use futures, options and swap contracts to manage the volatility related to the above exposures. Based on our overall commodity price exposure as of and during the year ended June 30, 2008, we believe, at a 95% confidence level based on historical commodity price movements, the impact of a near-term change in commodity prices on derivative and other instruments would not materially affect our financial statements.
  • 57.
    Management’s Discussion andAnalysis The Procter Gamble Company 55 Measures Not Defined By U.S. GAAP Our discussion of financial results includes several “non-GAAP” financial measures. We believe these measures provide our investors with additional information about our underlying results and trends, as well as insight to some of the metrics used to evaluate management. When used in MDA, we have provided the comparable GAAP measure in the discussion. These measures include: Organic Sales Growth. Organic sales growth measures sales growth excluding the impacts of foreign exchange, acquisitions and divestitures from year-over-year comparisons. The Company believes this provides investors with a more complete understanding of underlying results and trends by providing sales growth on a consistent basis. The following table provides a numerical reconciliation of organic sales growth to reported net sales growth for fiscal 2008: Fabric Total Snacks, Coffee Care and Baby Care and Company Beauty Grooming Health Care and Pet Care Home Care Family Care Reported net sales growth 9% 9% 11% 9% 7% 11% 9% Acquisitions divestitures impact +1% +1% 0% -1% 0% 0% +3% Foreign exchange impact -5% -6% -7% -5% -3% -5% -4% Organic sales growth 5% 4% 4% 3% 4% 6% 8% The following table provides a numerical reconciliation of organic sales growth to reported net sales growth for fiscal 2007: Total Company Grooming Health Care Reported net sales growth 12% 45% 13% Acquisitions divestitures impact -5% -35% -4% Foreign exchange impact -2% -4% -2% Organic sales growth 5% 6% 7% Free Cash Flow. Free cash flow is defined as operating cash flow less capital spending. The Company views free cash flow as an important measure because it is one factor in determining the amount of cash available for dividends and discretionary investment. Free cash flow is also one of the measures used to evaluate senior management and is a factor in determining their at-risk compensation. Free Cash Flow Productivity. Free cash flow productivity is defined as the ratio of free cash flow to net earnings. The Company’s target is to generate free cash flow at or above 90% of net earnings. Free cash flow productivity is one of the measures used to evaluate senior management and is a factor in determining their at-risk compensation. The following table provides a numerical reconciliation of free cash flow: Free Operating Capital Free Net Cash Flow Cash Flow Spending Cash Flow Earnings Productivity 2008 $15,814 $(3,046) $12,768 $12,075 106% 2007 $13,435 $(2,945) $10,490 $10,340 101%
  • 58.
    See accompanying Notesto Consolidated Financial Statements. 56 The Procter Gamble Company Consolidated Statements of Earnings Amounts in millions except per share amounts ; Years ended June 30 2008 2007 2006 Net Sales $83,503 $76,476 $68,222 Cost of products sold 40,695 36,686 33,125 Selling, general and administrative expense 25,725 24,340 21,848 Operating Income 17,083 15,450 13,249 Interest expense 1,467 1,304 1,119 Other non-operating income, net 462 564 283 Earnings Before Income Taxes 16,078 14,710 12,413 Income taxes 4,003 4,370 3,729 Net Earnings $12,075 $10,340 $  8,684 Basic Net Earnings Per Common Share $   3.86 $   3.22 $   2.79 Diluted Net Earnings Per Common Share $   3.64 $   3.04 $   2.64 Dividends Per Common Share $   1.45 $   1.28 $   1.15
  • 59.
    The Procter Gamble Company 57 See accompanying Notes to Consolidated Financial Statements. Consolidated Balance Sheets Amounts in millions; June 30 2008 2007 Current Assets Cash and cash equivalents $   3,313 $   5,354 Investment securities 228 202 Accounts receivable 6,761 6,629 Inventories Materials and supplies 2,262 1,590 Work in process 765 444 Finished goods 5,389 4,785 Total inventories 8,416 6,819 Deferred income taxes 2,012 1,727 Prepaid expenses and other current assets 3,785 3,300 Total Current Assets 24,515 24,031 Property, Plant and Equipment Buildings 7,052 6,380 Machinery and equipment 30,145 27,492 Land 889 849 Total property, plant and equipment 38,086 34,721 Accumulated depreciation (17,446) (15,181) Net Property, Plant and Equipment 20,640 19,540 Goodwill and Other Intangible Assets Goodwill 59,767 56,552 Trademarks and other intangible assets, net 34,233 33,626 Net Goodwill and Other Intangible Assets 94,000 90,178 Other Noncurrent Assets 4,837 4,265 Total Assets $143,992 $138,014 Current Liabilities Accounts payable $   6,775 $   5,710 Accrued and other liabilities 10,154 9,586 Taxes payable 945 3,382 Debt due within one year 13,084 12,039 Total Current Liabilities 30,958 30,717 Long-Term Debt 23,581 23,375 Deferred Income Taxes 11,805 12,015 Other Noncurrent Liabilities 8,154 5,147 Total Liabilities 74,498 71,254 Shareholders’ Equity Convertible Class A preferred stock, stated value $1 per share (600 shares authorized) 1,366 1,406 Non-Voting Class B preferred stock, stated value $1 per share (200 shares authorized) — — Common stock, stated value $1 per share (10,000 shares authorized; shares issued: 2008 – 4,001.8, 2007 – 3,989.7) 4,002 3,990 Additional paid-in capital 60,307 59,030 Reserve for ESOP debt retirement (1,325) (1,308) Accumulated other comprehensive income 3,746 617 Treasury stock, at cost (shares held: 2008 – 969.1, 2007 – 857.8) (47,588) (38,772) Retained earnings 48,986 41,797 Total Shareholders’ Equity 69,494 66,760 Total Liabilities and Shareholders’ Equity $143,992 $138,014
  • 60.
    See accompanying Notesto Consolidated Financial Statements. 58 The Procter Gamble Company Consolidated Statements of Shareholders’ Equity Accumulated Common Additional Reserve for Other Shares Common Preferred Paid-In ESOP Debt Comprehensive Treasury Retained Dollars in millions  / Shares in thousands Outstanding Stock Stock Capital Retirement Income Stock Earnings Total Balance June 30, 2005 2,472,934 $2,977 $1,483 $  3,030 $(1,259) $(1,566) $(17,194) $31,004 $18,475 Net earnings 8,684 8,684 Other comprehensive income: Financial statement translation 1,316 1,316 Net investment hedges, net of $472 tax (786) (786) Other, net of tax benefits 518 518 Total comprehensive income $  9,732 Dividends to shareholders: Common (3,555) (3,555) Preferred, net of tax benefits (148) (148) Treasury stock purchases (297,132) (9) (16,821) (16,830) Employee plan issuances 36,763 16 1,308 887 (319) 1,892 Preferred stock conversions 3,788 (32) 5 27 — Gillette acquisition 962,488 983 53,522 (1,134) 53,371 ESOP debt impacts (29) (29) Balance June 30, 2006 3,178,841 3,976 1,451 57,856 (1,288) (518) (34,235) 35,666 62,908 Net earnings 10,340 10,340 Other comprehensive income: Financial statement translation 2,419 2,419 Net investment hedges, net of $488 tax (835) (835) Other, net of tax benefits (116) (116) Total comprehensive income $11,808 Adjustment to initially apply SFAS 158, net of tax (333) (333) Dividends to shareholders: Common (4,048) (4,048) Preferred, net of tax benefits (161) (161) Treasury stock purchases (89,829) (5,578) (5,578) Employee plan issuances 37,824 14 1,167 1,003 2,184 Preferred stock conversions 5,110 (45) 7 38 — ESOP debt impacts (20) (20) Balance June 30, 2007 3,131,946 3,990 1,406 59,030 (1,308) 617 (38,772) 41,797 66,760 Net earnings 12,075 12,075 Other comprehensive income: Financial statement translation 6,543 6,543 Net investment hedges, net of $1,719 tax (2,951) (2,951) Other, net of tax benefits (463) (463) Total comprehensive income $15,204 Cumulative impact for adoption of FIN 48 (232) (232) Dividends to shareholders: Common (4,479) (4,479) Preferred, net of tax benefits (176) (176) Treasury stock purchases (148,121) (10,047) (10,047) Employee plan issuances 43,910 12 1,272 1,196 2,480 Preferred stock conversions 4,982 (40) 5 35 — ESOP debt impacts (17) 1 (16) Balance June 30, 2008 3,032,717 $4,002 $1,366 $60,307 $(1,325) $ 3,746 $(47,588) $48,986 $69,494
  • 61.
    The Procter Gamble Company 59 See accompanying Notes to Consolidated Financial Statements. Consolidated Statements of Cash Flows Amounts in millions; Years ended June 30 2008 2007 2006 Cash and Cash Equivalents, Beginning of Year $  5,354 $  6,693 $  6,389 Operating Activities Net earnings 12,075 10,340 8,684 Depreciation and amortization 3,166 3,130 2,627 Share-based compensation expense 555 668 585 Deferred income taxes 1,214 253 (112) Change in accounts receivable 432 (729) (524) Change in inventories (1,050) (389) 383 Change in accounts payable, accrued and other liabilities 134 (273) 230 Change in other operating assets and liabilities (1,239) (157) (508) Other 527 592 10 Total Operating Activities 15,814 13,435 11,375 Investing Activities Capital expenditures (3,046) (2,945) (2,667) Proceeds from asset sales 928 281 882 Acquisitions, net of cash acquired (381) (492) 171 Change in investment securities (50) 673 884 Total Investing Activities (2,549) (2,483) (730) Financing Activities Dividends to shareholders (4,655) (4,209) (3,703) Change in short-term debt 1,844 8,981 (8,627) Additions to long-term debt 7,088 4,758 22,545 Reductions of long-term debt (11,747) (17,929) (5,282) Impact of stock options and other 1,867 1,499 1,319 Treasury stock purchases (10,047) (5,578) (16,830) Total Financing Activities (15,650) (12,478) (10,578) Effect of Exchange Rate Changes on Cash and Cash Equivalents 344 187 237 Change in Cash and Cash Equivalents (2,041) (1,339) 304 Cash and Cash Equivalents, End of Year $  3,313 $  5,354 $6,693 Supplemental Disclosure Cash payments for: Interest $  1,373 $  1,330 $  1,045 Income taxes 3,499 4,116 2,869 Assets acquired through non-cash capital leases 13 41 363 Gillette acquisition funded by share issuance — — 53,371
  • 62.
    Amounts in millionsof dollars except per share amounts or as otherwise specified. 60 The Procter Gamble Company NOTE 1 SUMMARY OF SIGNIFICANT ACCOUNTING POLICIES Nature of Operations The Procter Gamble Company’s (the “Company,” “we” or “us”) business is focused on providing branded consumer goods products of superior quality and value. Our products are sold in more than 180 countries primarily through retail operations including mass merchandisers, grocery stores, membership club stores, drug stores, department stores, salons and high-frequency stores. We have on-the- ground operations in approximately 80 countries. Basis of Presentation The Consolidated Financial Statements include The Procter Gamble Company and its controlled subsidiaries. Intercompany transactions are eliminated. Use of Estimates Preparation of financial statements in conformity with accounting principles generally accepted in the United States of America (U.S. GAAP) requires management to make estimates and assumptions that affect the amounts reported in the Consolidated Financial Statements and accompanying disclosures. These estimates are based on management’s best knowledge of current events and actions the Company may undertake in the future. Estimates are used in accounting for, among other items, consumer and trade promotion accruals, pensions, post- employment benefits, stock options, valuation of acquired intangible assets, useful lives for depreciation and amortization, future cash flows associated with impairment testing for goodwill, indefinite-lived intangible assets and long-lived assets, deferred tax assets, uncertain income tax positions and contingencies. Actual results may ultimately differ from estimates, although management does not believe such differences would materially affect the financial statements in any individual year. Revenue Recognition Sales are recognized when revenue is realized or realizable and has been earned. Most revenue transactions represent sales of inventory. The revenue recorded is presented net of sales and other taxes we collect on behalf of governmental authorities and includes shipping and handling costs, which generally are included in the list price to the customer. Our policy is to recognize revenue when title to the product, ownership and risk of loss transfer to the customer, which can be on the date of shipment or the date of receipt by the customer. A provision for payment discounts and product return allowances is recorded as a reduction of sales in the same period that the revenue is recognized. Trade promotions, consisting primarily of customer pricing allowances, merchandising funds and consumer coupons, are offered through various programs to customers and consumers. Sales are recorded net of trade promotion spending, which is recognized as incurred, generally at the time of the sale. Most of these arrangements have terms of approximately one year. Accruals for expected payouts under these programs are included as accrued marketing and promotion in the accrued and other liabilities line item in the Consolidated Balance Sheets. Cost of Products Sold Cost of products sold is primarily comprised of direct materials and supplies consumed in the manufacture of product, as well as manu- facturing labor, depreciation expense and direct overhead expense necessary to acquire and convert the purchased materials and sup- plies into finished product. Cost of products sold also includes the cost to distribute products to customers, inbound freight costs, internal transfer costs, warehousing costs and other shipping and handling activity. Selling, General and Administrative Expense Selling, general and administrative (SGA) expense is primarily comprised of marketing expenses, selling expenses, research and development costs, administrative and other indirect overhead costs, depreciation and amortization expense on non-manufacturing assets and other miscellaneous operating items. Research and development costs are charged to expense as incurred and were $2,226 in 2008, $2,112 in 2007 and $2,075 in 2006. Advertising costs, charged to expense as incurred, include worldwide television, print, radio, internet and in-store advertising expenses and were $8,667 in 2008, $7,937 in 2007 and $7,122 in 2006. Non-advertising related components of the Company’s total marketing spending include costs associated with consumer promotions, product sampling and sales aids, all of which are included in SGA expense, as well as coupons and customer trade funds, which are recorded as reductions to net sales. Other Non-Operating Income, Net Other non-operating income, net, primarily includes divestiture gains and interest and investment income. Currency Translation Financial statements of operating subsidiaries outside the United States of America (U.S.) generally are measured using the local currency as the functional currency. Adjustments to translate those statements into U.S. dollars are recorded in other comprehensive income. Currency translation adjustments in accumulated other comprehensive income were gains of $9,484 and $2,941 at June 30, 2008 and 2007, respectively. For subsidiaries operating in highly inflationary economies, the U.S. dollar is the functional currency. Remeasurement adjustments for financial statements in highly inflationary economies and other transactional exchange gains and losses are reflected in earnings. Notes to Consolidated Financial Statements
  • 63.
    Notes to ConsolidatedFinancial Statements The Procter Gamble Company 61 Amounts in millions of dollars except per share amounts or as otherwise specified. Cash Flow Presentation The Statement of Cash Flows is prepared using the indirect method, which reconciles net earnings to cash flow from operating activities. The reconciliation adjustments include the removal of timing differences between the occurrence of operating receipts and payments and their recognition in net earnings. The adjustments also remove cash flows from operating activities arising from investing and financing activities, which are presented separately from operating activities. Cash flows from foreign currency transactions and operations are translated at an average exchange rate for the period. Cash flows from hedging activities are included in the same category as the items being hedged. Cash flows from derivative instruments designated as net investment hedges are classified as financing activities. Cash flows from other derivative instruments used to manage interest, commodity or currency exposures are classified as operating activities. Cash pay- ments related to income taxes are classified as operating activities. Cash Equivalents Highly liquid investments with remaining stated maturities of three months or less when purchased are considered cash equivalents and recorded at cost. Investments Investment securities consist of readily marketable debt and equity securities. Unrealized gains or losses are charged to earnings for invest- ments classified as trading and to shareholders’ equity for investments classified as available-for-sale. Auction rate securities are classified as other noncurrent assets with unrealized losses charged to shareholders’ equity unless an impairment is judged to be other than temporary, in which case it is charged to earnings. Investments in certain companies over which we exert significant influence, but do not control the financial and operating decisions, are accounted for as equity method investments. Other investments that are not controlled, and over which we do not have the ability to exercise significant influence, are accounted for under the cost method. Inventory Valuation Inventories are valued at the lower of cost or market value. Product- related inventories are primarily maintained on the first-in, first-out method. Minor amounts of product inventories, including certain cosmetics and commodities, are maintained on the last-in, first-out method. The cost of spare part inventories is maintained using the average cost method. Property, Plant and Equipment Property, plant and equipment is recorded at cost reduced by accu- mulated depreciation. Depreciation expense is recognized over the assets’ estimated useful lives using the straight-line method. Machinery and equipment includes office furniture and fixtures (15-year life), computer equipment and capitalized software (3- to 5-year lives) and manufacturing equipment (3- to 20-year lives). Buildings are depreci- ated over an estimated useful life of 40 years. Estimated useful lives are periodically reviewed and, when appropriate, changes are made prospectively. When certain events or changes in operating conditions occur, asset lives may be adjusted and an impairment assessment may be performed on the recoverability of the carrying amounts. Goodwill and Other Intangible Assets We have a number of acquired brands that have been determined to have indefinite lives due to the nature of our business. We evaluate a number of factors to determine whether an indefinite life is appro- priate, including the competitive environment, market share, brand history, product life cycles, operating plans and the macroeconomic environment of the countries in which the brands are sold. When certain events or changes in operating conditions occur, an impairment assessment is performed and indefinite-lived brands may be adjusted to a determinable life. Goodwill and indefinite-lived brands are not amortized, but are evaluated annually for impairment or when indicators of a potential impairment are present. Our impairment testing of goodwill is performed separately from our impairment testing of individual indefinite-lived intangibles. The annual evaluation for impairment of goodwill and indefinite-lived intangibles is based on valuation models that incorporate assumptions and internal projections of expected future cash flows and operating plans. We believe such assumptions are also comparable to those that would be used by other marketplace participants. The cost of intangible assets with determinable useful lives is amortized to reflect the pattern of economic benefits consumed, either on a straight-line or accelerated basis over the estimated periods benefited. Patents, technology and other intangibles with contractual terms are generally amortized over their respective legal or contractual lives. Customer relationships and other noncontractual intangible assets with determinable lives are amortized over periods generally ranging from 5 to 40 years. When certain events or changes in operating conditions occur, an impairment assessment is performed and lives of intangible assets with determinable lives may be adjusted. Fair Values of Financial Instruments Certain financial instruments are required to be recorded at fair value. The estimated fair values of such financial instruments (including certain debt instruments, investment securities and derivatives) have been determined using market information and valuation methodologies, primarily discounted cash flow analysis. Changes in assumptions or estimation methods could affect the fair value estimates. However, we do not believe any such changes would have a material impact on our financial condition, results of operations or cash flows. Other financial instruments, including cash equivalents, other investments and short- term debt, are recorded at cost, which approximates fair value. The fair values of long-term debt and derivative instruments are disclosed in Note 5 and Note 6, respectively.
  • 64.
    Amounts in millionsof dollars except per share amounts or as otherwise specified. 62 The Procter Gamble Company Notes to Consolidated Financial Statements New Accounting Pronouncements and Policies Other than as described below, no new accounting pronouncement issued or effective during the fiscal year has had or is expected to have a material impact on the consolidated financial statements. ADOPTION OF FIN 48, “ACCOUNTING FOR UNCERTAINTY IN INCOME TAXES — an interpretation of fasb statement no. 109” On July 1, 2007, we adopted FASB Interpretation No. 48, “Accounting for Uncertainty in Income Taxes — an interpretation of FASB statement No. 109” (FIN 48). FIN 48 addresses the accounting and disclosure of uncertain tax positions. FIN 48 prescribes a recognition threshold and measurement attribute for the financial statement recognition and measurement of a tax position taken or expected to be taken in a tax return. The difference between the tax benefit recognized in the financial statements for a position in accordance with FIN 48 and the tax benefit claimed in the tax return is referred to as an unrecognized tax benefit. The adoption of FIN 48 resulted in a decrease to retained earnings as of July 1, 2007, of $232, which was reflected as a cumulative effect of a change in accounting principle, with a corresponding increase to the net liability for unrecognized tax benefits. The impact primarily reflects the accrual of additional statutory interest and penalties as required by FIN 48, partially offset by adjustments to existing unrecog- nized tax benefits to comply with FIN 48 measurement principles. The implementation of FIN 48 also resulted in a reduction in our net tax liabilities for uncertain tax positions related to prior acquisitions accounted for under purchase accounting, resulting in an $80 decrease to goodwill. Additionally, the Company historically classified unrecog- nized tax benefits in current taxes payable. As a result of the adoption of FIN 48, unrecognized tax benefits not expected to be paid in the next 12 months were reclassified to other noncurrent liabilities on a prospective basis. The total amount of unrecognized tax benefits as of the adoption of FIN 48 at July 1, 2007, was $2,971, excluding any related accruals for interest and penalties. Included in this total was $1,893 that, if recognized, would impact the effective tax rate in future periods. We recognize accrued interest and penalties related to unrecognized tax benefits in income tax expense. Accrued interest and penalties as of July 1, 2007, were $589 and $128, respectively, on an after-tax basis. Refer to Note 10 for additional information regarding uncertain tax positions and related activity in the current year. ADOPTION OF FASB Standard 158, “EMPLOYERS’ ACCOUNTING FOR DEFINED BENEFIT PENSION AND OTHER POSTRETIREMENT PLANS — an amendment of FASB Statements No. 87, 88, 106, and 132(R)” In September 2006, the FASB issued Statement of Financial Accounting Standards (SFAS) No. 158, “Employers’ Accounting for Defined Benefit Pension and Other Postretirement Plans — an amendment of FASB Statements No. 87, 88, 106, and 132(R)” (SFAS 158). SFAS 158 requires companies to recognize the over-funded and under-funded status of defined benefit pension and other postretirement plans as assets or liabilities on their balance sheets. In addition, changes in the funded status must be recognized through other comprehensive income in shareholders’ equity in the year in which the changes occur. We adopted SFAS 158 on June 30, 2007. In accordance with the transition rules in SFAS 158, this standard was adopted on a prospec- tive basis. The adoption of SFAS 158 resulted in an adjustment to our balance sheet, but had no impact on our net earnings or cash flow, nor did it impact any debt covenants. SFAS 158 had no impact on our measurement date, which continues to be as of our fiscal year-end. Refer to Note 9 for additional information regarding our pension and postretirement plans. The following table reflects the effect of the adoption of SFAS 158 on our Consolidated Balance Sheets: Before After Application SFAS 158 Application As of June 30, 2007 of SFAS 158 Adjustments of SFAS 158 Other noncurrent assets $   4,432 $(167) $   4,265 Total assets 138,181 (167) 138,014 Deferred income taxes 12,214 (199) 12,015 Other noncurrent liabilities 4,782 365 5,147 Total liabilities 71,088 166 71,254 Accumulated other comprehensive income 950 (333) 617 Total shareholders’ equity 67,093 (333) 66,760 Total liabilities and shareholders’ equity 138,181 (167) 138,014 FASB STANDARDS 141(R), “BUSINESS COMBINATIONS,” AND 160, “NONCONTROLLING INTERESTS IN CONSOLIDATED FINANCIAL STATEMENTS — AN AMENDMENT OF ARB NO. 51” In December 2007, the FASB issued SFAS No. 141 (Revised), “Business Combinations,” (SFAS 141(R)) and SFAS No. 160, “Noncontrolling Interests in Consolidated Financial Statements — an amendment of ARB No. 51” (SFAS 160). SFAS 141(R) and SFAS 160 revise the method of accounting for a number of aspects of business combinations and noncontrolling interests, including acquisition costs, contingencies (including contingent assets, contingent liabilities and contingent purchase price), the impacts of partial and step-acquisitions (including the valuation of net assets attributable to non-acquired minority interests) and post acquisition exit activities of acquired businesses. SFAS 141(R) and SFAS 160 will be effective for the Company during our fiscal year beginning July 1, 2009. The Company believes that the adoption of SFAS 141(R) and SFAS 160 will not have a material effect on its financial position, results of operations or cash flows. FASB STANDARD 157, “FAIR VALUE MEASUREMENTS” In September 2006, the FASB issued SFAS No. 157, “Fair Value Measurements” (SFAS 157). This standard defines fair value, establishes a framework for measuring fair value in generally accepted accounting principles, and expands disclosures about fair value measurements. SFAS 157, as amended, is effective for the Company beginning July 1, 2008, for certain financial assets and liabilities and beginning July 1, 2009, for non-financial assets and liabilities recognized or disclosed at fair value on a non-recurring basis. The Company believes that the adoption of SFAS 157 will not have a material effect on its financial position, results of operations or cash flows.
  • 65.
    Notes to ConsolidatedFinancial Statements The Procter Gamble Company 63 Amounts in millions of dollars except per share amounts or as otherwise specified. FASB STANDARD 161, “DISCLOSURES ABOUT DERIVATIVE INSTRUMENTS AND HEDGING ACTIVITIES — AN AMENDMENT OF FASB statement no. 133” In March 2008, the FASB issued SFAS No. 161, “Disclosures about Derivative Instruments and Hedging Activities — An Amendment of FASB Statement No. 133” (SFAS 161). SFAS 161 impacts disclosures only and will provide additional qualitative and quantitative information on the use of derivatives and their impact on an entity’s financial position, results of operations and cash flows. SFAS 161 will be effective for the Company beginning January 1, 2009. NOTE 2 ACQUISITIONS Gillette Acquisition On October 1, 2005, we completed our acquisition of The Gillette Company. Pursuant to the acquisition agreement, which provided for the exchange of 0.975 shares of The Procter Gamble Company common stock, on a tax-free basis, for each share of The Gillette Company, we issued 962 million shares of The Procter Gamble Company common stock. The value of these shares was determined using the average Company stock prices beginning two days before and ending two days after January 28, 2005, the date the acquisition was announced. We also issued 79 million stock options in exchange for Gillette’s outstanding stock options. Under the purchase method of accounting, the total consideration was approximately $53.4 billion including common stock, the fair value of vested stock options and acquisition costs. This acquisition ultimately resulted in a new Grooming reportable segment. The Gillette oral care, batteries and personal care businesses were subsumed within the Health Care, Fabric Care and Home Care, and Beauty reportable segments, respectively. The operating results of the Gillette businesses are reported in our financial statements beginning October 1, 2005. The Gillette Company was a market leader in several global product categories including blades and razors, oral care and batteries. Total sales for Gillette during its most recent pre-acquisition year ended December 31, 2004, were $10.5 billion. In order to obtain regulatory approval of the transaction, we were required to divest certain overlapping businesses. We completed the divestiture of the Spinbrush toothbrush business, Rembrandt (a Gillette oral care product line), Right Guard and other Gillette deodorant brands during the fiscal year ended June 30, 2006. In connection with this acquisition, we also announced a share buyback plan, which we completed in July 2006, under which we acquired $20.1 billion of Company common shares either through the open market or from private transactions. In conjunction with the acquisition of The Gillette Company, we recognized an assumed liability for Gillette exit costs of $1.2 billion, including $854 in separation costs related to approximately 5,500 people, $55 in employee relocation costs and $320 in other exit costs. These costs are primarily related to the elimination of selling, general and administrative overlap between the two companies in areas like Global Business Services, corporate staff and go-to-market support, as well as redundant manufacturing capacity. These activities are substantially complete as of June 30, 2008. Total integration plan charges against the assumed liability were $286, $438 and $204 for the years ended June 2008, 2007 and 2006, respectively. A total of $121 of the liability was reversed, which resulted in a reduction to goodwill during the year ended June 30, 2008, related to underspend- ing on a number of projects that were concluded during the period. Other minor business purchases and intangible asset acquisitions totaled $418, $540 and $395 in 2008, 2007 and 2006, respectively.
  • 66.
    Amounts in millionsof dollars except per share amounts or as otherwise specified. 64 The Procter Gamble Company Notes to Consolidated Financial Statements NOTE 3 GOODWILL AND INTANGIBLE ASSETS The change in the net carrying amount of goodwill by Global Business Unit (GBU) was as follows: 2008 2007 BEAUTY GBU Beauty, beginning of year $15,359 $14,968 Acquisitions and divestitures 187 (18) Translation and other 1,357 409 Goodwill, June 30, 2008 16,903 15,359 Grooming, beginning of year 24,211 23,586 Acquisitions and divestitures (269) 289 Translation and other 1,370 336 Goodwill, June 30, 2008 25,312 24,211 HEALTH WELL-BEING GBU Health Care, beginning of year 8,482 8,387 Acquisitions and divestitures (59) 5 Translation and other 327 90 Goodwill, June 30, 2008 8,750 8,482 Snacks, Coffee and Pet Care, beginning of year 2,407 2,396 Acquisitions and divestitures (5) 5 Translation and other 32 6 Goodwill, June 30, 2008 2,434 2,407 HOUSEHOLD CARE GBU Fabric Care and Home Care, beginning of year 4,470 4,406 Acquisitions and divestitures (43) (8) Translation and other 228 72 Goodwill, June 30, 2008 4,655 4,470 Baby Care and Family Care, beginning of year 1,623 1,563 Acquisitions and divestitures (34) 9 Translation and other 124 51 Goodwill, June 30, 2008 1,713 1,623 GOODWILL, NET, beginning of year 56,552 55,306 Acquisitions and divestitures (223) 282 Translation and other 3,438 964 Goodwill, June 30, 2008 59,767 56,552 The increase in goodwill from June 30, 2007, is primarily due to currency translation. Identifiable intangible assets were comprised of: 2008 2007 Gross Gross Carrying Accumulated Carrying Accumulated June 30 Amount Amortization Amount Amortization INTANGIBLE ASSETS WITH DETERMINABLE LIVES Brands $  3,564 $1,032 $  3,317 $  710 Patents and technology 3,188 1,077 3,135 776 Customer relationships 1,947 353 1,738 237 Other 333 209 377 188 Total 9,032 2,671 8,567 1,911 BRANDS WITH INDEFINITE LIVES 27,872 — 26,970 — TOTAL 36,904 2,671 35,537 1,911 The amortization of intangible assets for the years ended June 30, 2008, 2007 and 2006 was $649, $640 and $587, respectively. Estimated amortization expense over the next five years is as follows: 2009 – $626; 2010 – $599; 2011 – $549; 2012 – $512; and 2013 – $489. Such estimates do not reflect the impact of future foreign exchange rate changes. NOTE 4 SUPPLEMENTAL FINANCIAL INFORMATION Selected components of current and noncurrent liabilities were as follows: June 30 2008 2007 ACCRUED AND OTHER LIABILITIES — current Marketing and promotion $  2,760 $2,538 Compensation expenses 1,527 1,390 Accrued Gillette exit costs 257 608 Other 5,610 5,050 TOTAL 10,154 9,586 OTHER NONCURRENT LIABILITIES Pension benefits $  3,146 $2,898 Other postretirement benefits 512 503 Noncurrent FIN 48 liability 3,075 — Other 1,421 1,746 TOTAL 8,154 5,147
  • 67.
    Notes to ConsolidatedFinancial Statements The Procter Gamble Company 65 Amounts in millions of dollars except per share amounts or as otherwise specified. NOTE 5 SHORT-TERM AND LONG-TERM DEBT June 30 2008 2007 SHORT-TERM DEBT Current portion of long-term debt $  1,746 $  2,544 Commercial paper 9,748 9,410 Floating rate note due February 2009 1,500 — Other 90 85 TOTAL 13,084 12,039 The weighted average short-term interest rates were 2.7% and 5.0% as of June 30, 2008 and 2007, respectively, including the effects of interest rate swaps discussed in Note 6. June 30 2008 2007 LONG-TERM DEBT 4.30% USD note due August 2008 $   500 $   500 3.50% USD note due December 2008 650 650 Floating rate note due July 2009 1,750 — Floating rate note due August 2009 1,500 — 6.88% USD note due September 2009 1,000 1,000 4.88% EUR note due October 2011 1,573 — 3.38% EUR note due December 2012 2,203 1,882 4.50% EUR note due May 2014 2,360 2,016 4.95% USD note due August 2014 900 900 4.85% USD note due December 2015 700 700 5.13% EUR note due October 2017 1,731 — 4.13% EUR note due December 2020 944 806 9.36% ESOP debentures due 2008 – 2021 (1) 934 968 4.88% EUR note due May 2027 1,573 1,344 6.25% GBP note due January 2030 993 1,001 5.50% USD note due February 2034 500 500 5.80% USD note due August 2034 600 600 5.55% USD note due March 2037 1,400 1,400 Capital lease obligations 407 628 All other long-term debt 3,109 11,024 Current portion of long-term debt (1,746) (2,544) TOTAL 23,581 23,375 (1) Debt issued by the ESOP is guaranteed by the Company and must be recorded as debt of the Company as discussed in Note 9. Long-term weighted average interest rates were 4.5% and 3.3% as of June 30, 2008 and 2007, respectively, including the effects of interest rate swaps and net investment hedges discussed in Note 6. The fair value of the long-term debt was $23,276 and $23,122 at June 30, 2008 and 2007, respectively. Long-term debt maturities during the next five years are as follows: 2009 – $1,746; 2010 – $5,508; 2011 – $43; 2012 – $1,643; and 2013 – $2,240. NOTE 6 RISK MANAGEMENT ACTIVITIES As a multinational company with diverse product offerings, we are exposed to market risks, such as changes in interest rates, currency exchange rates and commodity prices. To manage the volatility related to these exposures, we evaluate exposures on a consolidated basis to take advantage of logical exposure netting and correlation. For the remaining exposures, we enter into various financial transactions, which we account for under SFAS 133, “Accounting for Derivative Instruments and Hedging Activities,” as amended and interpreted. The utilization of these financial transactions is governed by our policies covering acceptable counterparty exposure, instrument types and other hedging practices. We do not hold or issue derivative financial instruments for speculative trading purposes. At inception, we formally designate and document qualifying instru- ments as hedges of underlying exposures. We formally assess, both at inception and at least quarterly on an ongoing basis, whether the financial instruments used in hedging transactions are effective at offsetting changes in either the fair value or cash flows of the related underlying exposure. Fluctuations in the value of these instruments generally are offset by changes in the fair value or cash flows of the underlying exposures being hedged. This offset is driven by the high degree of effectiveness between the exposure being hedged and the hedging instrument. Any ineffective portion of a change in the fair value of a qualifying instrument is immediately recognized in earnings. Credit Risk We have counterparty credit guidelines and normally enter into transactions with investment grade financial institutions. Counterparty exposures are monitored daily and downgrades in credit rating are reviewed on a timely basis. Credit risk arising from the inability of a counterparty to meet the terms of our financial instrument contracts generally is limited to the amounts, if any, by which the counterparty’s obligations exceed our obligations to the counterparty. We have not incurred and do not expect to incur material credit losses on our risk management or other financial instruments. Interest Rate Management Our policy is to manage interest cost using a mixture of fixed-rate and variable-rate debt. To manage this risk in a cost-efficient manner, we enter into interest rate swaps in which we agree to exchange with the counterparty, at specified intervals, the difference between fixed and variable interest amounts calculated by reference to an agreed- upon notional principal amount. Interest rate swaps that meet specific criteria under SFAS 133 are accounted for as fair value and cash flow hedges. There were no fair value hedging instruments at June 30, 2008, or June 30, 2007. For cash flow hedges, the effective portion of the changes in fair value of the hedging instrument is reported in other comprehensive income (OCI) and reclassified into interest expense over the life of the under- lying debt. The ineffective portion, which is not material for any year
  • 68.
    Amounts in millionsof dollars except per share amounts or as otherwise specified. 66 The Procter Gamble Company Notes to Consolidated Financial Statements presented, is immediately recognized in earnings. The fair value of these cash flow hedging instruments was a liability of $17 and an asset of $53 at June 30, 2008 and 2007, respectively. During the next 12 months, $4 of the June 30, 2008 OCI balance will be reclassified to earnings consistent with the timing of the underlying hedged transactions. Foreign Currency Management We manufacture and sell our products in a number of countries throughout the world and, as a result, are exposed to movements in foreign currency exchange rates. The purpose of our foreign currency hedging program is to reduce the risk caused by short-term changes in exchange rates. To manage this exchange rate risk, we primarily utilize forward contracts and options with maturities of less than 18 months and currency swaps with maturities up to five years. These instruments are intended to offset the effect of exchange rate fluctuations on forecasted sales, inventory purchases, intercompany royalties and intercompany loans denominated in foreign currencies and are therefore accounted for as cash flow hedges. The fair value of these instruments at June 30, 2008 and 2007, was $4 and $34 in assets and $37 and $2 in liabilities, respectively. The effective portion of the changes in fair value of these instruments is reported in OCI and reclassified into earnings in the same financial statement line item and in the same period or periods during which the related hedged transactions affect earnings. The ineffective portion, which is not material for any year presented, is immediately recognized in earnings. Certain instruments used to manage foreign exchange exposure of intercompany financing transactions, income from international operations and other balance sheet items subject to revaluation do not meet the requirements for hedge accounting treatment. In these cases, the change in value of the instruments is designed to offset the foreign currency impact of the related exposure. The fair value of these instruments at June 30, 2008 and 2007, was $190 and $110 in assets and $33 and $78 in liabilities, respectively. The change in value of these instruments is immediately recognized in earnings. The net impact of such instruments, included in selling, general and adminis- trative expense, was $1,397, $56 and $87 of gains in 2008, 2007 and 2006, respectively, which substantially offset foreign currency transaction and translation losses of the exposures being hedged. Net Investment Hedging We hedge certain net investment positions in major foreign subsidiaries. To accomplish this, we either borrow directly in foreign currency and designate all or a portion of foreign currency debt as a hedge of the applicable net investment position or enter into foreign currency swaps that are designated as hedges of our related foreign net investments. Under SFAS 133, changes in the fair value of these instruments are immediately recognized in OCI to offset the change in the value of the net investment being hedged. Currency effects of these hedges reflected in OCI were after-tax losses of $2,951 and $835 in 2008 and 2007, respectively. Accumulated net balances were $5,023 and $2,072 after-tax losses as of June 30, 2008 and 2007, respectively. Commodity Price Management Certain raw materials utilized in our products or production processes are subject to price volatility caused by weather, supply conditions, political and economic variables and other unpredictable factors. To manage the volatility related to anticipated purchases of certain of these materials, we use futures and options with maturities generally less than one year and swap contracts with maturities up to five years. These market instruments generally are designated as cash flow hedges under SFAS 133. The effective portion of the changes in fair value for these instruments is reported in OCI and reclassified into earnings in the same financial statement line item and in the same period or periods during which the hedged transactions affect earnings. The ineffective and non-qualifying portions, which are not material for any year presented, are immediately recognized in earnings. The fair value of these cash flow hedging instruments was an asset of $229 and $70 at June 30, 2008 and 2007, respectively. During the next 12 months, $126 of the June 30, 2008 OCI balance will be reclassified to earnings consistent with the timing of the underlying hedged transactions. Insurance The Company purchases limited discretionary insurance to cover catastrophic property damage, business interruption and liability risk of loss exposures. Deductibles and loss sharing will likely increase over time, recognizing the Company’s ability to cost-effectively fund losses from internal cash flow generation and access to capital markets. NOTE 7 EARNINGS PER SHARE Net earnings less preferred dividends (net of related tax benefits) are divided by the weighted average number of common shares outstand- ing during the year to calculate basic net earnings per common share. Diluted net earnings per common share are calculated to give effect to stock options and other stock-based awards (see Note 8) and assume conversion of preferred stock (see Note 9). Net earnings and common shares used to calculate basic and diluted net earnings per share were as follows: Years ended June 30 2008 2007 2006 NET EARNINGS $12,075 $10,340 $8,684 Preferred dividends, net of tax benefit (176) (161) (148) NET EARNINGS AVAILABLE TO COMMON SHAREHOLDERS 11,899 10,179 8,536 Preferred dividends, net of tax benefit 176 161 148 DILUTED NET EARNINGS 12,075 10,340 8,684
  • 69.
    Notes to ConsolidatedFinancial Statements The Procter Gamble Company 67 Amounts in millions of dollars except per share amounts or as otherwise specified. Shares in millions; Years ended June 30 2008 2007 2006 Basic weighted average common shares outstanding 3,080.8 3,159.0 3,054.9 Effect of dilutive securities Conversion of preferred shares (1) 144.2 149.6 154.1 Exercise of stock options and other unvested equity awards (2) 91.8 90.0 76.9 DILUTED WEIGHTED AVERAGE COMMON SHARES OUTSTANDING 3,316.8 3,398.6 3,285.9 (1) Despite being included currently in diluted net earnings per common share, the actual conversion to common stock occurs pursuant to the repayment of the ESOPs’ obligations through 2035. (2) Approximately 40 million in 2008, 41 million in 2007 and 44 million in 2006 of the Company’s outstanding stock options were not included in the diluted net earnings per share calculation because to do so would have been antidilutive (i.e., the total proceeds upon exercise would have exceeded the market value of the underlying common shares). NOTE 8 STOCK-BASED COMPENSATION We have stock-based compensation plans under which we annually grant stock option and restricted stock awards to key managers and directors. Exercise prices on options granted have been and continue to be set equal to the market price of the underlying shares on the date of the grant. The key manager stock option awards granted since September 2002 are vested after three years and have a 10-year life. The key manager stock option awards granted from July 1998 through August 2002 vested after three years and have a 15-year life. Beginning in 2008, key managers were given the alternative to elect up to 50% of the value of their option award in restricted stock units (RSUs). Key manager RSUs are vested and settled in shares of common stock five years from the grant date. The awards provided to the Company’s directors are in the form of restricted stock and RSUs. In addition to our key manager and director grants, we make other minor stock options and RSU grants to employees for which the terms are not substantially different. A total of 229 million shares of common stock were authorized for issuance under stock-based compensation plans approved by share- holders in 2001 and 2003, of which 50 million remain available for grant. An additional 20 million shares of common stock available for issuance under a plan approved by Gillette shareholders in 2004 were assumed by the Company in conjunction with the acquisition of The Gillette Company in October 2005. A total of 12 million of these shares remain available for grant under this plan. There were also 5 million shares available for grant under the Future Shares Plan approved by the Board of Directors in 1997. This plan was terminated in October 2007. Total stock-based compensation expense for stock option grants was $522, $612 and $526 for 2008, 2007 and 2006, respectively. The total income tax benefit recognized in the income statement for these stock-based compensation arrangements was $141, $163 and $140 for 2008, 2007 and 2006, respectively. Total compensation cost for restricted stock, restricted stock units and other stock-based grants, was $33, $56 and $59 in 2008, 2007 and 2006, respectively. In calculating the compensation expense for options granted, we utilize a binomial lattice-based model for the valuation of stock option grants. Assumptions utilized in the model, which are evaluated and revised, as necessary, to reflect market conditions and experience, were as follows: Years ended June 30 2008 2007 2006 Interest rate 1.3 – 3.8% 4.3 – 4.8% 4.5 – 4.7% Weighted average interest rate 3.4% 4.5% 4.6% Dividend yield 1.9% 1.9% 1.9% Expected volatility 19 – 25% 16 – 20% 15 – 20% Weighted average volatility 20% 19% 19% Expected life in years 8.3 8.7 8.7 Because lattice-based option valuation models incorporate ranges of assumptions for inputs, those ranges are disclosed in the preceding table. Expected volatilities are based on a combination of historical volatility of our stock and implied volatilities of call options on our stock. We use historical data to estimate option exercise and employee termination patterns within the valuation model. The expected term of options granted is derived from the output of the option valuation model and represents the average period of time that options granted are expected to be outstanding. The interest rate for periods within the contractual life of the options is based on the U.S. Treasury yield curve in effect at the time of grant. A summary of options outstanding under the plans as of June 30, 2008, and activity during the year then ended is presented below: Weighted Avg. Remaining Aggregate Weighted Avg. Contractual Intrinsic Value Options in thousands Options Exercise Price Life in Years (in millions) Outstanding, beginning of year 355,006 $46.10 Granted 28,345 66.33 Exercised (43,413) 42.32 Canceled (2,761) 51.29 OUTSTANDING, END OF YEAR 337,177 48.25 6.8 $4,474 EXERCISABLE 244,533 42.63 6.1 4,447 The weighted average grant-date fair value of options granted was $15.91, $17.29 and $16.30 per share in 2008, 2007 and 2006, respectively. The total intrinsic value of options exercised was $1,129, $894 and $815 in 2008, 2007 and 2006, respectively. The total grant-date fair value of options that vested during 2008, 2007 and 2006 was $532, $552 and $388, respectively. We have no specific policy to repurchase common shares to mitigate the dilutive impact of options; however, we have historically made adequate discretionary purchases, based on cash availability, market trends and other factors, to satisfy stock option exercise activity.
  • 70.
    Amounts in millionsof dollars except per share amounts or as otherwise specified. 68 The Procter Gamble Company Notes to Consolidated Financial Statements At June 30, 2008, there was $565 of compensation cost that has not yet been recognized related to stock awards. That cost is expected to be recognized over a remaining weighted average period of 1.9 years. Cash received from options exercised was $1,837, $1,422 and $1,229 in 2008, 2007 and 2006, respectively. The actual tax benefit realized for the tax deductions from option exercises totaled $318, $265 and $242 in 2008, 2007 and 2006, respectively. NOTE 9 POSTRETIREMENT BENEFITS AND EMPLOYEE STOCK OWNERSHIP PLAN We offer various postretirement benefits to our employees. Defined Contribution Retirement Plans We have defined contribution plans which cover the majority of our U.S. employees, as well as employees in certain other countries. These plans are fully funded. We generally make contributions to participants’ accounts based on individual base salaries and years of service. The primary U.S. defined contribution plan (the U.S. DC plan) comprises the majority of the balances and expense for the Company’s defined contribution plans. For the U.S. DC plan, the contribution rate is set annually. Total contributions for this plan approximated 15% of total participants’ annual wages and salaries in 2008, 2007 and 2006. We maintain The Procter Gamble Profit Sharing Trust (Trust) and Employee Stock Ownership Plan (ESOP) to provide a portion of the funding for the U.S. DC plan, as well as other retiree benefits. Operating details of the ESOP are provided at the end of this Note. The fair value of the ESOP Series A shares allocated to participants reduces our cash contribution required to fund the U.S. DC plan. Total defined contribution expense was $290, $273, and $249 in 2008, 2007 and 2006, respectively. Defined Benefit Retirement Plans and Other Retiree Benefits We offer defined benefit retirement pension plans to certain employees. These benefits relate primarily to local plans outside the U.S., and to a lesser extent, plans assumed in the Gillette acquisition covering U.S. employees. These acquired Gillette plans were frozen effective January 1, 2008. We also provide certain other retiree benefits, primarily health care and life insurance, for the majority of our U.S. employees who become eligible for these benefits when they meet minimum age and service requirements. Generally, the health care plans require cost sharing with retirees and pay a stated percentage of expenses, reduced by deductibles and other coverages. These benefits are primarily funded by ESOP Series B shares, as well as certain other assets contributed by the Company. Obligation and Funded Status. We use a June 30 measurement date for our defined benefit retirement plans and other retiree benefit plans. The following provides a reconciliation of benefit obligations, plan assets and funded status of these plans: Other Pension Benefits (1) Retiree Benefits (2) Years ended June 30 2008 2007 2008 2007 CHANGE IN BENEFIT OBLIGATION Benefit obligation at beginning of year (3) $  9,819 $ 9,244 $3,558 $3,286 Service cost 263 279 95 85 Interest cost 539 476 226 206 Participants’ contributions 14 19 58 55 Amendments 52 24 (11) 12 Actuarial (gain) loss (655) 1 (232) 80 Acquisitions (divestitures) (7) (8) 2 — Curtailments and settlements (68) (163) (3) (1) Special termination benefits 1 1 2 2 Currency translation and other 642 431 67 35 Benefit payments (505) (485) (209) (202) BENEFIT OBLIGATION AT END OF YEAR (3) 10,095 9,819 3,553 3,558 CHANGE IN PLAN ASSETS Fair value of plan assets at beginning of year 7,350 6,203 3,390 3,091 Actual return on plan assets (459) 736 (29) 429 Acquisitions (divestitures) — (2) — — Employer contributions 507 565 21 30 Participants’ contributions 14 19 58 55 Currency translation and other 318 314 1 1 ESOP debt impacts (4) — — (7) (14) Benefit payments (505) (485) (209) (202) FAIR VALUE OF PLAN ASSETS AT END OF YEAR 7,225 7,350 3,225 3,390 FUNDED STATUS (2,870) (2,469) (328) (168) (1) Primarily non-U.S.-based defined benefit retirement plans. (2) Primarily U.S.-based other postretirement benefit plans. (3) For the pension benefit plans, the benefit obligation is the projected benefit obligation. For other retiree benefit plans, the benefit obligation is the accumulated postretirement benefit obligation. (4) Represents increases in the ESOP’s debt, which is netted against plan assets for Other Retiree Benefits.
  • 71.
    Notes to ConsolidatedFinancial Statements The Procter Gamble Company 69 Amounts in millions of dollars except per share amounts or as otherwise specified. Other Pension Benefits Retiree Benefits Years ended June 30 2008 2007 2008 2007 CLASSIFICATION OF NET AMOUNT RECOGNIZED Noncurrent assets $   321 $   469 $ 200 $ 347 Current liability (45) (40) (16) (12) Noncurrent liability (3,146) (2,898) (512) (503) NET AMOUNT RECOGNIZED (2,870) (2,469) (328) (168) AMOUNTS RECOGNIZED IN ACCUMULATED OTHER COMPREHENSIVE INCOME (AOCI) Net actuarial loss 715 379 578 337 Prior service cost (credit) 213 172 (175) (185) NET AMOUNTS RECOGNIZED IN AOCI 928 551 403 152 CHANGE IN PLAN ASSETS AND BENEFIT OBLIGATIONS RECOGNIZED IN ACCUMULATED OTHER COMPREHENSIVE INCOME (AOCI) Net actuarial loss —  current year 361 n/a 226 n/a Prior service cost (credit) —  current year 52 n/a (11) n/a Amortization of net actuarial loss (9) n/a (7) n/a Amortization of prior service (cost) / credit (14) n/a 21 n/a Settlement / Curtailment cost (32) n/a (2) n/a Currency translation and other 19 n/a 24 n/a TOTAL CHANGE IN AOCI 377 251 NET AMOUNTS RECOGNIZED IN PERIODIC BENEFIT COST AND AOCI 609 33 The underfunding of pension benefits is primarily a function of the different funding incentives that exist outside of the U.S. In certain countries, there are no legal requirements or financial incentives provided to companies to pre-fund pension obligations. In these instances, benefit payments are typically paid directly from the Company’s cash as they become due. The accumulated benefit obligation for all defined benefit retirement pension plans was $8,750 and $8,611 at June 30, 2008 and June 30, 2007, respectively. Pension plans with accumulated benefit obligations in excess of plan assets and plans with projected benefit obligations in excess of plan assets consist of the following: Accumulated Benefit Projected Benefit Obligation Exceeds the Obligation Exceeds the Fair Value of Plan Assets Fair Value of Plan Assets Years ended June 30 2008 2007 2008 2007 Projected benefit obligation $5,277 $4,813 $7,987 $6,763 Accumulated benefit obligation 4,658 4,294 6,737 5,792 Fair value of plan assets 2,153 1,973 4,792 3,825 Net Periodic Benefit Cost. Components of the net periodic benefit cost were as follows: Pension Benefits Other Retiree Benefits Years ended June 30 2008 2007 2006 2008 2007 2006 Service cost $ 263 $ 279 $ 265 $   95 $   85 $   97 Interest cost 539 476 383 226 206 179 Expected return on plan assets (557) (454) (353) (429) (407) (372) Prior service cost (credit) amortization 14 13 7 (21) (22) (22) Net actuarial loss amortization 9 45 76 7 2 6 Curtailment and settlement gain (36) (176) (4) (1) (1) — GROSS BENEFIT COST (CREDIT) 232 183 374 (123) (137) (112) Dividends on ESOP preferred stock — — — (95) (85) (78) NET PERIODIC BENEFIT COST (CREDIT) 232 183 374 (218) (222) (190) Pursuant to plan revisions adopted during 2007, Gillette’s U.S. defined benefit retirement pension plans were frozen effective January 1, 2008, at which time Gillette employees in the U.S. moved into the PG defined contribution Profit Sharing Trust and Employee Stock Ownership Plan. This revision resulted in a $154 curtailment gain for the year ended June 30, 2007. Amounts expected to be amortized from accumulated other compre- hensive income into net period benefit cost during the year ending June 30, 2009, are as follows: Other Pension Retiree Benefits Benefits Net actuarial loss $31 $  4 Prior service cost (credit) 17 (23)
  • 72.
    Amounts in millionsof dollars except per share amounts or as otherwise specified. 70 The Procter Gamble Company Notes to Consolidated Financial Statements Assumptions. We determine our actuarial assumptions on an annual basis. These assumptions are weighted to reflect each country that may have an impact on the cost of providing retirement benefits. The weighted average assumptions for the defined benefit and other retiree benefit calculations, as well as assumed health care trend rates, were as follows: Pension Benefits Other Retiree Benefits Years ended June 30 2008 2007 2008 2007 ASSUMPTIONS USED TO DETERMINE BENEFIT OBLIGATIONS (1) Discount rate 6.3% 5.5% 6.9% 6.3% Rate of compensation increase 3.7% 3.1% — — ASSUMPTIONS USED TO DETERMINE NET PERIODIC BENEFIT COST (2) Discount rate 5.5% 5.2% 6.3% 6.3% Expected return on plan assets 7.4% 7.2% 9.3% 9.3% Rate of compensation increase 3.1% 3.0% — — ASSUMED HEALTH CARE COST TREND RATES Health care cost trend rates assumed for next year — — 8.6% 9.0% Rate to which the health care cost trend rate is assumed to decline (ultimate trend rate) — — 5.1% 5.1% Year that the rate reaches the ultimate trend rate — — 2015 2013 (1) Determined as of end of year. (2) Determined as of beginning of year and adjusted for acquisitions. Several factors are considered in developing the estimate for the long- term expected rate of return on plan assets. For the defined benefit retirement plans, these include historical rates of return of broad equity and bond indices and projected long-term rates of return obtained from pension investment consultants. The expected long-term rates of return for plan assets are 8% – 9% for equities and 5% – 6% for bonds. For other retiree benefit plans, the expected long-term rate of return reflects the fact that the assets are comprised primarily of Company stock. The expected rate of return on Company stock is based on the long-term projected return of 9.5% and reflects the historical pattern of favorable returns. Assumed health care cost trend rates could have a significant effect on the amounts reported for the other retiree benefit plans. A one- percentage point change in assumed health care cost trend rates would have the following effects: One-Percentage One-Percentage Point Increase Point Decrease Effect on total of service and interest cost components $  60 $  (46) Effect on postretirement benefit obligation 505 (411) Plan Assets. Our target asset allocation for the year ended June 30, 2008, and actual asset allocation by asset category as of June 30, 2008 and 2007, were as follows: Target Asset Allocation Asset Category Pension Benefits Other Retiree Benefits Equity securities (1) 48% 96% Debt securities 52% 4% TOTAL 100% 100% Asset Allocation at June 30 Pension Benefits Other Retiree Benefits Asset Category 2008 2007 2008 2007 Equity securities (1) 45% 56% 96% 96% Debt securities 50% 39% 4% 4% Cash 3% 3% — — Real estate 2% 2% — — TOTAL 100% 100% 100% 100% (1) Equity securities for other retiree plan assets include Company stock, net of Series B ESOP debt of $2,809 and $2,932 as of June 30, 2008 and 2007, respectively. Our investment objective for defined benefit retirement plan assets is to meet the plans’ benefit obligations, while minimizing the potential for future required Company plan contributions. The investment strategies focus on asset class diversification, liquidity to meet benefit payments and an appropriate balance of long-term investment return and risk. Target ranges for asset allocations are determined by match- ing the actuarial projections of the plans’ future liabilities and benefit payments with expected long-term rates of return on the assets, taking into account investment return volatility and correlations across asset classes. Plan assets are diversified across several investment managers and are generally invested in liquid funds that are selected to track broad market equity and bond indices. Investment risk is carefully controlled with plan assets rebalanced to target allocations on a periodic basis and continual monitoring of investment managers’ performance relative to the investment guidelines established with each investment manager.
  • 73.
    Notes to ConsolidatedFinancial Statements The Procter Gamble Company 71 Amounts in millions of dollars except per share amounts or as otherwise specified. Cash Flows. Management’s best estimate of cash requirements for the defined benefit retirement plans and other retiree benefit plans for the year ending June 30, 2009, is $575 and $22, respectively. For the defined benefit retirement plans, this is comprised of $180 in expected benefit payments from the Company directly to participants of unfunded plans and $395 of expected contributions to funded plans. For other retiree benefit plans, this is comprised of expected contributions that will be used directly for benefit payments. Expected contributions are dependent on many variables, including the variability of the market value of the plan assets as compared to the benefit obligation and other market or regulatory conditions. In addition, we take into consideration our business investment opportunities and resulting cash requirements. Accordingly, actual funding may differ significantly from current estimates. Total benefit payments expected to be paid to participants, which include payments funded from the Company’s assets, as discussed above, as well as payments paid from the plans, are as follows: Other Pension Retiree Years ending June 30 Benefits Benefits EXPECTED BENEFIT PAYMENTS 2009 $  500 $  204 2010 505 222 2011 518 240 2012 520 256 2013 537 271 2014 – 2018 2,974 1,590 Employee Stock Ownership Plan We maintain the ESOP to provide funding for certain employee benefits discussed in the preceding paragraphs. The ESOP borrowed $1.0 billion in 1989 and the proceeds were used to purchase Series A ESOP Convertible Class A Preferred Stock to fund a portion of the U.S. DC plan. Principal and interest requirements of the borrowing were paid by the Trust from dividends on the preferred shares and from advances provided by the Company. The original borrowing of $1.0 billion has been repaid in full, and advances from the Company of $197 remain outstanding at June 30, 2008. Each share is convertible at the option of the holder into one share of the Company’s common stock. The dividend for the current year was equal to the common stock dividend of $1.45 per share. The liquidation value is $6.82 per share. In 1991, the ESOP borrowed an additional $1.0 billion. The proceeds were used to purchase Series B ESOP Convertible Class A Preferred Stock to fund a portion of retiree health care benefits. These shares, net of the ESOP’s debt, are considered plan assets of the Other Retiree Benefits plan discussed above. Debt service requirements are funded by preferred stock dividends, cash contributions and advances provided by the Company, of which $194 is outstanding at June 30, 2008. Each share is convertible at the option of the holder into one share of the Company’s common stock. The dividend for the current year was equal to the common stock dividend of $1.45 per share. The liquidation value is $12.96 per share. As permitted by SOP 93-6, “Employers Accounting for Employee Stock Ownership Plans,” we have elected, where applicable, to continue our practices, which are based on SOP 76-3, “Accounting Practices for Certain Employee Stock Ownership Plans.” ESOP debt, which is guaranteed by the Company, is recorded as debt (see Note 5) with an offset to the Reserve for ESOP debt retirement, which is presented within Shareholders’ Equity. Advances to the ESOP by the Company are recorded as an increase in the Reserve for ESOP Debt Retirement. Interest incurred on the ESOP debt is recorded as interest expense. Dividends on all preferred shares, net of related tax benefits, are charged to retained earnings. The series A and B preferred shares of the ESOP are allocated to employees based on debt service requirements, net of advances made by the Company to the Trust. The number of preferred shares outstanding at June 30 was as follows: Shares in thousands 2008 2007 2006 Allocated 58,557 60,402 61,614 Unallocated 18,665 20,807 23,125 TOTAL SERIES A 77,222 81,209 84,739 Allocated 21,134 21,105 21,733 Unallocated 43,618 44,642 45,594 TOTAL SERIES B 64,752 65,747 67,327 For purposes of calculating diluted net earnings per common share, the preferred shares held by the ESOP are considered converted from inception. In connection with the Gillette acquisition, we assumed the Gillette ESOP, which was established to assist Gillette employees in financing retiree medical costs. These ESOP accounts are held by participants and must be used to reduce the Company’s other retiree benefit obligations. Such accounts reduced our obligation by $201 at June 30, 2008.
  • 74.
    Amounts in millionsof dollars except per share amounts or as otherwise specified. 72 The Procter Gamble Company Notes to Consolidated Financial Statements NOTE 10 INCOME TAXES Under SFAS 109, “Accounting for Income Taxes,” income taxes are recognized for the amount of taxes payable for the current year and for the impact of deferred tax liabilities and assets, which represent future tax consequences of events that have been recognized differently in the financial statements than for tax purposes. Deferred tax assets and liabilities are established using the enacted statutory tax rates and are adjusted for any changes in such rates in the period of change. Earnings before income taxes consisted of the following: Years ended June 30 2008 2007 2006 United States $  9,142 $  9,138 $  7,410 International 6,936 5,572 5,003 TOTAL 16,078 14,710 12,413 The income tax provision consisted of the following: Years ended June 30 2008 2007 2006 CURRENT TAX EXPENSE U.S. federal $1,016 $2,667 $1,961 International 1,546 1,325 1,702 U.S. state and local 227 125 178 2,789 4,117 3,841 DEFERRED TAX EXPENSE U.S. federal 1,267 231 226 International and other (53) 22 (338) 1,214 253 (112) TOTAL TAX EXPENSE 4,003 4,370 3,729 A reconciliation of the U.S. federal statutory income tax rate to our actual income tax rate is provided below: Years ended June 30 2008 2007 2006 U.S. federal statutory income tax rate 35.0% 35.0% 35.0% Country mix impacts of foreign operations -6.6% -4.3% -3.6% Income tax reserve adjustments -3.1% -0.3% -1.5% Other -0.4% -0.7% 0.1% EFFECTIVE INCOME TAX RATE 24.9% 29.7% 30.0% Income tax reserve adjustments represent changes in estimated exposures related to prior year tax positions. As discussed in Note 1, on July 1, 2007, we adopted FASB Interpretation No. 48, “Accounting for Uncertainty in Income Taxes” (FIN 48). The adoption of FIN 48 resulted in a decrease to retained earnings as of July 1, 2007, of $232, which was reflected as a cumulative effect of a change in accounting principle, with a corresponding increase to the net liability for unrecognized tax benefits. The impact primarily reflects the accrual of additional statutory interest and penalties as required by FIN 48, partially offset by adjustments to existing unrecognized tax benefits to comply with FIN 48 measurement principles. The imple- mentation of FIN 48 also resulted in a reduction in our net tax liabilities for uncertain tax positions related to prior acquisitions accounted for under purchase accounting, resulting in an $80 decrease to goodwill. Additionally, the Company historically classified unrecognized tax benefits in current taxes payable. As a result of the adoption of FIN 48, unrecognized tax benefits not expected to be paid in the next 12 months were reclassified to other noncurrent liabilities. A reconciliation of the beginning and ending amount of unrecognized tax benefits is as follows: Balance at July 1, 2007 $2,971 Increases in tax positions for prior years 164 Decreases in tax positions for prior years (576) Increases in tax positions for current year 375 Settlements with taxing authorities (260) Lapse in statute of limitations (200) Currency translation 108 Balance at June 30, 2008 2,582 Included in the total unrecognized tax benefits is $1,563 that, if recognized, would impact the effective tax rate in future periods. We recognize accrued interest and penalties related to unrecognized tax benefits in income tax expense. Accrued interest and penalties as of June 30, 2008, were $656 and $155, respectively, and are not included in the above table. During the fiscal year ended June 30, 2008, we recognized $213 and $35 in interest and penalties, respectively. The Company is present in over 140 taxable jurisdictions, and at any point in time, has 30 – 40 audits underway at various stages of completion. We evaluate our tax positions and establish liabilities for uncertain tax positions that may be challenged by local authorities and may not be fully sustained, despite our belief that the underlying tax positions are fully supportable. Uncertain tax positions are reviewed on an ongoing basis and are adjusted in light of changing facts and circumstances, including progress of tax audits, developments in case law, and closing of statute of limitations. Such adjustments are reflected in the tax provision as appropriate. The Company has made a concerted effort to bring its audit inventory to a more current position. We have done this by working with tax authorities to conduct audits for several open years at once. We have tax years open ranging from 1997 and forward. We have $318 related to uncertain tax positions classified as current, for which we expect settlement to be made in the next 12 months. For the remaining uncertain tax positions, it is difficult at this time to estimate the timing of the resolution. In addition, we are generally not able to reliably estimate the ultimate settlement amounts until the close of the audit. While we do not expect material changes, it is possible that the amount of unrecognized benefit with respect to our uncertain tax positions will significantly increase or decrease within the next 12 months related to the audits described
  • 75.
    Notes to ConsolidatedFinancial Statements The Procter Gamble Company 73 Amounts in millions of dollars except per share amounts or as otherwise specified. above. At this time we are not able to make a reasonable estimate of the range of impact on the balance of unrecognized tax benefits or the impact on the effective tax rate related to these items. Tax benefits credited to shareholders’ equity totaled $1,823 and $1,066 for the years ended June 30, 2008 and 2007, respectively. These primarily relate to the tax effects of net investment hedges, excess tax benefits from the exercise of stock options and the impacts of certain adjustments to pension and other retiree benefit obligations recorded in shareholders’ equity, including the impact of adopting SFAS 158 in 2007. We have undistributed earnings of foreign subsidiaries of approximately $21 billion at June 30, 2008, for which deferred taxes have not been provided. Such earnings are considered indefinitely invested in the foreign subsidiaries. If such earnings were repatriated, additional tax expense may result, although the calculation of such additional taxes is not practicable. Deferred income tax assets and liabilities were comprised of the following: June 30 2008 2007 DEFERRED TAX ASSETS Stock-based compensation $  1,082 $  1,132 Unrealized loss on financial and foreign exchange transactions 1,274 723 Pension and postretirement benefits 633 560 Loss and other carryforwards 482 439 Advance payments 302 183 Goodwill and other intangible assets 267 249 Accrued marketing and promotion expense 125 161 Accrued interest and taxes 123 — Inventory 114 95 Fixed assets 100 85 Other 1,048 1,119 Valuation allowances (173) (190) TOTAL 5,377 4,556 DEFERRED TAX LIABILITIES Goodwill and other intangible assets $12,371 $12,102 Fixed assets 1,847 1,884 Other 151 132 TOTAL 14,369 14,118 Net operating loss carryforwards were $1,515 and $1,442 at June 30, 2008 and 2007, respectively. If unused, $629 will expire between 2009 and 2028. The remainder, totaling $886 at June 30, 2008, may be carried forward indefinitely. NOTE 11 COMMITMENTS AND CONTINGENCIES Guarantees In conjunction with certain transactions, primarily divestitures, we may provide routine indemnifications (e.g., indemnification for representa- tions and warranties and retention of previously existing environmental, tax and employee liabilities) of which terms range in duration and in some circumstances are not explicitly defined. The maximum obligation under some indemnifications is not explicitly stated and, as a result, the overall amount of these obligations cannot be reasonably esti- mated. Other than obligations recorded as liabilities at the time of divestiture, we have not made significant payments for these indem- nifications. We believe that if we were to incur a loss on any of these matters, the loss would not have a material effect on our financial position, results of operations or cash flows. In certain situations, we guarantee loans for suppliers and customers. The total amount of guarantees issued under such arrangements is not material. Off-Balance Sheet Arrangements We do not have off-balance sheet financing arrangements, including variable interest entities, under FIN 46(R), “Consolidation of Variable Interest Entities,” that have a material impact on our financial statements. Purchase Commitments We have purchase commitments for materials, supplies, services and property, plant and equipment as part of the normal course of business. Commitments made under take-or-pay obligations are as follows: 2009 – $1,205; 2010 – $917; 2011 – $745; 2012 – $688; 2013 – $408; and $363 thereafter. Such amounts represent future purchases in line with expected usage to obtain favorable pricing. Approximately 35% of our purchase commitments relate to service contracts for information technology, human resources management and facilities management activities that were outsourced in recent years. Due to the proprietary nature of many of our materials and processes, certain supply contracts contain penalty provisions for early termination. We do not expect to incur penalty payments under these provisions that would materially affect our financial position, results of operations or cash flows. Operating Leases We lease certain property and equipment for varying periods. Future minimum rental commitments under noncancelable operating leases are as follows: 2009 – $299; 2010 – $288; 2011 – $240; 2012 – $196; 2013 – $185; and $448 thereafter. Operating lease obligations are shown net of guaranteed sublease income.
  • 76.
    Amounts in millionsof dollars except per share amounts or as otherwise specified. 74 The Procter Gamble Company Notes to Consolidated Financial Statements Litigation We are subject to various legal proceedings and claims arising out of our business which cover a wide range of matters such as governmental regulations, antitrust and trade regulations, product liability, patent and trademark matters, income taxes and other actions. Recently, the Company became subject to a variety of investigations into potential competition law violations in the European Union, including investigations initiated in the fourth quarter of fiscal 2008 by the European Commission with the assistance of the national authorities from a variety of countries. We believe these matters involve a number of other consumer products companies and/or retail customers. The Company’s policy is to comply with all laws and regulations, including all antitrust and competition laws. Competition and antitrust law inquiries often continue for several years and, if violations are found, can result in substantial fines. At this point, no significant formal claims have been made against the Company or any of our subsidiaries in connection with any of the above inquiries. We cannot at this time predict the final financial impact of these competition law issues. However, the ultimate resolution of these matters could result in fines or other costs that could materially impact future results. As these matters evolve we will, if necessary, recognize the appropriate reserves. With respect to other litigation and claims, while considerable uncer- tainty exists, in the opinion of management and our counsel, the ultimate resolution of the various lawsuits and claims will not materially affect our financial position, results of operations or cash flows. We are also subject to contingencies pursuant to environmental laws and regulations that in the future may require us to take action to correct the effects on the environment of prior manufacturing and waste disposal practices. Based on currently available information, we do not believe the ultimate resolution of environmental remediation will have a material adverse effect on our financial position, results of operations or cash flows. NOTE 12 SEGMENT INFORMATION Effective July 1, 2007, we made a number of changes to our organi- zational structure and certain of our key leadership positions. These resulted in changes to our Global Business Units (GBU) and reporting segment structure. The following discussion and segment information reflect the organizational changes for all periods presented. We are organized under three Global Business Units as follows: The Beauty GBU includes the Beauty and the Grooming businesses.• The Beauty business is comprised of cosmetics, deodorants, prestige fragrances, hair care, personal cleansing and skin care. The Grooming business includes blades and razors, electric hair removal devices, face and shave products and home appliances. The Health and Well-Being GBU includes the Health Care and• the Snacks, Coffee and Pet Care businesses. The Health Care busi- ness includes feminine care, oral care, personal health care and pharmaceuticals. The Snacks, Coffee and Pet Care business includes coffee, pet food and snacks. The Household Care GBU includes the Fabric Care and Home Care as• well as the Baby Care and Family Care businesses. The Fabric Care and Home Care business includes air care, batteries, dish care, fabric care and surface care. The Baby Care and Family Care business includes baby wipes, bath tissue, diapers, facial tissue and paper towels. Under U.S. GAAP, we have six reportable segments: Beauty; Grooming; Health Care; Snacks, Coffee and Pet Care; Fabric Care and Home Care; and Baby Care and Family Care. The accounting policies of the busi- nesses are generally the same as those described in Note 1. Differences between these policies and U.S. GAAP primarily reflect: income taxes, which are reflected in the businesses using applicable blended statutory rates; the recording of fixed assets at historical exchange rates in certain high-inflation economies; and the treatment of certain unconsolidated investees. Certain unconsolidated investees are managed as integral parts of our business units for management reporting purposes. Accordingly, these partially owned operations are reflected as consoli- dated subsidiaries in segment results, with 100% recognition of the individual income statement line items through before-tax earnings. Eliminations to adjust these line items to U.S. GAAP are included in Corporate. In determining after-tax earnings for the businesses, we eliminate the share of earnings applicable to other ownership interests, in a manner similar to minority interest, and apply statutory tax rates. Adjustments to arrive at our effective tax rate are also included in Corporate. Corporate includes certain operating and non-operating activities that are not reflected in the operating results used internally to measure and evaluate the businesses, as well as eliminations to adjust management reporting principles to U.S. GAAP. Operating activities in Corporate include the results of incidental businesses managed at the corporate level along with the elimination of individual revenues and expenses generated by certain unconsolidated investees discussed in the preced- ing paragraph over which we exert significant influence, but do not control. Operating elements also comprise certain employee benefit costs, the costs of certain restructuring-type activities to maintain a competitive cost structure including manufacturing and workforce rationalization and other general corporate items. The non-operating elements primarily include interest expense, divestiture gains and interest and investing income. In addition, Corporate includes the historical results of certain divested businesses, including certain Gillette brands that were divested in 2006 as required by the regulatory authorities in relation to the Gillette acquisition. Corporate assets primarily include cash, investment securities and all goodwill. We had net sales in the U.S. of $33.0 billion, $31.9 billion and $29.5 billion for the years ended June 30, 2008, 2007 and 2006, respectively. Assets in the U.S. totaled $73.8 billion and $73.5 billion as of June 30, 2008 and 2007, respectively. Our largest customer, Wal-Mart Stores, Inc. and its affiliates, accounted for 15% of consolidated net sales in 2008, 2007 and 2006.
  • 77.
    Notes to ConsolidatedFinancial Statements The Procter Gamble Company 75 Amounts in millions of dollars except per share amounts or as otherwise specified. Before-Tax Depreciation Capital Global Segment Results Net Sales Earnings Net Earnings Amortization Total Assets Expenditures BEAUTY GBU BEAUTY (1) 2008 $19,515 $  3,528 $  2,730 $  454 $  12,260 $  465 2007 17,889 3,440 2,611 419 11,140 431 2006 16,687 3,262 2,412 380 10,081 384 GROOMING (1) 2008 8,254 2,299 1,679 739 27,406 305 2007 7,437 1,895 1,383 729 27,767 314 2006 5,114 1,176 846 573 28,994 361 HEALTH AND WELL-BEING GBU HEALTH CARE (1) 2008 14,578 3,746 2,506 441 10,597 450 2007 13,381 3,365 2,233 439 9,512 374 2006 11,831 2,785 1,829 374 9,636 341 SNACKS, COFFEE AND PET CARE 2008 4,852 762 477 136 2,275 105 2007 4,537 759 477 164 2,176 141 2006 4,383 627 385 159 2,122 150 HOUSEHOLD CARE GBU FABRIC CARE AND HOME CARE (1) 2008 23,831 5,078 3,422 603 13,772 765 2007 21,469 4,650 3,127 573 12,179 710 2006 18,918 3,905 2,609 521 11,318 599 BABY CARE AND FAMILY CARE 2008 13,898 2,700 1,728 612 8,102 763 2007 12,726 2,291 1,440 671 7,731 769 2006 11,972 2,071 1,299 612 7,339 739 CORPORATE (1) 2008 (1,425) (2,035) (467) 181 69,580 193 2007 (963) (1,690) (931) 135 67,509 206 2006 (683) (1,413) (696) 8 66,205 93 TOTAL COMPANY (1) 2008 83,503 16,078 12,075 3,166 143,992 3,046 2007 76,476 14,710 10,340 3,130 138,014 2,945 2006 68,222 12,413 8,684 2,627 135,695 2,667 (1) 2006 data includes Gillette results for the nine months ended June 30, 2006.
  • 78.
    Amounts in millionsof dollars except per share amounts or as otherwise specified. 76 The Procter Gamble Company Notes to Consolidated Financial Statements NOTE 13 QUARTERLY RESULTS (UNAUDITED) Quarters Ended Sept 30 Dec 31 Mar 31 Jun 30 Total Year Net Sales 2007 – 2008 $20,199 $21,575 $20,463 $21,266 $83,503 2006 – 2007 18,785 19,725 18,694 19,272 76,476 Operating Income 2007 – 2008 4,418 4,714 4,111 3,840 17,083 2006 – 2007 4,054 4,350 3,646 3,400 15,450 Gross Margin 2007 – 2008 52.9% 51.8% 51.3% 49.2% 51.3% 2006 – 2007 52.8% 52.9% 51.6% 50.8% 52.0% Net Earnings 2007 – 2008 $  3,079 $  3,270 $  2,710 $  3,016 $12,075 2006 – 2007 2,698 2,862 2,512 2,268 10,340 Diluted Net Earnings Per Common Share 2007 – 2008 $   0.92 $   0.98 $   0.82 $   0.92 $   3.64 2006 – 2007 0.79 0.84 0.74 0.67 3.04
  • 79.
    The Procter Gamble Company 77 Corporate Officers CORPORATE COMPANY OPERATIONS A.G. Lafley Chairman of the Board and Chief Executive Officer Susan E. Arnold President — Global Business Units Robert A. McDonald Chief Operating Officer Clayton C. Daley, Jr. Vice Chairman and Chief Financial Officer Moheet Nagrath Global Human Resources Officer Bruce Brown Chief Technology Officer R. Keith Harrison, Jr. Global Product Supply Officer Steven W. Jemison Chief Legal Officer and Secretary Mariano Martin Global Customer Business Development Officer Charlotte R. Otto Global External Relations Officer Filippo Passerini President —  Global Business Services and Chief Information Officer Marc S. Pritchard Global Marketing Officer Jon R. Moeller Vice President and Treasurer Valarie L. Sheppard Vice President and Comptroller GLOBAL OPERATIONS Werner Geissler Vice Chairman —  Global Operations Deborah A. Henretta Group President —  Asia Laurent L. Philippe Group President —  Central Eastern Europe, Middle East Africa Steven D. Bishop President —  North America Giovanni Ciserani President —  Western Europe Daniela Riccardi President —  Greater China Jeffrey K. Schomburger President —  Global Wal-Mart Team Jorge A. Uribe President —  Latin America GLOBAL BEAUTY GROOMING Edward D. Shirley Vice Chairman —  Global Beauty Grooming Charles V. Bergh Group President —  Global Personal Care Christopher de Lapuente Group President —  Global Hair Care Juan Pedro Hernandez President —  Braun Virginia C. Drosos President —  Global Personal Beauty Robert Jongstra President —  Global Professional Care Hartwig Langer President —  Global Prestige Products GLOBAL HEALTH WELL-BEING Robert A. Steele Vice Chairman —  Global Health Well-Being Melanie Healey Group President —  Global Feminine Health Care Charles E. Pierce Group President —  Global Oral Care John P. Goodwin President —  Global Snacks Pet Care Jamie P. Egasti President —  Coffee Thomas M. Finn President —  Global Health Care GLOBAL HOUSEHOLD CARE Dimitri Panayotopoulos Vice Chairman —  Global Household Care Jorge S. Mesquita Group President —  Global Fabric Care Martin Riant Group President —  Global Baby Care David S. Taylor Group President —  Global Home Care Mark Bertolami President —  Duracell Mary Lynn Ferguson- McHugh President —  Family Care Sharon J. Mitchell Senior Vice President —  Research Development, Global Fabric Care The following company officers have announced their intention to retire during the 2008/09 fiscal year: Ravi Chaturvedi President —  Northeast Asia G. Gilbert Cloyd Chief Technology Officer James R. Stengel Global Marketing Officer
  • 80.
    78 The Procter Gamble Company Board of Directors Bruce L. Byrnes Retired Vice Chairman of the Board — Global Brand Building Training. Director since 2002. Also a Director of Cincinnati Bell Inc. Age 60. Mr. Byrnes retired from the Board of Directors following the Company’s June, 2008 Board meeting. Kenneth I. Chenault Chairman and Chief Executive Officer of the American Express Company (financial services). Appointed to the Board on April 21, 2008. Also a Director of International Business Machines Corporation. Age 57. Member of the Audit and Compensation Leadership Development Committees. Scott D. Cook Chairman of the Executive Committee of the Board, Intuit Inc. (software and web services). Director since 2000. Also a Director of eBay Inc. Age 56. Member of the Compensation Leadership Development and Innovation Technology Committees. Rajat K. Gupta Senior Partner Emeritus at McKinsey Company (international consulting). Director since 2007. Also a Director of The Goldman Sachs Group, Inc. Genpact, Ltd. and American Airlines. Age 59. Member of the Audit and Innovation Technology Committees. A.G. Lafley Chairman of the Board and Chief Executive Officer of the Company. Director since 2000. Also a Director of General Electric Company and Dell Inc. Age 61. Charles R. Lee Retired Chairman of the Board and Co-Chief Executive Officer of Verizon Communications Inc. (telecommunication services). Director since 1994. Also a Director of The DIRECTV Group, Inc., Marathon Oil Corporation, United Technologies Corporation and US Steel Corporation. Age 68. Chair of the Audit Committee and member of the Compensation Leadership Development Committee. Lynn M. Martin Former Professor at the J.L. Kellogg Graduate School of Management, Northwestern University and former Chair of the Council for the Advancement of Women and Advisor to the firm of Deloitte Touche LLP for Deloitte’s internal human resources and minority advancement matters. Director since 1994. Also a Director of ATT Inc., Ryder System, Inc., Dreyfus Funds and Constellation Energy Group, Inc. Age 68. Member of the Governance Public Responsibility and Innovation Technology Committees. W. James McNerney, Jr. Chairman of the Board, President and Chief Executive Officer of The Boeing Company (aerospace, commercial jetliners and military defense systems). Director since 2003. Age 59. Presiding Director, Chair of the Compensation Leadership Development Committee and member of the Governance Public Responsibility Committee. Johnathan A. Rodgers President and Chief Executive Officer of TV One, LLC (media and communications). Director since 2001. Also a Director of Nike, Inc. Age 62. Member of the Innovation Technology Committee. John F. Smith, Jr. Retired Chairman of the Board and Chief Executive Officer of General Motors Corporation (automobiles and related businesses) and retired Chairman of the Board of Delta Air Lines, Inc. Director since 1995. Also a Director of Swiss Reinsurance Company. Age 70. Mr. Smith retired from the Board of Directors following the Company’s April, 2008 Board meeting. Ralph Snyderman, M.D. Chancellor Emeritus, James B. Duke Professor of Medicine at Duke University. Director since 1995. Also a Director of Targacept, Inc. and a Venture Partner of NEA. Age 68. Chair of the Innovation Technology Committee and member of the Audit Committee. Margaret C. Whitman Former President and Chief Executive Officer of eBay Inc. (global internet company that includes online marketplaces, payments and communications). Director since 2003. Also a Director of eBay Inc. and Dreamworks Animation SKG, Inc. Age 52. Chair of the Governance Public Responsibility Committee and member of the Compensation Leadership Development Committee. Patricia A. Woertz Chairman, Chief Executive Officer and President of Archer Daniels Midland Company (agricultural processors of oilseeds, corn, wheat, and cocoa). Appointed to the Board on January 8, 2008. Age 55. Member of the Audit and Governance Public Responsibility Committees. Ernesto Zedillo Former President of Mexico, Director of the Center for the Study of Globalization and Professor in the field of International Economics and Politics at Yale University. Director since 2001. Also a Director of Alcoa Inc. and Electronic Data Systems Corporation. Age 56. Member of the Governance Public Responsibility and Innovation Technology Committees. The Board of Directors has FOUR committees: Audit Committee Compensation Leadership Development Committee Governance Public Responsibility Committee Innovation Technology Committee
  • 81.
    The Procter Gamble Company 79 Shareholder Information IF … You need online access or help with your account• You are interested in our certificate safekeeping service• You want to arrange for direct deposit or reinvestment of dividends• You have a lost, stolen or destroyed stock certificate• CALL PERSON-TO-PERSON Shareholder Services representatives are available• Monday – Friday, 9AM – 4PM EST at 1-800-742-6253 (call 1-513-983-3034 outside the USA and Canada) • Automated service available after USA business hours CONTACT PG — 24 HOURS A DAY Visit us online at www.pg.com/investor, where you can get stock• purchase information, transaction forms, Company annual reports and webcasts E-mail us at shareholders.im@pg.com• Call for financial information at 1-800-764-7483• COMMON STOCK PRICE RANGE AND DIVIDENDS Price Range 2007–2008 2007–2008 2006–2007 2006–2007 Quarter Ended High Low High Low September 30 $70.73 $60.89 $62.85 $55.25 December 31 75.18 67.90 64.73 61.50 March 31 73.81 62.74 66.30 60.42 June 30 71.20 60.44 64.75 60.76 Dividends Quarter Ended 2007–2008 2006–2007 September 30 $0.350 $0.310 December 31 0.350 0.310 March 31 0.350 0.310 June 30 0.400 0.350 DIVIDEND HISTORY PG has paid dividends without interruption since its incorporation in 1890, and has increased dividends each year for the past 52 fiscal years. Over the past 52 years, PG’s compound annual dividend growth has exceeded 9%. CORPORATE HEADQUARTERS The Procter Gamble Company P.O. Box 599 Cincinnati, OH 45201-0599 TRANSFER AGENT/SHAREHOLDER SERVICES The Procter Gamble Company Shareholder Services Department P.O. Box 5572 Cincinnati, OH 45201-5572 REGISTRAR The Bank of New York Trust Company, N.A. Corporate Trust Division 525 Vine Street, Suite 900 Cincinnati, OH 45202 EXCHANGE LISTING New York, Paris STOCK SYMBOL PG SHAREHOLDERS OF COMMON STOCK There were approximately 2,231,000 common stock shareowners, including shareholders of record, participants in the Shareholder Investment Program, participants in PG stock ownership plans and beneficial owners with accounts at banks and brokerage firms, as of June 30, 2008. FORM 10-K Shareholders may obtain a copy of PG’s 2008 report to the Securities and Exchange Commission on Form 10-K by going to www.pg.com/investor or by calling us at 1-800-764-7483. This information is also available at no charge by sending a request to Shareholder Services at the address listed above. The most recent certifications by our Chief Executive and Chief Financial Officer pursuant to Section 302 of the Sarbanes-Oxley Act of 2002 are filed as exhibits to our Form 10-K for the fiscal year ended June 30, 2008. We have also filed with the New York Stock Exchange the most recent Annual CEO certification as required by Section 303A.12(a) of the New York Stock Exchange Listed Company Manual. ANNUAL MEETING The next annual meeting of shareholders will be held on Tuesday, October 14, 2008. A full transcript of the meeting will be available from Susan Felder, Assistant Secretary. Ms. Felder can be reached at 299 East Sixth Street, Cincinnati, Ohio 45202-3315.
  • 82.
    80 The Procter Gamble Company Amounts in millions, except per share amounts 2008 2007 2006 2005 2004 2003 2002 2001 2000 1999 1998 Net Sales $  83,503 $  76,476 $  68,222 $56,741 $51,407 $43,377 $40,238 $39,244 $39,951 $38,125 $37,154 Gross Margin 42,808 39,790 35,097 28,869 26,264 21,155 19,159 17,071 18,395 16,901 16,019 Operating Income 17,083 15,450 13,249 10,469 9,382 7,312 6,073 4,260 5,678 6,130 5,581 Net Earnings 12,075 10,340 8,684 6,923 6,156 4,788 3,910 2,612 3,363 3,683 3,472 Net Earnings Margin 14.5% 13.5% 12.7% 12.2% 12.0% 11.0% 9.7% 6.7% 8.4% 9.7% 9.3% Basic Net Earnings per Common Share $    3.86 $    3.22 $    2.79 $   2.70 $   2.34 $   1.80 $   1.46 $   0.96 $   1.24 $   1.35 $   1.25 Diluted Net Earnings per Common Share 3.64 3.04 2.64 2.53 2.20 1.70 1.39 0.92 1.17 1.27 1.18 Dividends Per Common Share 1.45 1.28 1.15 1.03 0.93 0.82 0.76 0.70 0.64 0.57 0.51 Restructuring Program Charges (1) $ — $ — $ — $ — $ — $   751 $   958 $  1,850 $   814 $   481 $ — Research and Development Expense 2,226 2,112 2,075 1,940 1,802 1,665 1,601 1,769 1,899 1,726 1,546 Advertising Expense 8,667 7,937 7,122 5,929 5,466 4,487 3,782 3,729 3,906 3,542 3,638 Total Assets 143,992 138,014 135,695 61,527 57,048 43,706 40,776 34,387 34,366 32,192 31,042 Capital Expenditures 3,046 2,945 2,667 2,181 2,024 1,482 1,679 2,486 3,018 2,828 2,559 Long-Term Debt 23,581 23,375 35,976 12,887 12,554 11,475 11,201 9,792 9,012 6,265 5,774 Shareholders’ Equity 69,494 66,760 62,908 18,475 18,190 17,025 14,415 12,560 12,673 12,352 12,493 (1) Restructuring program charges, on an after-tax basis, totaled $538, $706, $1,475, $688 and $285 for 2003, 2002, 2001, 2000 and 1999, respectively. Financial Summary (Unaudited)
  • 83.
    The Procter Gamble Company 81 Shareholder Return Performance Graphs The following graph compares the five-year cumulative total return of PG’s common stock as compared with the SP 500 Stock Index, the Dow Jones Industrial Average Index, and a composite group comprised of the SP Household Products Index, the SP Paper Products Index, the SP Personal Products Index, the SP Health Care Index and the SP Food Index. The composite group is weighted based on PG’s current fiscal year revenues. The graph assumes $100 was invested on June 30, 2003 and that all dividends were reinvested. Comparison of five-year cumulative total return PG has paid dividends without interruption since its incorporation along with the increased dividends each year for the past 52 fiscal years. PG’s compound annual dividend growth rate has exceeded 9% over the last 52 years. dividends per share (split-adjusted) (in dollars) 2003 2004 2005 2006 2007 2008 PG 100 124 123 132 149 151 Composite Group 100 128 127 143 175 164 SP 500 100 119 127 138 166 144 DJIA 100 119 119 133 163 142 (in dollars; split-adjusted) 1956 1969 1982 1995 2008 Dividends per Share $0.01 $0.04 $0.13 $0.35 $1.45
  • 84.
    82 The Procter Gamble Company PG at a Glance Net Sales by GBU (1) GBU Reportable Segment Key Products Billion Dollar Brands (in billions) Beauty Beauty Cosmetics, Deodorants, Hair Care, Personal Head Shoulders, Olay, $ 27.8 Cleansing, Prestige Fragrances, Skin Care Pantene, Wella Grooming Blades and Razors, Electric Hair Removal Devices, Braun, Fusion, Gillette, Mach3 Face and Shave Products, Home Appliances HEALTH AND WELL-BEING Health Care Feminine Care, Oral Care, Personal Health Care, Actonel, Always, Crest, Oral-B $19.4 Pharmaceuticals Snacks, Coffee Coffee, Pet Food, Snacks Folgers, Iams, Pringles and Pet Care Household Care Fabric Care and Air Care, Batteries, Dish Care, Fabric Care, Ariel, Dawn, Downy, Duracell, $37.7 Home Care Surface Care Gain, Tide Baby Care and Baby Wipes, Bath Tissue, Diapers, Facial Tissue, Bounty, Charmin, Pampers Family Care Paper Towels (1) Partially offset by net sales in corporate to eliminate the sales of unconsolidated entities included in business unit results. Recognition PG is recognized as a leading global company, including a #5 ranking on Fortune’s “Global Most Admired Companies,” the #2 ranking on Fortune’s “Top Companies for Leaders” survey, the #4 ranking on Barron’s “World’s Most Respected List,” a #8 ranking on Business Week’s list of “World’s Most Innovative Companies,” top rankings on the Dow Jones Sustainability Index from 2000 – 2008, the “Advertiser of the Year” award at the 2008 Cannes International Advertising Festival, and a consistent #1 ranking within our industry on Fortune’s Most Admired list for 23 of 24 total years and for 11 years in a row. PG ranks among the top companies for Executive Women (National Association for Female Executives), African Americans (Working Mother and Black Enterprise Magazines), and Diversity (Diversity Inc.Magazine). Supplier diversity is a fundamental business strategy at PG. In 2008, PG again spent over $1.9 billion with minority- and women-owned businesses. Since 2005, PG has been a member of the Billion Dollar Roundtable, a forum of 14 corporations that spend more than $1 billion annually with diverse suppliers. Design:VSAPartners,Inc. The paper utilized in the printing of this annual report is certified by SmartWood to the FSC Standards, which promotes environmentally appropriate, socially beneficial and economically viable management of the world’s forests. The paper contains a mix of pulp that is derived from FSC certified well-managed forests; post-consumer recycled paper fibers and other controlled sources.
  • 85.
    At PG, sustainabilityis embedded into both our business strategy and our holistic view of innovation. By incorporating sustainability into the rhythm of our work, we delight consumers who want to make sustainable choices but do not want to make trade-offs in performance or value. We believe this is where PG innovation can make the most meaningful difference. By viewing innovation systemically through the lens of sustainability: We define innovation broadly, looking for sustainability opportunities at every touch-point along the path of our products. This definition encompasses raw materials, formulation, manufacturing, customization, logistics, customers, and consumers. In fact, we find that a big innovation in one part of the path often sparks innovations in other areas. For example, when we moved our line of liquid laundry detergents in North America to a 2x concentration, we delivered significant environmental improvements in water, energy, and CO2 usage as a result of the product / packaging changes and a significant reduction in distribution miles. In addition, we innovated in our customer interface to reduce solid waste. We invest in innovation to improve the environmental profile of our operations and products. In addition to investing in product development of more sustainable products, we have systematized the process of sustainably designing and building new facilities. In Box Elder, Utah, we recently broke ground on a state-of-the art manufacturing facility that will deliver improvements in energy, water, solid waste and indoor environmental quality. We manage innovation with discipline, using science-based, rigorous tools such as life cycle assessment (LCA). These tools aid in identifying sustainability opportunities for our products, from discovery through disposal to potential reuse. LCA shows that consumers use a vast amount of energy to heat water for laundry. We optimized Ariel laundry detergent to have excellent cleaning performance in cold water. We then partnered with several external thought leaders to educate consumers to “Turn to 30°C” to save energy, and we are making a measurable difference. In the UK, for example, this has helped move from 2% of consumers who washed in cold in 2002, to 17% today. In packaging, software has been developed that optimizes material use, leading to decreases in the amount of plastic used. This innovation has been shared externally and supported by WRAP (The Waste Resources Action Programme) in the UK. We deliver innovation with a balance of sustainable improvements, seen and unseen. Some improvements, like reducing waste with a smaller Bounty paper towel for smaller spills, are obvious product changes to the consumer. Others, such as innovations in our manufacturing operations, are not visible — yet they can deliver substantial sustainability improvements. For example, changes in our manufacturing processes over the last five years on Bounty and Charmin have reduced energy, CO2 and water usage. We lead innovation by inspiring our employees to take more personal responsibility in delivering the Company’s sustainability goals. This past Earth Day, we launched an employee engagement program called “Take the R for Tomorrow.” This program is already delivering results by increasing employee recycling and video collaboration instead of travel. Our people, along with our external partners, are also establishing innovative solutions to help improve the lives of millions of children in need through our PG Live, Learn and Thrive™ programs. In China recently, our employees proudly marked the opening of our 140th PG Hope School to help educate children in rural areas. While PG has a long track record of sustainability leadership and results, we recognize our impact as a global company and accept our responsibility for continual improvement. This is embedded in who we are and what we do. And, we will remain committed to helping solve the world’s sustainability challenges because we are designed to innovate, now and for generations to come. We invite you to learn more. Please visit www.pg.com/sustainability. Sustainability Innovation Improving quality of life, now and for generations to come
  • 86.
    © 2008 Procter Gamble 00046002