Download as PDF, PPTX
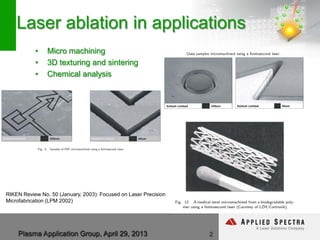
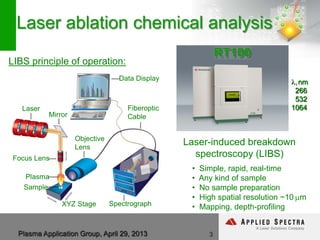
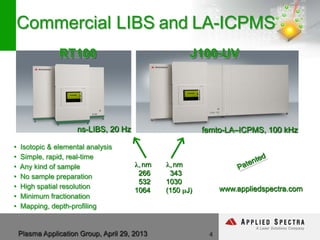
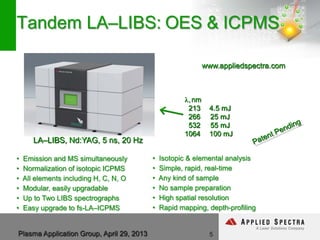
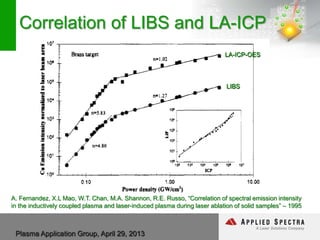


The document discusses advancements in laser ablation techniques combined with laser-induced breakdown spectroscopy (LIBS) and laser ablation-inductively coupled plasma mass spectrometry (LA-ICPMS) for real-time analysis of materials. It highlights applications in micro-machining, chemical analysis, and depth profiling, emphasizing rapid and high-resolution methods without sample preparation. The conclusions note the versatility and efficiency of these technologies across various fields, including electronics and pharmaceuticals.


![5G Explained! A High Level Overview [Introduction]](https://cdn.slidesharecdn.com/ss_thumbnails/5gexplainedahighleveloverview-260119165306-cc137a3e-thumbnail.jpg?width=640&height=640&fit=bounds)


