Download to read offline


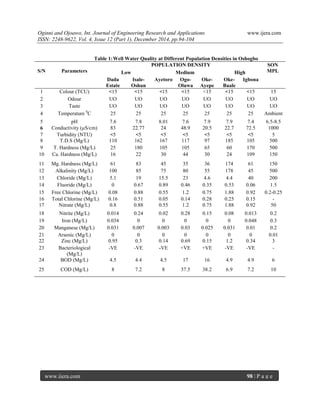


The study assessed the sanitation levels of water sources in Oshogbo, the capital of Osun State, Nigeria, by analyzing physicochemical and bacteriological parameters across various population densities. Out of 25 analyzed water sources, 8 parameters were found to exceed the permissible levels set by the Standards Organization of Nigeria, indicating polluted sources primarily in medium and high density areas. The findings highlight significant public health concerns and the need for improved water quality monitoring and sanitation efforts in the region.


![11.[26 37]five year plans and rural water supply in india](https://cdn.slidesharecdn.com/ss_thumbnails/11-26-37fiveyearplansandruralwatersupplyinindia-120512235625-phpapp02-thumbnail.jpg?width=640&height=640&fit=bounds)


