
Recommended
Recommended
More Related Content
Similar to Bacteriological Parameters of Obibia River in Amawbia, Awka South Local Government Area of Anambra State, Nigeria
Similar to Bacteriological Parameters of Obibia River in Amawbia, Awka South Local Government Area of Anambra State, Nigeria (20)
More from ijtsrd
More from ijtsrd (20)
Recently uploaded
Recently uploaded (20)
Bacteriological Parameters of Obibia River in Amawbia, Awka South Local Government Area of Anambra State, Nigeria
- 1. International Journal of Trend in Scientific Research and Development (IJTSRD) Volume 6 Issue 2, January-February 2022 Available Online: www.ijtsrd.com e-ISSN: 2456 – 6470 @ IJTSRD | Unique Paper ID – IJTSRD49125 | Volume – 6 | Issue – 2 | Jan-Feb 2022 Page 1334 Bacteriological Parameters of Obibia River in Amawbia, Awka South Local Government Area of Anambra State, Nigeria Dr. Ike, Chinelo Gloria1 ; Eze, H. C2 ; Obianom Vivian Amaka2 1 Department of Science Laboratory Technology, Federal Polytechnic, Oko, Anambra State, Nigeria 2 Department of Applied Microbiology and Brewery, Nnamdi Azikiwe University, Awka Anambra State, Nigeria ABSTRACT Nigeria has abundant surface and ground water, of which when polluted can be detrimental to human health. Obibia stream is an important water source in Amawbia-Nibo axis of Awka, Anambra State, Nigeria especially for its drinking purposes, urban agricultural usage and domestic uses. Water quality is often altered by anthropogenic activities, leachates and run off. It is therefore necessary to determine the influence of seasonal changes and its effects on the health of populace in this locality. The aim of this study is to evaluate the influence of seasonal changes on the bacteriological and physicochemical parameters of Obibia stream. Water samples were randomly and aseptically drawn monthly from different locations from the water body and assessed for bacteriological qualities using standard microbiological techniques. The bacterial isolates were characterized using the morphological, biochemical and molecular characteristics. The prevalence of the implicated isolates was ascertained by determining the occurrences of the isolates in both rainy and dry seasons. The physicochemical parameters were assessed using gravimetric, titrimetric and instrumentation techniques.. Bacteria isolates from sampling point were Escherichia coli strain T7E (ECT7E), Klebsiella pneumoniae strain GH27TC (KPGH27TC), Salmonella enterica subspecies enterica serovar Typhi strain R27 (STR27), Enterobacter aerogenes strain KCTC (EAKCTC), Shigella dysteriae strain 53-3937 (SD53), Pseudomonas aeruginosa strain PA01 (PAPA01), Staphylococcus aureus strain BPH2003 (SABPH2003), Enterococcus faecium strain E1774 (EFE1774), Vibrio cholerae strain C6706 (VCC6706) and Serratia marcescens strain SmUNAM836 (SMSm). ECT7E, STR27 and VCC6706 were mostly seen in both rainy and dry season. Therefore, adequate treatment before use and periodic evaluation of its bacteriological and physicochemical qualities are recommended. KEYWORDS: Obibia, Nibo, Escherichia coli, Pollution How to cite this paper: Dr. Ike, Chinelo Gloria | Eze, H. C | Obianom Vivian Amaka "Bacteriological Parameters of Obibia River in Amawbia, Awka South Local Government Area of Anambra State, Nigeria" Published in International Journal of Trend in Scientific Research and Development (ijtsrd), ISSN: 2456- 6470, Volume-6 | Issue-2, February 2022, pp.1334- 1345, URL: www.ijtsrd.com/papers/ijtsrd49125.pdf Copyright © 2022 by author (s) and International Journal of Trend in Scientific Research and Development Journal. This is an Open Access article distributed under the terms of the Creative Commons Attribution License (CC BY 4.0) (http://creativecommons.org/licenses/by/4.0) 1. INTRODUCTION Water is the basis of life and primary need for all vital processes. With increasing industrialization and population growth, water sources available for various purposes such as drinking, recreation, agriculture and aquaculture have been adulterated with industrial as well as animal and domestic wastes. As a result, it has become the most important means of transmission of several infectious diseases. Sewage contains solid and dissolved organic compound that impact an offensive odour and serves as excellent medium for growth and multiplication of microorganisms (Ekiye and Zejiao, 2010). Lakes, streams and rivers have important multi–usage components such as sources of drinking water, irrigation, fishery and energy production. Water is a scarce and fading resource, and its management can have an impact on the flow and the biological quality of streams and streams (Esharegoma et al., 2018). Water meant for drinking and cooking should be free from harmful microorganisms, harmful chemicals, IJTSRD49125
- 2. International Journal of Trend in Scientific Research and Development @ www.ijtsrd.com eISSN: 2456-6470 @ IJTSRD | Unique Paper ID – IJTSRD49125 | Volume – 6 | Issue – 2 | Jan-Feb 2022 Page 1335 suspended materials, undesirable taste, colour and odour. Drinking water from natural sources is usually polluted as a result of man’s activities, thus rendering supplies harmful to the body. This pollution results from eutrophication, introduction of sewage and also toxic wastes from industries into the water body. Pollution can be caused by the addition of harmful or undesirable micro-organisms to the water body (Ezeabasili, et al., 2014). According to American Public Health Association (2012), about 1.2 billion people globally lack safe drinking water, and 50% of the populace in developing countries still has no reasonable access to safe and sustained water supplies. Consumption of contaminated water usually result to a variety of water related diseases such as typhoid, hepatitis, cholera, acute diarrhea, schistosomiasis and dracunculiasis (Ezeabasili, et al., 2014). In Awka, the Anambra State capital, access to adequate urban water supply from the State’s water corporation is a serious problem facing the inhabitants since 1999. Hence, to meet their demand for potable water supply, the inhabitants of this State have survived by constructing water supply systems, reservoirs, wells and boreholes. Others patronize water vendors; rain water collected from roofs, streams and streams. Proliferation in the use of water from alternative sources, like shallow hand dug wells and boreholes, water from streams and streams, leads to the utilization of water with questionable qualities for domestic activities. Again, solid wastes are generated at a rate faster than they are disposed of by the designated authorities. Polluted water is the major reason for the spread of many endemic diseases like skin and eye infections, cholera, tuberculosis, typhoid, diarrhea, viral hepatitis A and even death. Mortality in children less than five years due to water related diseases annually is estimated to be about 4 million in under developed countries and World Health Organization also estimated that 3.4 million people, mostly children, die every year from water-related disease (Esharegoma et al. 2018). Water quality is defined in terms of the chemical, physical, and biological characteristics of water, usually in respect to its suitability for an intended purpose. Worldwide, indicator organisms such as the coli form bacterium, Escherichia coli and faecal streptococci have been used to assess faecal pollution and deterioration in fresh water sources such as lakes, streams, underground waters and streams (Esharegoma et al., 2018). The microbiological and physicochemical parameters of different fresh water systems (stream, stream, ocean etc.) have been studied by various researchers such as Esharegoma et al. (2018. Faecal contamination of streams is a major water quality issue in many fast growing cities where population growth far exceeds the rate of development of wastewater collection and treatment. Esharegoma et al. (2018) in their study reported that in the rainy season, the mean bacterial counts ranged from 1.1 ± 0.4 x 10³ cfu/ ml to 8.6 ± 6.7 x 10³ cfu/ml for the downstream and from 0.9 ± 0.5 x 10³ cfu/ml to 3.4 ± 2.8 x 10³ cfu/ml for the upstream. In the dry season, the mean bacterial counts ranged from 0.1 ± 0.07 x 10³ cfu/ml for the upstream to 1.1 ± 0.4 x 10³ for downstream. In the rainy season, the mean fungal counts ranged from 0.5 ± 0.3 x 10³ cfu/ml for the downstream to 2.7 ± 1.6 x 10³ cfu/ml for the upstream. In the dry season, the mean fungal counts ranged from 1.3 ± 0.8 x 10³ cfu/ml for the downstream to 1.4 ± 0.8 x 10³ cfu/ml for the upstream. Bacterial isolates from the sampling points were Bacillus subtilis, Klebsiella oxytoca, Alkaligenes facaelis, Escherichia coli, Staphylococcus aureus, Bacillus cereus, Pseudomonas fluorescens, Enterococcus facaelis, Citrobacter freundii, and Enterobacter aerogenes while fungal isolates were Penicillium digitatum, Aspergillus flavus, Aspergillus niger, Fusarium oxysporium, Trichoderma sp, Mucor sp. and Saccharomyces sp. This studyinvestigated the influence of seasonal changes on the bacteriological parameters of Obibia stream, Awka, Anambra State, Nigeria. THREATENED AND HALF HAZARD HYDROLOGICAL CYCLE As a result of out- changing climate, hydrological cycle is undergoing a drastic and negative changes in water formation. There is a half hazard and inadequate water formation and as such, seasonal and orderly well formed rain fall seasonally comes in and out of season. Worst still, sometimes it becomes thunderous and with devastating flood while we still experience scanty territorial rain fall that ends as soon as it starts. PRE DISPOSING FACTORS THAT MELITATES ON SUCH HAZARDS. 1. Air pollution of sulphur dioxide from bush burning, industrial flames from large industrial plants and oil refineries. Worst still is our Ajeokuta steel industry. 2. Occluding water bodies with decomposable waste which minimizes and limits the amount of clean water that can evaporate into the atmosphere, form water molecules with hydrogen and oxygen, condescend, precipitate and fall back to the
- 3. International Journal of Trend in Scientific Research and Development @ www.ijtsrd.com eISSN: 2456-6470 @ IJTSRD | Unique Paper ID – IJTSRD49125 | Volume – 6 | Issue – 2 | Jan-Feb 2022 Page 1336 troposphere, biosphere, lithosphere and still into the hydrosphere. 3. Impact of certain Bacteria such as the sulphur Oxidizing Bacteria on our hydrospheric melius. Certain Bacteria are able to utilize soil materials as a carbon source and thus hydrolysis action of such bacteria leaches the soil and degrades (wear out and down) the soil strata layers breaking the tiochic layer in each soil strata from the bed to the river bank. As a result, this Tiochic plate holding each layer bed tear and gives way to Top soils falling into a clasping mass forming rifts and eventually gully formation. This is a major hazard in the banks of our aquatic melius 2. MATERIALS AND METHODS 2.1. Study Area Stream Obibia is a stream (class H - Hydrographic) in Nigeria (Africa) with the region font code of Africa/Middle East (Awka). Its coordinates are 6°13'60" N and 7°9'0" E in DMS (Degrees Minutes Seconds) or 6.23333 and 7.15 (in decimal degrees). Stream Obibia is situated and surrounded by tributaries from parts of Nibo, Amawbia, Umuawulu and Awka towns in Awka South Local Government of Anambra State. The Obibia Stream is the source of water supply for domestic and agricultural purposes in the eastern parts of the town. 2.2. Sample Collection as described by APHA (2012). A total of 30 freshwater samples from different sampling sources or sites along Obibia Stream were collected from May, 2015 to July, 2015 which represent the rainy season and December, 2015 to February, 2016 which represent the dry season. Samples were taken from five different sites in duplicates. The first source (site one) was where washing of bitter leaf, cassava steeping and processing of other foods were done. Source two was the site for bathing and swimming, source three was situated where runoff from car wash and block industry entered the water, source four was where drinking water was collected and source five was where run off from steep-sloped agricultural land entered the water. On each occasion, two 500 ml water samples were collected in 1 L sterile containers from each site. The containers were initially washed with detergent and thereafter rinsed with sterile distilled water. The containers were also rinsed with the water samples at the point of collection before being transferred immediately into cooler containing ice packs and transported to Chukwuemeka Odumegwu Ojukwu Microbiology laboratory for processing within 24 h of collection. These water samples were collected separately for physicochemical and bacteriological analyses. 2.3. Bacteriological Analysis of the Water Samples as described by APHA (2012) 2.3.1. Preparation of the media The following media were used for culturing: Nutrient agar (total heterotrophic aerobic bacterial counts), MacConkey Agar (Total coliform counts), Eosin methylene blue agar (Faecal coliform counts), Salmonella – Shigella Agar (Salmonella – Shigella count) and Thiosulphate Citrate Bile Sucrose Agar (Total vibrio counts). All the media were prepared according to the specifications of the manufacturer. 2.3.2. Sterilization of materials All the materials and prepared media were sterilized by autoclaving at 121 º C for 15 minutes and other glasswares were sterilized in the laboratory hot air oven at a temperature of 180 º C for 1 hr before use. 2.3.3. Dilution of samples A ten-fold serial dilution of the samples was carried out by adding 1 ml of water samples aseptically into test tubes containing 9 ml of sterile peptone water labeled 10-1 to 10-10 dilution, with the aid of sterile pipettes until the last test tube. 2.4. Isolation of bacteria 2.4.1. Total aerobic count 2.4.1.1. Determination of total heterotrophic aerobic bacterial counts The total heterotrophic aerobic bacterial counts of the water samples were obtained using spread plate method. With the aid of a sterile pipette, 0.1 ml aliquots of the 10-3 dilution were spread plated on the surfaces of the nutrient agar (NA) plate in triplicates with the aid of a glass spreader. The spreader was sterilized after each successive spreading by dipping it in 70 % ethanol and then passing it through flame of a Bunsen burner. The inoculated plates were then incubated by inversion at 37 °C for 24 h. The total heterotrophic aerobic bacterial counts were determined after incubation using an electric colony counter and colonies counted were expressed at CFU/ml as described by APHA (2012). 2.4.1.2. Determination of total faecal and total coliform counts The faecal coliform counts of the water samples were obtained using spread plate method. . With a sterile pipette, 0.1 ml aliquots of the 10-3 dilution were spread plated on the surfaces Eosin methylene blue (EMB) agar plates in triplicates while MacConkey agar (MA) was used for total coliform counts, with the aid of a glass spreader. The spreader was
- 4. International Journal of Trend in Scientific Research and Development @ www.ijtsrd.com eISSN: 2456-6470 @ IJTSRD | Unique Paper ID – IJTSRD49125 | Volume – 6 | Issue – 2 | Jan-Feb 2022 Page 1337 sterilized after each successive spreading by dipping it in 70 % ethanol and then passing it through flame of a Bunsen burner. The inoculated plates were then incubated inverted at 45 °C for 24 h. The total faecal and total coliform counts were determined after incubation using an electric colony counter and colonies counted were expressed as CFU/ml as described by APHA (2012). 2.4.1.3. Determination of total Salmonella – Shigella counts The Salmonella–Shigella counts of the water samples were obtained using spread plate method. With a sterile pipette, 0.1 ml aliquots of the 10-3 dilution were spread plated on the surfaces of the Salmonella– Shigella agar (SSA) plate in triplicates with the aid of a glass spreader. The spreader was sterilized after each successive spreading by dipping it in 70 % ethanol and then passing it through flame of a Bunsen burner. The inoculated plates were then incubated inverted at 37 °C for 24 h. The Salmonella – Shigella counts were determined after incubation using an electric colony counter and colonies counted were expressed at CFU/ml as described by APHA (2012). 2.4.1.4. Determination of total Vibrio counts The Vibrio counts of the water samples were obtained using spread plate method. With a sterile pipette, 0.1 ml aliquots of the 10-3 dilution were spread plated on the surfaces of the thiosulphate citrate bile sucrose agar (TCBS) plate in triplicates with the aid of a glass spreader. The spreader was sterilized after each successive spreading by dipping it in 70 % ethanol and then passing it through flame of a Bunsen burner. The inoculated plates were then incubated inverted at 37 °C for 24 hr. The Vibrio counts were determined after incubation using an electric colony counter and colonies counted were expressed as CFU/ml as described by APHA (2012). 2.4.1.5. Purification and maintenance of bacterial colonies Colonies were purified by sub culturing using the streak plate method. Isolates that grew on the plates were further sub-cultured on Bijou bottles where they were preserved at 4 °C in refrigerator as described by Ekhaise and Nkwelle (2011). 2.5. Characterization and Identification of the Isolates The isolates were characterized and identified using their morphological description, biochemical reactions and molecular characteristics as described by Ekhaise and Nkwelle (2011) as follows: 2.5.1. Morphology 2.5.1.1. Colony morphology The colonies were sub cultured and cultural morphological properties such as appearance, edge, consistency, optical properties, elevation, and pigmentation characteristics of the selected bacterial strains were observed and noted. 2.5.1.2. Microscopic morphology 2.5.1.2.1. Gram staining This technique divides bacteria into Gram positive and Gram negative groups. A smear of the isolate was made on clean dry grease-free slide, using a sterile wire loop. The smear was air-dried and heat fixed by passing over flame quickly three times. It was then covered with 0.5 % crystal violet solution for 1 minute and rinsed with distilled water. The slide was flooded with 1 % Gram’s iodine (which served as a mordant that fixes the dye inside the cell). The iodine was washed off after one minute and 95 % ethanol was used to decolorize the smear for 30 seconds. The smear was counter-stained with 0.1 % safranin dye solution for one minute. It was then washed off and the slide air - dried, and observed under the microscope using oil immersion objective lens after placing a drop of oil immersion. Gram positive and negative reactions were indicated by purple and red colours respectively. 2.5.1.3. Motility test Nutrient broth was supplemented with 0.2 % agar, dispensed into test tubes and sterilized byautoclaving at 121 º C and 15 psi2 for 15 minutes. The microorganism was stabbed into the sterilized media contained in a sterile test tube, using a sterile inoculating needle. It was incubated for 18-24 h at 35- 370 C and observed for diffused lines of turbidity emerging from the original line of inoculation. 2.5.2. Biochemical Reactions The following biochemical tests were carried out: 2.5.2.1. Citrate utilization test Slant of Simmon’s citrate agar were prepared according to the manufacturer’s instructions. The slants were inoculated by streaking over the surface with a loopful of an 18 h old culture and incubated at 37 ° C for 48 h. Positive results were indicated by the growth on agar and a change in colour from green to blue and absence of colour change indicates a negative result. 2.5.2.2. Indole test Tryptone - broth was prepared and 5 ml was dispensed into each test tube and sterilized. The isolates were inoculated into the test tube and incubated at 28 º C for 48 h. After incubation, 5 drops of Kovac’s reagent (4 – p – dimethyl - amino benzaldehyde) were added to the tubes, shaken gently and allowed to settle. A red coloration in alcohol dye indicates a positive result for the reaction.
- 5. International Journal of Trend in Scientific Research and Development @ www.ijtsrd.com eISSN: 2456-6470 @ IJTSRD | Unique Paper ID – IJTSRD49125 | Volume – 6 | Issue – 2 | Jan-Feb 2022 Page 1338 2.5.2.3. Sugar fermentation test This test determined the ability of the isolates to ferment glucose, lactose, and also ability to produce gas. The fermentation medium contained 1 % peptone water and 5 drops of 0.2 % bromothymol blue indicator solution. Then, 9 ml of medium was dispensed into clean dry test tubes in which Durham tubes had been dropped (inverted and without air space) and sterilized by autoclaving at 121 º C and 15 psi2 for 15 minutes. 1 ml of the sterile 5 % test sugar solution was added to medium and inoculated with a loopful of the test organisms and incubated at 30 º C for 24 h. A change in colour of the medium (from blue to yellow) was recorded as positive reaction, while presence of gas in Durham tubes indicates gas production 2.5.2.4. Oxidase test A loopful of isolates was transferred into pieces of Whatman No. 1 filter paper, impregnated with a solution of freshly prepared oxidase test reagent (N, N, N`, N` tetra-methyl-phenylene diamine) and smeared. Oxidation of the phenylene diamine in the reagent to dark purple or blue color within 10 seconds indicated a positive result. 2.5.2.5. Hydrogen sulphide production test Triple sugar iron agar slants were prepared and each isolates were inoculated into test tubes by streaking the inocula across the top of the slants and stabbing the slant tubes to the bottom. Tubes were incubated at 28 º C for 24 h. Positive result is indicated by the formation of black color coupled with displacement of the agar slant and red to yellow colour observation. 2.5.2.6. Catalase test The test identifies organisms that produce the enzyme catalase. A drop of 30 % freshly prepared hydrogen peroxide (3 ml H2O2 in 7 ml H2O) was placed on a clean slide and loopful of isolate was transferred into it and emulsified. The appearance of gas bubbles indicates positive reaction. The reagent was shaken before the test to expel any dissolved oxygen and avoid a false positive result as described by Ekhaise and Nkwelle (2011). 2.5.2.7. Coagulase test The test determines the abilities of organisms to produce the enzyme coagulase which causes plasma to clot by converting fibrinogen to fibrin. A loopful of each isolate was transferred into a drop of distilled water placed on slides and emulsified, followed by transfer of loopfuls of plasma cells to each of the suspensions and mixed gently. Clumping of the organisms within 10 seconds indicates a positive result as described by Eze et al., 2013). 3. RESULTS 3.1. Bacteriological Indices of the Water Samples 3.1.1. Total aerobic count in wet season The mean plate counts of bacteria isolated from the five sources collected in the month of May, 2015 of wet season were shown in Table 1. The results revealed that the difference in the total coliform counts (TCC), faecal coliform counts (FCC), Salmonella and Shigella (SS) counts and Vibrio counts (VC) between each of the samples were significant (P < 0.05) while total heterotrophic aerobic count (THAB) was insignificant. The table presented that the THAB count in sample 5 was insignificantly (P > 0.05) greater than that of samples 2, 3 and 4 and insignificantly (P > 0.05) lesser than that of sample 1. The TCC in sample 5 was shown to be significantly (P < 0.05) greater than the TCC count in samples 2, 3 and 4 but insignificantly (P > 0.05) less than the TCC count in sample 1. The SS count in sample 5 was significantly (P < 0.05) greater than the SS count in sample 4, insignificantly (P > 0.05) less than the SS count in samples 1 and 3 and insignificantly (P > 0.05) greater than the SS count in sample 2. Vibrio count in sample 5 was shown to be significantly (P < 0.05) greater than the Vibrio count in samples 2 and 4 and insignificantly (P > 0.05) greater than the Vibrio count in samples 1 and 3. The results of the present study revealed that sample 5 has the largest enteric organisms and samples 2 and 4 had the lowest, while sample 1 had the highest heterotrophic bacterial count and sample 4 had the least.
- 6. International Journal of Trend in Scientific Research and Development @ www.ijtsrd.com eISSN: 2456-6470 @ IJTSRD | Unique Paper ID – IJTSRD49125 | Volume – 6 | Issue – 2 | Jan-Feb 2022 Page 1339 Table 1: Mean plate counts of bacteria isolated from the five sources collected in the month of May, 2015 of wet season. Source THABC (x103 CFU/ml) TCC (x103 CFU/ml) COUNT FCC (x103 CFU/ml) SSC (x103 CFU/ml) VC (x103 CFU/ml) 1 99.00 4.24 46.00 5.66 31.00 2.83 19.00 0.00 5.00 1.41 2 64.00 1.41 26.00 1.41 5.00 0.00 5.00 1.41 2.50 2.12 3 79.00 12.73 36.00 5.66 18.00 2.83 13.00 7.07 10.00 4.24 4 55.00 7.07 20.00 0.00 15.00 4.24 2.00 0.00 1.50 0.71 5 85.00 21.21 55.00 14.14 30.00 7.07 12.00 0.00 10.00 2.83 Who Standard 1.0 x 10² Zero per 100ml Zero Zero Zero THABC = Total heterophic aerobic bacteria count; TCC = Total coliform count; FCC = Faecal coliform count; SSC= Salmonella –Shigella count; VC = Vibrio count. The mean plate counts of bacteria isolated from the five sources collected in the month of June, 2015 of wet season were shown in Table 2. The results revealed that the difference in the THAB counts, FCC counts, SS counts and the Vibrio counts between each of the samples were significant (P < 0.05), while the difference in the TC counts was insignificant (P > 0.05). The results revealed that the THABC in sample 4 was significantly (P < 0.05) less than the THABC in samples 1, 2, 3 and 5. The TCC in sample 4 was significantly (P < 0.05) less than the TCC in samples 2 and 5 and insignificantly (P > 0.05) less than the TCC in samples 1 and 3. The FCC in sample 3 was significantly (P < 0.05) greater than the FCC in samples 1, 2, 4 and 5. The SSC and VC in sample 2 was significantly (P < 0.05) greater than the SSC and VC in samples 1, 3, 4 and 5. The table also revealed that sample 2 had the highest number of enteric organisms while sample 4 had the least. It also revealed that sample 1 had the highest THABC while sample 4 had the least THABC. Table 2: Mean plate counts of bacteria isolated from the five sources collected in the month of June, 2015 of wet season. Source THABC (x103 CFU/ml) TCC (x103 CFU/ml) COUNT FCC (x103 CFU/ml) SSC (x103 CFU/ml) VC (x103 CFU/ml) 1 125.00 14.14 55.00 2.83 38.00 2.83 21.00 1.41 19.00 1.41 2 108.00 14.14 65.00 7.07 29.00 0.00 45.00 9.90 55.00 7.07 3 95.00 7.07 60.00 25.46 48.00 2.83 25.00 0.00 32.00 2.83 4 53.00 7.07 31.00 1.41 10.00 0.00 15.00 4.24 2.00 1.41 5 100.00 28.28 62.00 4.24 35.00 5.66 17.00 2.83 11.00 0.00 Who Standard 1.0 x 10² Zero per 100ml Zero Zero Zero THABC = Total heterophic aerobic bacteria count; TCC = Total coliform count; FCC = Faecal coliform count; SSC= Salmonella –Shigella count; VC = Vibrio count. The mean plate counts of bacteria isolated from the five sources collected in the month of July, 2015 of wet season were shown in Table 3. The results of the present study revealed that there was a significant difference (P < 0.05) between the THABC, TCC, FCC, SSC and VC of each of the samples collected. The results from the present study showed that the THABC, TCC and FCC in sample 5 were significantly (P < 0.05) greater than the THABC, TCC and FCC in samples 1, 2, 3 and 4. Also, the SSC and VC in sample 5 were significantly (P < 0.05) greater than the SSC and VC in samples 1, 3 and 4 and insignificantly (P > 0.05) greater than the SSC and
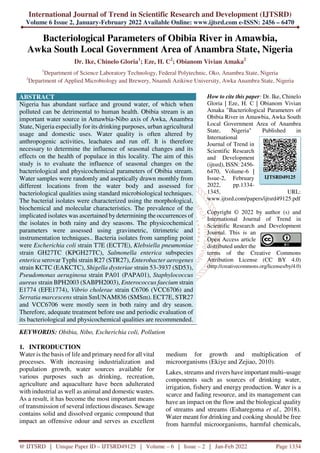
- 7. International Journal of Trend in Scientific Research and Development @ www.ijtsrd.com eISSN: 2456-6470 @ IJTSRD | Unique Paper ID – IJTSRD49125 | Volume – 6 | Issue – 2 | Jan-Feb 2022 Page 1340 VC in sample 2. The table also showed that the highest THABC and enteric organisms were found in sample 5 while the lowest THABC and enteric counts were found in sample 4. Table3: Mean plate counts of bacteria isolated from the five sources collected in the month of July, 2015 of wet season. Source THABC (x103 CFU/ml) TCC (x103 CFU/ml) COUNT FCC (x103 CFU/ml) SSC (x103 CFU/ml) VC (x103 CFU/ml) 1 130.00 14.14 55.00 0.00 42.00 2.83 25.00 1.41 22.00 4.24 2 110.00 28.28 66.00 4.24 35.00 7.07 49.00 9.90 45.00 5.66 3 95.00 1.41 69.00 4.24 48.00 7.07 35.00 0.00 33.00 5.66 4 54.00 7.41 36.00 8.49 20.00 1.41 18.00 4.24 18.00 1.41 5 260.00 5.66 100.00 14.14 75.00 8.49 60.00 2.83 53.00 5.66 Who Standard 1.0 x 10² Zero per 100ml Zero Zero Zero THABC = Total heterophic aerobic bacteria count;TCC = Total coliform count; FCC = Faecal coliform count; SSC= Salmonella –Shigella count; VC = Vibrio count. The total mean plate counts of bacteria isolated from the five sources collected in the months of May, June and July 2015 of the wet season were presented in Figure 1. The result revealed that there was significant difference (P < 0.05) between the THABC, TCC, FCC, SSC and VC of the samples in each month. The result showed that the THABC, TCC, FCC and VC in the month of July was significantly (P < 0.05) greater than the THABC, TCC, FCC, SSC and VC in the months of May and June. The results of the present study also revealed that the highest THABC and enteric bacteria were found in the month of July followed by the month of June. The least THABC and enteric bacteria count was found in the month of May. The table also revealed that there was seasonal influence on the concentration of the microorganisms found in the samples in each month. Figure 1: Total mean plate counts of bacteria isolated from the five sources collected in the months of May, June and July 2015 of the wet season
- 8. International Journal of Trend in Scientific Research and Development @ www.ijtsrd.com eISSN: 2456-6470 @ IJTSRD | Unique Paper ID – IJTSRD49125 | Volume – 6 | Issue – 2 | Jan-Feb 2022 Page 1341 3.1.2. Total aerobic count in dry season The mean plate counts of bacteria isolated from the five sources collected in the month of December, 2015 of dry season are shown in Table 4. The results revealed that the difference in the FCC counts between each of the samples was not significant (P > 0.05), while the difference in the THAB counts, TC counts, SS counts and Vibrio counts between each of the samples were significant (P < 0.05). The table also presented that the THAB count in sample 5 was insignificantly (P > 0.05) greater than that of samples 2, 3 and 4 and insignificantly (P > 0.05) less than that of sample 1. The TCC count in sample 1 was shown to be significantly (P < 0.05) greater than the TCC count in samples 2, 3 and 4 but insignificantly (P > 0.05) less than the TC count in sample 5. The SS count in sample 3 was significantly (P < 0.05) greater than the SS count in sample 2, 4, and 1 and insignificantly (P > 0.05) less than the SS count in samples 5. Vibrio count in sample 3 was shown to be significantly (P < 0.05) greater than the Vibrio count in samples 2 and 5 and insignificantly (P > 0.05) less than the Vibrio count in samples 1 and 4. The results of the present study revealed that sample 5 has the largest enteric organisms and samples 2 and 4 had the lowest, while sample 1 had the highest heterotrophic bacterial count and sample 4 had the least. Table 4: Mean plate counts of bacteria isolated from the five sources collected in the month of December, 2015 of dry season. Source THABC (x103 CFU/ml) TCC (x103 CFU/ml) COUNT FCC (x103 CFU/ml) SSC (x103 CFU/ml) VC (x103 CFU/ml) 1 92.00 3.05 46.00 2.00 28.00 2.00 13.00 1.15 9.00 1.00 2 63.00 3.05 26.00 2.00 19.00 1.00 8.00 2.00 5.00 5.7 3 72.00 2.00 34.00 3.05 14.00 2.00 14.00 2.00 8.00 0.57 4 54.00 2.51 28.00 3.05 34.33 1.50 6.00 1.50 12.00 2.00 5 80.00 2.00 54.00 3.05 34.00 1.70 20.00 2.00 5.60 0.57 Who Standard 1.0 x 10² Zero per 100ml Zero Zero Zero THABC = Total heterophic aerobic bacteria count; TCC = Total coliform count; FCC = Faecal coliform count; SSC= Salmonella –Shigella count; VC = Vibrio count. The mean plate counts of bacteria isolated from the five sources collected in the month of January, 2016 of dry season are shown in Table 5. The results revealed that the difference in the THAB counts, TCC counts FCC counts, SS counts and the Vibrio counts between each of the samples were significant (P < 0.05). The results revealed that the THABC in sample 5 was significantly (P < 0.05) less than the THABC in samples 1, 2 and 3 and insignificantly (P > 0.05) less than sample 4. The TCC in sample 4 was significantly (P < 0.05) greater than the TCC in samples 1 and 5 and insignificantly (P > 0.05) less than the TCC in samples 2 and 3. The FCC in sample 3 was significantly (P < 0.05) greater than the FCC in samples 1, 2, 4 and 5. The SSC in sample 2 was significantly (P < 0.05) greater than the SSC in samples 1, 3, 4 and 5. The VC in sample 3 was significantly (P < 0.05) less than the VC in samples 1, 2, 4 and 5. The table also revealed that sample 2 had the highest number of enteric organisms while sample 1 had the least. It also revealed that sample 1 had the highest THABC while sample 5 had the least THABC.
- 9. International Journal of Trend in Scientific Research and Development @ www.ijtsrd.com eISSN: 2456-6470 @ IJTSRD | Unique Paper ID – IJTSRD49125 | Volume – 6 | Issue – 2 | Jan-Feb 2022 Page 1342 Table 5: Mean plate counts of bacteria isolated from the five sources collected in the month of January, 2016 of dry season. Source THABC (x103 CFU/ml) TCC (x103 CFU/ml) COUNT FCC (x103 CFU/ml) SSC (x103 CFU/ml) VC (x103 CFU/ml) 1 76.00 1.52 29.00 2.08 38.00 2.00 20.00 1.52 11.60 1.00 2 62.00 3.00 55.00 3.05 46.00 1.52 30.00 2.00 9.00 0.57 3 52.00 2.00 51.00 3.78 14.00 2.00 16.00 2.00 5.00 1.00 4 49.00 3.05 47.00 1.00 33.00 0.05 10.00 1.00 12.00 1.00 5 45.00 3.05 39.00 2.08 27.00 2.64 13.00 1.52 11.00 2.70 Who Standard 1.0 x 10² Zero per 100ml Zero Zero Zero THABC = Total heterophic aerobic bacteria count; TCC = Total coliform count; FCC = Faecal coliform count; SSC= Salmonella –Shigella count; VC = Vibrio count. Table 6 shows the results of the mean plate counts of bacteria isolated from the five sources collected in the month of February, 2016 of dry season. The results of the present study revealed that there was a significant difference (P < 0.05) between the THABC, TCC, FCC and SSC of each of the samples collected but there was no significant difference (P > 0.05) between the VC in each of the samples. The results from the present study showed that the THAB counts in sample 1 was significantly (p < 0.05) greater than THAB counts in samples 2, 3 4, and 5. The TCC counts in sample 5 was insignificantly (p > 0.5) less than sample 4 and significantly (p < 0.5) less than TCC counts in 1, 2 and 3. Also, the SSC and VC in sample 5 were significantly (P < 0.05) greater than the SSC in samples 1, 2, 3, 4 and 5. The result revealed that the VC counts in sample 1 was insignificantly (P > 0.05) greater than the VC in samples 2, 3, 4 and 5. The table also showed that the highest enteric organisms were found in sample 2 while the lowest enteric counts were found in sample 5 while the highest THAB count was found in sample 1 and the lowest sample 4. Table6: Mean plate counts of bacteria isolated from the five sources collected in the month of February, 2016 of dry season. Source THABC (x103 CFU/ml) TCC (x103 CFU/ml) COUNT FCC (x103 CFU/ml) SSC (x103 CFU/ml) VC (x103 CFU/ml) 1 66.00 1.125 38.00 2.08 39.00 2.00 30.00 1.00 11.00 2.51 2 58.00 2.00 44.00 2.00 42.00 4.10 24.33 1.52 10.00 2.51 3 55.00 3.05 42.00 2.00 24.00 2.00 19.00 1.15 8.00 0.57 4 48.00 2.00 30.00 1.00 22.00 0.057 19.00 1.52 9.00 1.15 5 53.00 2.50 28.00 1.15 32.00 8.20 15.00 0.57 12.00 2.06 Who Standard 1.0 x 10² Zero per 100ml Zero Zero Zero THABC = Total heterophic aerobic bacteria count; TCC = Total coliform count; FCC = Faecal coliform count; SSC= Salmonella –Shigella count; VC = Vibrio count. The total mean plate counts of bacteria isolated from the five sources collected in the months of December, January and February, 2015 - 2016 of the dry season are presented in Figure 2. The result revealed that there was significant difference (P < 0.05) between the THABC, TCC, FCC, SSC and VC in all of the samples in each month. The result showed that the THABC, TCC and FCC in the month of December was significantly (P < 0.05) greater than the THABC, TCC and FCC in the months of January and February. The SSC in the month of December was shown to be significantly (P < 0.05) greater than the SSC in the months of February and January.
- 10. International Journal of Trend in Scientific Research and Development @ www.ijtsrd.com eISSN: 2456-6470 @ IJTSRD | Unique Paper ID – IJTSRD49125 | Volume – 6 | Issue – 2 | Jan-Feb 2022 Page 1343 The results of the present study also revealed that the highest THABC and enteric bacteria were found in the month of December followed by the month of January. The least THABC and enteric bacterial count was found in the month of February. The table also revealed that there was seasonal influence on the concentration of the microorganisms found in the samples in each month. Figure 2: Total mean plate counts of bacteria isolated from the five sources collected in the months of December, January and February, 2015 - 2016 of the dry season 4. Discussion Water is known as a universal solvent that is used for many purposes such as domestic uses which includes drinking, cooking, washing and toilet uses among others. Apart from domestic uses, water is required for industrial and commercial purposes as seen in brewing, soft drink, pharmaceutical, bottled water, wine and milk production outfits. One of the major concerns of this present day is to ensure that water used for both domestic and industrial purposes remain free from odour, colour, taste, hardness and microbial contamination (Eze et al., 2013; Ouma et al., 2016). The bacterial counts for all the water samples were generally high, exceeding the standard limit for drinking water. The primary sources of these bacteria in water are animal and human source. The highest THABC, TCC and FCC found in the rainy season could be attributed to the presence of human activities and runoff from agricultural land containing faecal matter, fertilizers and other contaminants at the sites where these samples were collected. The human activities include processing of foods like bitter leaf and steeping of cassava. The fermentation of cassava and other carbohydrate containing foods can increase the possibility of microorganisms dominating such sites. Higher number of THABC, TCC and FCC were also obtained at these same sites in the month of June and July. Ezenwaji et al. (2016) recorded that increase in biomass of bacteria was as a result of the fermentation of cassava in the cassava steeping site. Similar findings were also reported by different researchers (Eze et al., 2013: Ekhaise and Nkwelle, 2011). The variations in the VC, SSC from the various samples could be attributed to the rate and amount of runoff from faecal contaminated land as a result of high precipitation (rainfall) and direct dumping of dirt or defecation in the body of water. Eze et al. (2013) observed that periods of heavy precipitation can re-suspend bottom sediments and increase turbidity, microbial loading, colour and other contaminants. Similar findings were observed by few researchers (Ezenwaji and Orji, 2010; Eze et al., 2013). The lowest amount of microbial contaminants observed in the months of May, June and July could be attributed to ability of that area of the stream to purify itself. It appears that citizens at Amawbia use their intuition in determining the less contaminated sections of the stream to obtain water for drinking and cooking. However, the water samples did not meet the WHO standard and are not potable. Some researchers (Akubuenyi et al., 2013; Eze et al., 2013) also observed similar findings. The general comparison of the studies carried out from May to July revealed that the microbial isolates from the samples collected in July were significantly higher than the microbial isolates collected in the months of
- 11. International Journal of Trend in Scientific Research and Development @ www.ijtsrd.com eISSN: 2456-6470 @ IJTSRD | Unique Paper ID – IJTSRD49125 | Volume – 6 | Issue – 2 | Jan-Feb 2022 Page 1344 May and June. The microbial isolates from the samples collected in June where as well significantly higher than the microbial isolates collected in May. These findings could be as a result of the change in the level of precipitation (Seasonal variation). More rainfall was observed in the month of July (150 mm) than in the months of May (78 mm) and June (125 mm). The results revealed that precipitation directly and indirectly affects the microbial load found in surface waters either by washing off materials from lands (agricultural and non-agricultural land) that could be contaminated or by re-suspending bottoms sediments and other contaminants. The result in Table 4 showed sample 5 has the largest enteric organisms and samples 2 and 4 had the lowest, while sample 1 had the highest heterotrophic bacterial count and sample 4 had the least. The result in Table 5 revealed that sample 2 had the highest number of enteric organisms while sample 1 had the least. It also revealed that sample 1 had the highest THABC while sample 5 had the least THABC. The result in Table 6 showed that the highest enteric organisms were found in sample 2 while the lowest enteric counts were found in sample 5 while the highest THAB count was found in sample 1 and the lowest sample 4. The result in Figure 2 revealed that the highest THABC and enteric bacteria were found in the month of December followed by the month of January. The least THABC and enteric bacteria count was found in the month of February. The result also revealed that there was seasonal influence on the concentration of the microorganisms found in the samples in each month. The isolation of a total of forty-six morphologically and biochemically identified bacteria from Obibia stream confirmed the ubiquity of microorganisms in the natural environment. Esharegoma et al. (2018), also reported the presence of these organisms in Elechi creek and Orogodo Stream. Microorganisms abound in the natural environment including water bodies. They function to bring about biodegradation of organic matters in the environment. Many of these organisms help to bring about bioremediation of contaminants in the environment. The results of the present study revealed that the highest bacterial occurrences were of the genera Vibrio, Salmonella and Escherichia. The results of the occurrence and frequency of bacteria isolated from samples collected in the months of December, January and February, 2015 - 2016 of dry season are shown in Figure 4. The result of the bacteriological analysis revealed the presence of 22 isolates which included bacteria of the genera Escherichia (12.50 %), Shigella (4.17 %), Salmonella (16.67 %), Vibrio (25.00 %), Enterobacter (4.17 %), Klebsiella (8.35 %), Enterococcus (4.17 %), Staphylococcus (8.33 %), Pseudomonas (8.33 %) and Serratia (8.33 %). The result of the present study revealed that the highest bacterial occurrences were of the genera Vibrio, Salmonella and Escherichia. The high numbers of Salmonella and Vibrio is not in agreement with EPA water standard for recreational use which states that these pathogenic organisms must not be present in water, because they are of public health significance, having been associated with gastrointestinal infections: diarrhea, dysentery, typhoid fever and other forms of infection. Other bacteria isolated from the water samples were also of public health significance. Staphylococcus aureus is known to produce enetrotoxin (Olatunji et al. (2011). Enterobacter aerogenes is an example of non - faecal coliforms and can be found in vegetation and soil which serves as sources by which pathogens enter the water (Olatunji et al. (2011). The heavy presence of faecal and non-faecal coliforms and pathogens in the water samples generally suggests that a certain section of water may have been contaminated or polluted with faeces either of human or animal origin and hence reflect the risk of pathogens presence in the water. This result tallied favorably with the report of Olatunji et al. (2011) which indicated that the presence of bushes and shrubs makes it likely possible that smaller mammal may have been coming around the water body to drink water, therebypassing out faeces into the water. This implies that the water is not fit for human consumption in its present state as ideally, and following the WHO recommendations, there should be no bacteria available per 100 ml of the water sample. 5. Conclusion Obibia stream has been a source of water for drinking purposes, domestic purposes and urban agriculture. These activities, as important as they are, produce and inject contaminants into the stream. The bacterial indices including those of public health significance were high as established in this study as a veritable case of negative human impact in the environment and negative effect of precipitation. Significant variation in microbial load and physicochemical parameters were observed between rainy and dry seasons. However, the presence of total coliform and total viable bacteria along with other pathogenic bacteria established the fact that the water was bacteriologically contaminated. This highlights the urgent need for the proper treatment of the surface water of Obibia Stream with appropriate method (s) before consumption or any other domestic usage.
- 12. International Journal of Trend in Scientific Research and Development @ www.ijtsrd.com eISSN: 2456-6470 @ IJTSRD | Unique Paper ID – IJTSRD49125 | Volume – 6 | Issue – 2 | Jan-Feb 2022 Page 1345 REFERENCES [1] Ababiaka, T. O and Sule, I. O. (2011). Bacteriological assessment of selected borehole water samples in Ilorin metropolis. International Journal of Applied Biological Research, 2 (2): 31–37. [2] Agboli, E., Egu, E., Kweku, M., Cham, M., Zotor, F. and Binka, F. (2017). Assessment of some physico-chemical properties and bacteriological status of sachet water consumed in the Hohoe Municipality, Ghana. International Journal of Tropical Disease and Health, 28 (2): 1 – 8. [3] Akubuenyi, F. C., Uttah, E. C. and Enyi-Idoh, K. H. (2013). Microbiological and physicochemical assessment of major sources of water for domestic uses in Calabar metropolis, Cross Stream State, Nigeria. Transnational Journal of Science and Technology, 3 (2): 31– 43. [4] Alberta, N. (2019). Health Problems Associated With Urbanization and Industrialization. Journal Environmental Health 6 (1): 149–157. [5] American Public Health Association (APHA), (2012). Standard methods for examination of water and wastewater. 22nd edn. American Public Health Association, American Water Works Association and Water Environment Federation. Washington DC, USA. Pp. 1360. [6] Aneja, K. R. (2005). Experiment in microbiology plant pathology and biotechnology. 4th ed. New Age International Limited Publishers, New Delhi. Pp. 274 – 275. [7] Association of Official Analytical Chemists (AOAC), (2012). Official method of analysis. 19th edn. Association of Official Analytical Chemists, Washington DC, USA. Pp. 121 – 130. [8] Dashe, Y. G., Raji, M. A., Abdu, P. A. and Oladele, B. S. (2013). Distribution of aerobic bacteria in visceral organs of sick and apparently healthy chickens in Jos, Nigeria. International Research Journal of Microbiology, 4 (3):79 – 83. [9] Ekhaise, F. O. and Nkwelle, J. (2011). Microbiological and Pysicochemical Analyses of Oil Contaminated Soil from Major Motor Mechanic Workshops in city Metropolis, Edo State, Nigeria. Journal of Applied Science and Environmental Mangement 15 (4): 597 – 600. [10] Ekiye, E. and Zejiao, L. (2010). Water quality monitoring in Nigeria: Case study of Nigeria’s industrial cities. Journal of American Science, 6 (4): 22 – 28. [11] Environmental Protection Agency (EPA) (2003). Microorganisms: Water quality act fact sheet. United States Environmental Protection Agency (EPA), USA. Pp. 89 – 234 [12] Esharegoma, O. S., Awujo, N. C., Jonathan, I. and Nkonye - Asua, I. P. (2018). Microbiological and Physicochemical Analysis of Orogodo Stream, Agbor, Delta State, Nigeria. International Journal of Ecological Science and Environmental Engineering, 5 (2): 34 – 42. [13] Ouma, S. O., Ngeranwu, J. N., Juma, K. K. and Mburu, D. N. (2016). Seasonal variational of the physicochemical and bacteriological quantity of water from five rural catchment areas of lake Victoria basin in Kenya. Journal of Environmental Analytical Chemistry 3(1): 1 – 7. [14] Patil, G. and Ahmed, I. (2011). Heavy metals contamination assessment of Kahargaon Dam water near Chlindawara city. Actachim Phgarmceutical, India, pp. 7 – 9. [15] Roohul, A., Syed, S. A., Zubair4, A. and Jabar, Z. K. K. (2012). Microbiology of anayst of drinking water and water distribution bsystem in new urban Peshawar, Current Research Journal of Biological Science, 14: 23 – 27. [16] Samuel, O., Rosemary, E., Patrice, O. and Frederick, O. (2017). An evaluation of the physicochemical characteristics of the hand- dug shallow water wells in Awka Metropolis, Anambra State, Nigeria. American Journal of Life Science Researches, 5 (3): 89 – 101. [17] Shukla, D. P., Vaghela, K. B. and Jain, N. K. (2017). Assessment of physico-chemical and bacteriological water quality parameters: A review. International Journal of Pharmacy and Integrated Life Sciences, 5 (2):1 -17. [18] Taiwo, A. M., Olujimi, O. O., Bamgbose, O. and Arowolo, T. A. (2012). Surface water quality monitoring in Nigeria: Situational analysis and future management strategy, water quality monitoring and assessment. International Journal of Quality Assessment 2 (1): 948-953 [19] Tamungang, N. E. B., Alakeh, M. N., Niba, M. L. F. and Jude, S. (2016). Physicochemical and bacteriological quality assessment of the Bambui community drinking water in the North West Region of Cameroon. African Journal of Environmental Science and Technology, 10 (6): 181 – 191.