The study investigates the hydrogeochemical quality of water from the Nworie River in Owerri, Nigeria, revealing that the water is acidic and contains elevated levels of harmful heavy metals, making it unsuitable for human consumption without treatment. Analysis showed that the river is affected by pollution from untreated waste disposal, with significant impacts on dissolved oxygen levels and biodiversity. The results highlight the ongoing contamination challenges posed by human and industrial activities in the area.


![Hydrogeochemical Analysis Of Water…
www.theijes.com The IJES Page 60
V. RESULTS AND DISCUSSION
The results of all the tests are shown in Table 1. Bar charts were used to indicate the level of cations
and anions concentration at the different sampling locations. Figures 3a, 3b and 3c display the chart for each
parameter.
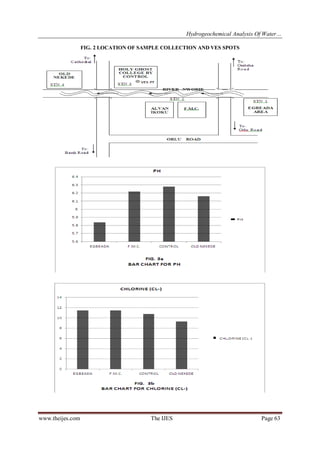
pH: The range of measured pH is between 5.84 and 6.28. The water is acidic. All the values obtained are below
the WHO standard. These low pH value (5.84 – 6.28) got from this study may be attributed to the untreated
waste dumped into the river. Akudinobi and Iyiegbu (2008) reported a similar situation in Enugu where
untreated waste thrown into Olobo river made the pH value to be as low as 3.7.
Dissolved O2: Only station 1 (i.e Egbeada) falls below the range of WHO standard. This may be due to the
process of eutophication in the area which enhanced the growth of aquatic vegetation or phytoplankton. Algal
blooms disrupt normal functioning of ecosystem causing variety of problems which include; lack of oxygen
needed for fish and shell fish to survive.
Turbidity:Increase in sediment load adversely affect the biodiversity of most rivers and lakes. This
phenomenon reduces the depth of river thus endangering those aquatic species that require specific depth for
survival. Sediment loaded rivers are murky or clouded. The FMC axis of Nworie river recorded a high level of
turbidity (73 NTU). This could be as a result of the discharge of untreated effluent.
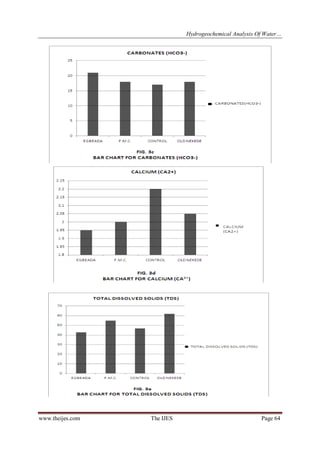
Nitrates and Phosphate: Nitrates normally have four sources namely: natural, waste-materials, crop
agriculture and irrigated agricultural practices (Adelana and Olasehinde 2003, Abimbola et. al., 2002, Marias,
1999, and Fan and Steinberg 1996). Nitrate values decrease from 12.4mg/ℓ at Egbeada station to 3.6mg/ℓ
around FMC and Alvan. Although the levels are within the acceptable limits. Alkalinity also decreases from
22.5mg/ℓ to 14.9mg/ℓ. Some other heavy metals identified in Nworie River include: lead (Pb), Iron (Fe), Zinc
(Zn), Manganese (Mn), Chromium (Cr), Copper (Cu) and Cadmium (Cd). From table 1, the mean value of lead
and iron exceeded the WHO limits. These could be due to illegal dumping of wastes. Alinnor and Obiji (2012)
identified Iron and Manganese from fish Tilapia got from Nworie River. The cations; Calcium (Ca), Magnesium
(Mg) and Aluminum (Al) are all within accepted limits. This indicates that the cationic exchange capability of
Nworie river is functional. These physical parameters also determine the suitability of the water for domestic
and industrial uses. For example water with low pH (acidic water) may cause severe corrosion of metal casing
used for reticulation. In human, it can cause metabolic acidosis.
Geophysical Survey Results: From the computer modeled curve, Fig 4, the geoelectric section was
constructed, (Fig 5). Seven geoelectric layers were identified from the geophysical survey.. Other details about
the geoelectric layers are shown in table 3. One remarkable observation from the geophysical results is a zone
(layers 2, 3 and 4) that has low resistivities. This can be attributed to the presence of mineralized / contaminated
groundwater. There are many cases of domestic boreholes within River Nworie basin that produce low quality
water. The contamination of this river by indiscriminate disposal of refuse into it may be one of the causes as
this river serves as one of the recharge sources to groundwater within this environment.
VI. CONCLUSION
Heavy metals have been identified in the water samples collected from River Nworie. The mean
concentration of Lead and Iron is above the safe limits. Other physiochemical assessment of the water samples
indicates that some parameters did not exceed the safe limits of WHO standard (WHO 2006). The mean pH is
low, this implies that the water is not good for human consumption without treatment. Turbidity increase might
enhance the reduction of depth of the river thus endangering those aquatic species requiring specific depth for
survival.Based on these findings, it is evident that the causes / sources of contamination / pollution are from
agricultural and human activities.
REFEREES
[1] ABIMBOLA A. F., ODUKOYA A.M AND OLATUNJI A.S. (2002): Influence of bedrock on the hydrogeochemical
characteristics of bedrock of groundwater in Northern part of Ibadan metropolis, Water Resources, 13 pp 1 – 6.
[2] ADELANA S.M.A. AND OLASEHINDE P.I. (2003): High nitrate in water supply in Nigeria: Implications for Human Health,
Water Resources, 14, pp 1 – 11.
[3] AKUDINOBI B.E. AND IYIEGBU C. (2008): Urban water security in Nigeria; case studies from Onitsha and Enugu
areas of southeastern Nigeria, Water Resources, 18 pp 17 – 24.
[4] ALINNOR J.E. AND OBIJI I.A. (2012): Assessment of trace metal composition in fish samples from Nworie River, Pak. J.
Nutr., 9, pp 81 – 85.](https://image.slidesharecdn.com/i0292058067-131004064348-phpapp02/85/The-International-Journal-of-Engineering-and-Science-The-IJES-3-320.jpg)
![Hydrogeochemical Analysis Of Water…
www.theijes.com The IJES Page 61
[5] FAN A.M. AND STEINBERG V.E. (1996): Health implications of nitrate and nitrate in drinking water; An update on
methaeomoglobinaemia occurrence and reproductive and developmental toxicology. Regulatory toxicology and pharmacology,
23, Academy Press Inc.
[6] ISHAKU J.M AND EZEIGBO H.I. (2010): Groundwater quality monitoring in Jimeta – Yola area, Northeastern Nigeria, Water
Resources, Vol. 20, No. 2. Pp 1 – 14.
[7] MARAIS S. (1999): Dependency of communities on groundwater for water supply and associated fluoride and nitrate
problems. Paper presented at workshop on fluorides and nitrates in rural water supplies, Mafikeng, 9 – 10 March 1999.
[8] OMADA J.I., OMATOLA D.O. AND OMALI A. (2011): Physico – chemical characteristics of surface and
groundwater in Anyigba and its environs, Kogi State Nigeria, Water Resources, 21, pp 18 – 25.
[9] ONYEAGOCHA A.C. (1980): Petrography and depositional environment of the Benin Formation. Journal of
Mining and Geology, 17 pp 147 – 152.
[10] WORLD HEALTH ORGANIZATION, WHO (2006): Guidelines for drinking water quality criteria, 2nd ed. Vol. 2. Pp 281 –
308. World Health Organization, Geneva.
TABLES
Table 1 Results of the geochemical analyses
Table 2 Field data of the geophysical survey
Table 3 Geoelectric layers derived from computer curve
FIGURES
Fig 1 Geologic map of study area
Fig 2 Location of sample collection and VES spots
Fig 3 Bar chart
Fig 4 Computer modeled curve
Fig 5 Geoelectric section](https://image.slidesharecdn.com/i0292058067-131004064348-phpapp02/85/The-International-Journal-of-Engineering-and-Science-The-IJES-4-320.jpg)


![11.[40 51]correlates in groundwater quality parameters and textural classes o...](https://cdn.slidesharecdn.com/ss_thumbnails/11-40-51correlatesingroundwaterqualityparametersandtexturalclassesofsoilsinaperi-industrialdistrictofthenigeriandeltaregion-120512235818-phpapp02-thumbnail.jpg?width=640&height=640&fit=bounds)


