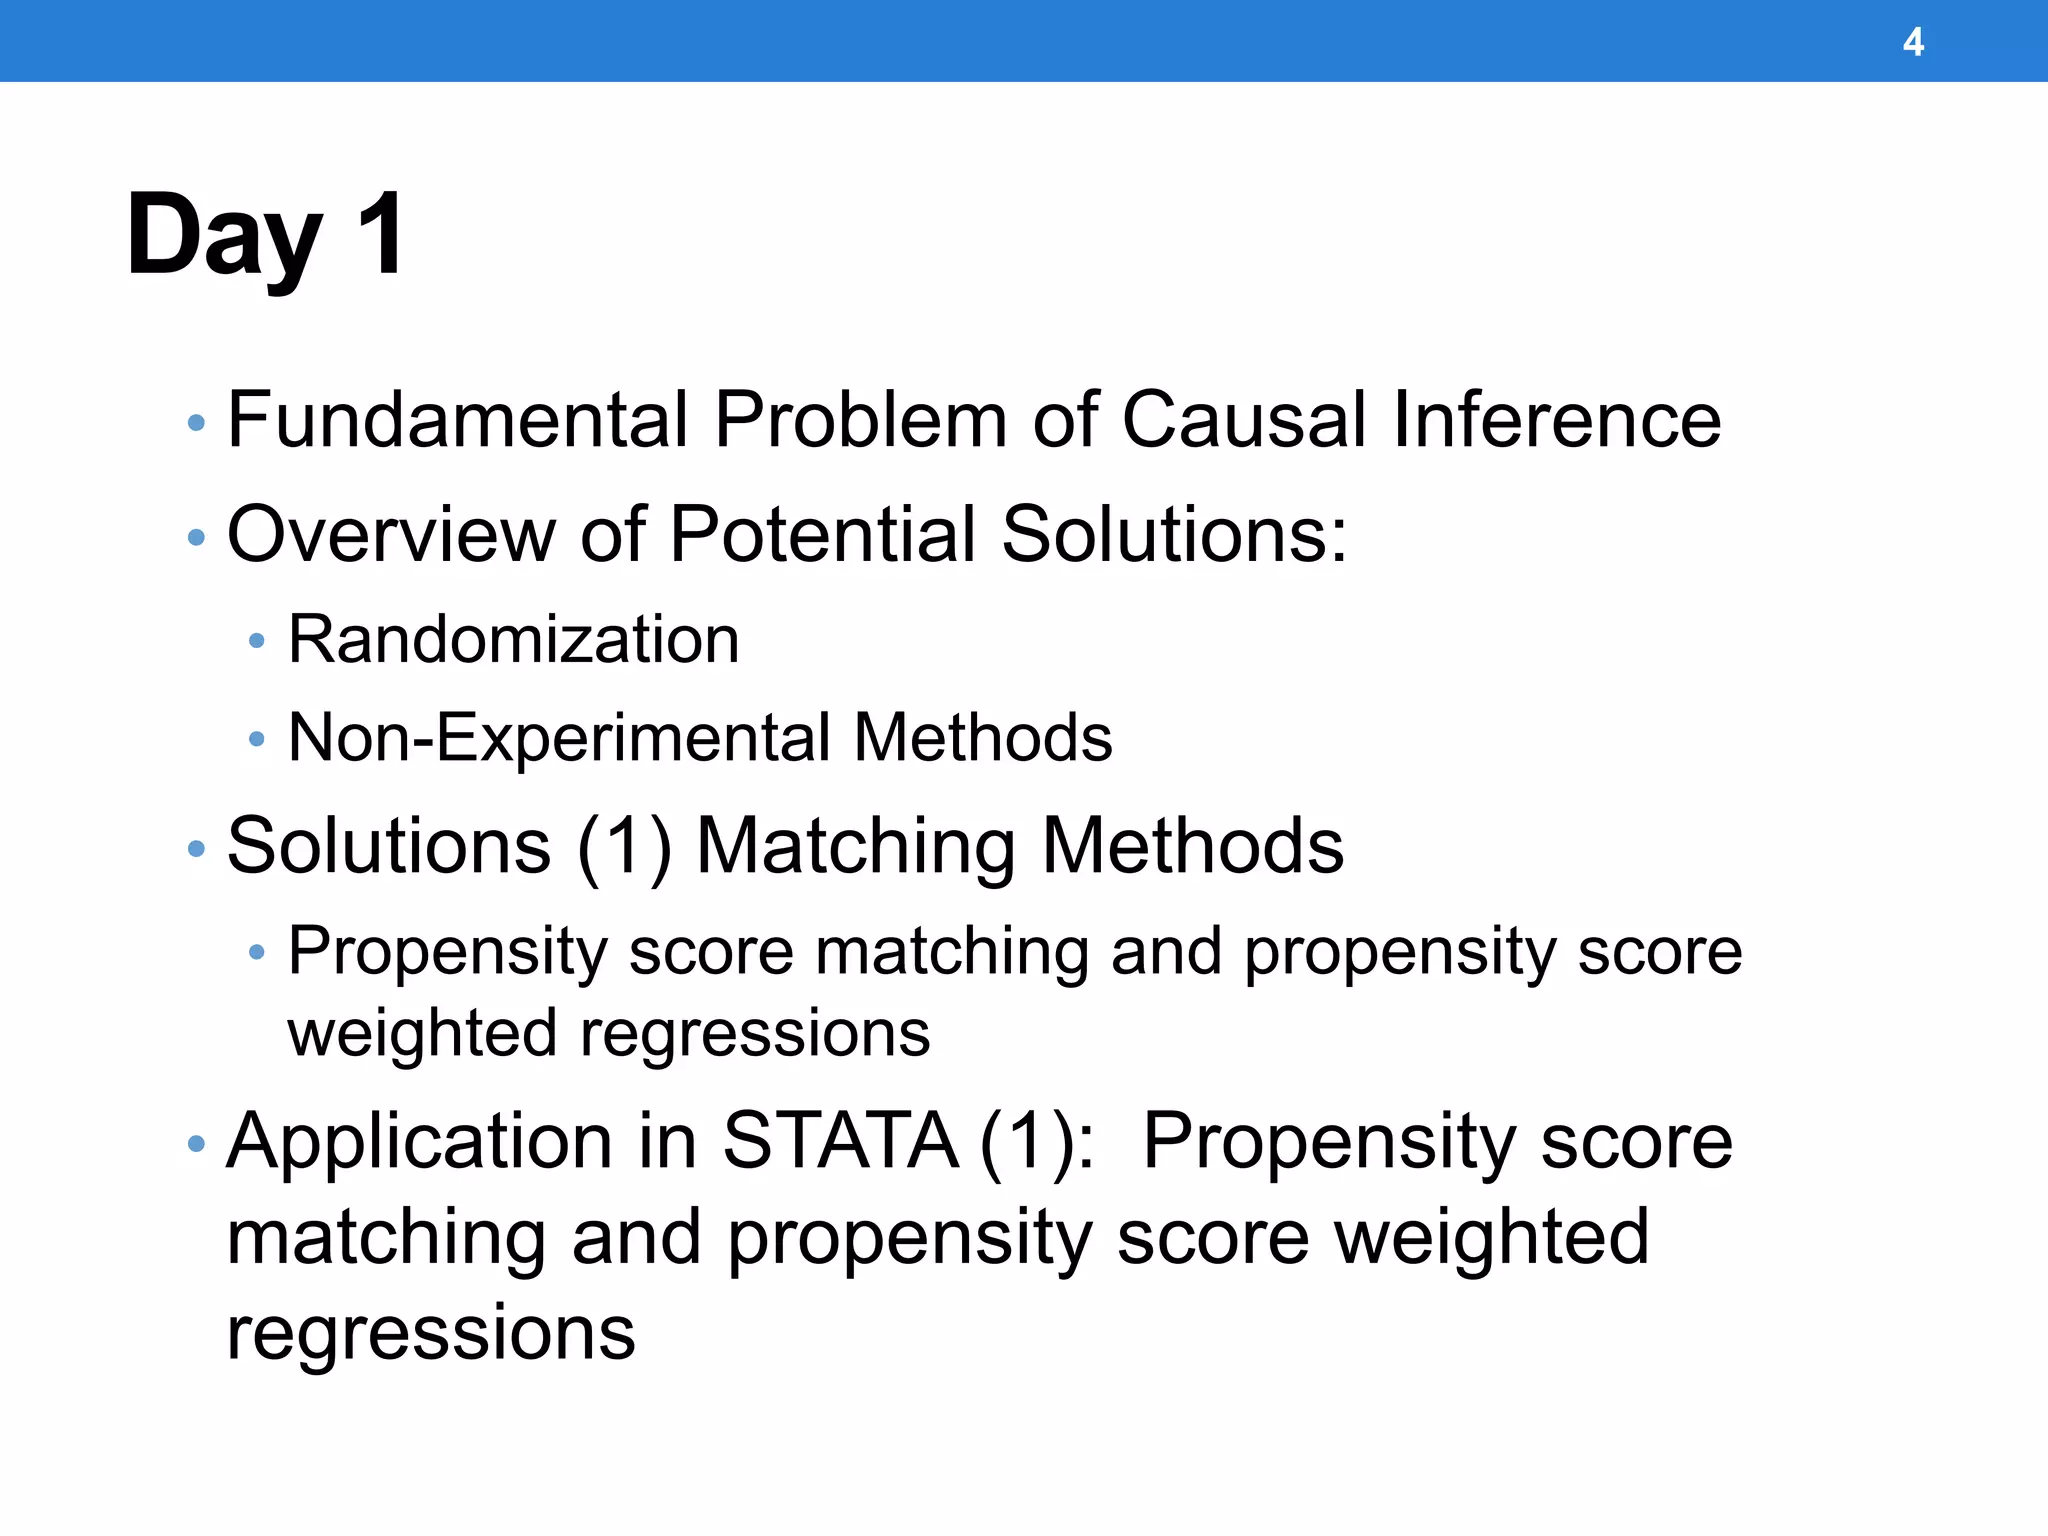
Overview and
Objectives of the
Workshop
Day 1, Introduction
By Ragui Assaad
Training on Applied Micro-Econometrics and
Public Policy Evaluation
July 25-27, 2016
Economic Research Forum
Objectives
• Discuss fundamental problem of causal
inference in program or policy evaluation
• Propose methodological solutions
• understand the underlying econometrics
• gain experience in applying the techniques
2
Policy/Program Evaluation
• Although all the techniques discussed are framed
in terms program/policy evaluation, techniques
can be used to study any endogenous treatment
so long as the assumptions underlying the
various methods are upheld
3
Day 1
• Fundamental Problem of Causal Inference
• Overview of Potential Solutions:
• Randomization
• Non-Experimental Methods
• Solutions (1) Matching Methods
• Propensity score matching and propensity score
weighted regressions
• Application in STATA (1): Propensity score
matching and propensity score weighted
regressions
4
Day 2
• Solutions (2)
• Difference-in-Difference Methods
• Applications in STATA (2)
• Difference-in-difference in practice
• Solutions (3)
• Panel Data Models: fixed and random effects
• Applications in STATA (3)
• Panel data models
5
Day 3
• Solutions (4)
• Control Functions and Instrumental Variable
• Applications in STATA (4)
• Instrumental variables
• Solutions (5)
• Regression Discontinuity Method
• Applications in STATA (5)
• Regression Discontinuity Method
6
STATA skills
• Commands to undertake microeconometric program
evaluation
• Descriptive statistics
• Graphing
• Multivariate estimation commands
• Post-estimation commands
• Commands to support reproducible results and
documentation
• Programming skills
7
Descriptive Statistics and Graphing
• Descriptive statistics present key characteristics of the
analysis in an accessible format
• Critical for:
• Understanding your data
• Providing background and motivation for a policy issue
• Checking assumptions of microeconometric models
• Can be presented graphically
• Appropriate descriptive statistics and graphs are
particularly important to help communicate results to
policy makers
8
Multivariate estimation commands
• Propensity score matching
• Propensity score weighted regressions
• Difference-in-difference estimation
• Panel data models
• Fixed effects & random effects
• Instrumental variables techniques
• Regression discontinuity designs
9
Post-estimation commands
• After estimating a model, can undertake post-estimation
commands
• Types of post-estimation commands:
• Saving your results
• Checking the assumptions of your estimator
• Testing hypotheses about coefficients
• Obtaining predicted values or marginal effects
10
Documentation and Reproducibility
• When you (or others) re-run your analyses, want to get the
same results
• A study is reproducible if all the numbers presented in the
study can be reproduced
• When re-running the STATA do files
• A study is replicable if a re-study repeats the finding
• Documenting your findings is critical to reproducing your own
results and allowing others to reproduce your results
• STATA commands should all be saved in do files to allow results to be
reproduced (re-run) later
• Log files and other forms of output (graphs, tables) saved from STATA
11
STATA programming
• STATA has many commands that are built in to the
program
• Newer releases expand the set of commands available
• Sometimes you will want to undertake econometrics that
are not built in to STATA
• Skills that allow you to go beyond STATA’s built-in
commands:
• Locating, installing, and applying user-written programs in STATA
• Based on .ado files
• Writing and using your own programs
• Creating your own commands through programs in .do files
12

Overview and Objectives of the Workshop

  • 1.
    Overview and Objectives ofthe Workshop Day 1, Introduction By Ragui Assaad Training on Applied Micro-Econometrics and Public Policy Evaluation July 25-27, 2016 Economic Research Forum
  • 2.
    Objectives • Discuss fundamentalproblem of causal inference in program or policy evaluation • Propose methodological solutions • understand the underlying econometrics • gain experience in applying the techniques 2
  • 3.
    Policy/Program Evaluation • Althoughall the techniques discussed are framed in terms program/policy evaluation, techniques can be used to study any endogenous treatment so long as the assumptions underlying the various methods are upheld 3
  • 4.
    Day 1 • FundamentalProblem of Causal Inference • Overview of Potential Solutions: • Randomization • Non-Experimental Methods • Solutions (1) Matching Methods • Propensity score matching and propensity score weighted regressions • Application in STATA (1): Propensity score matching and propensity score weighted regressions 4
  • 5.
    Day 2 • Solutions(2) • Difference-in-Difference Methods • Applications in STATA (2) • Difference-in-difference in practice • Solutions (3) • Panel Data Models: fixed and random effects • Applications in STATA (3) • Panel data models 5
  • 6.
    Day 3 • Solutions(4) • Control Functions and Instrumental Variable • Applications in STATA (4) • Instrumental variables • Solutions (5) • Regression Discontinuity Method • Applications in STATA (5) • Regression Discontinuity Method 6
  • 7.
    STATA skills • Commandsto undertake microeconometric program evaluation • Descriptive statistics • Graphing • Multivariate estimation commands • Post-estimation commands • Commands to support reproducible results and documentation • Programming skills 7
  • 8.
    Descriptive Statistics andGraphing • Descriptive statistics present key characteristics of the analysis in an accessible format • Critical for: • Understanding your data • Providing background and motivation for a policy issue • Checking assumptions of microeconometric models • Can be presented graphically • Appropriate descriptive statistics and graphs are particularly important to help communicate results to policy makers 8
  • 9.
    Multivariate estimation commands •Propensity score matching • Propensity score weighted regressions • Difference-in-difference estimation • Panel data models • Fixed effects & random effects • Instrumental variables techniques • Regression discontinuity designs 9
  • 10.
    Post-estimation commands • Afterestimating a model, can undertake post-estimation commands • Types of post-estimation commands: • Saving your results • Checking the assumptions of your estimator • Testing hypotheses about coefficients • Obtaining predicted values or marginal effects 10
  • 11.
    Documentation and Reproducibility •When you (or others) re-run your analyses, want to get the same results • A study is reproducible if all the numbers presented in the study can be reproduced • When re-running the STATA do files • A study is replicable if a re-study repeats the finding • Documenting your findings is critical to reproducing your own results and allowing others to reproduce your results • STATA commands should all be saved in do files to allow results to be reproduced (re-run) later • Log files and other forms of output (graphs, tables) saved from STATA 11
  • 12.
    STATA programming • STATAhas many commands that are built in to the program • Newer releases expand the set of commands available • Sometimes you will want to undertake econometrics that are not built in to STATA • Skills that allow you to go beyond STATA’s built-in commands: • Locating, installing, and applying user-written programs in STATA • Based on .ado files • Writing and using your own programs • Creating your own commands through programs in .do files 12