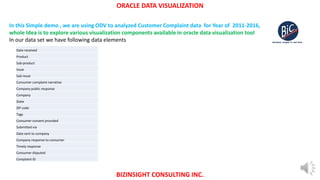
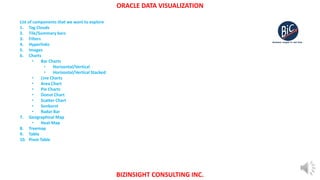
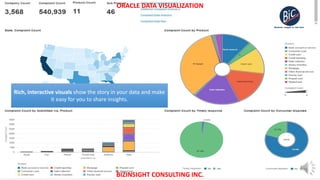
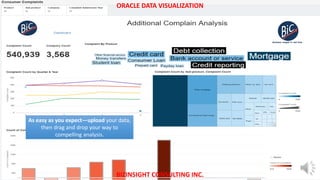
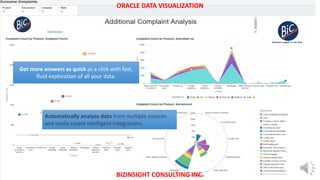
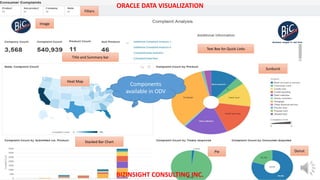
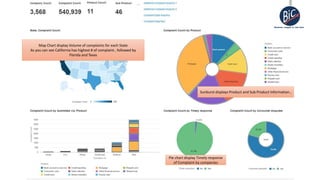
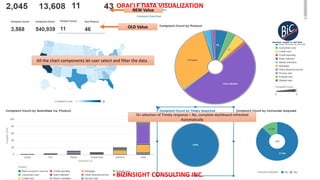
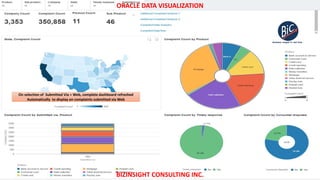
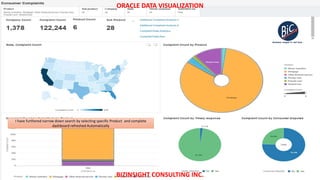
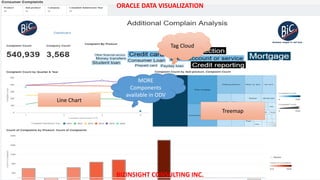
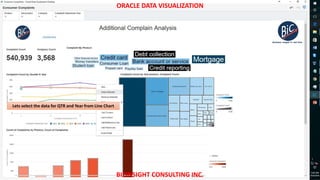
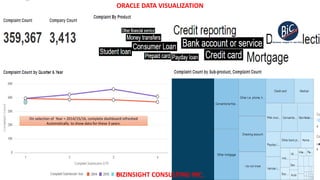
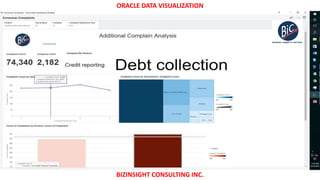
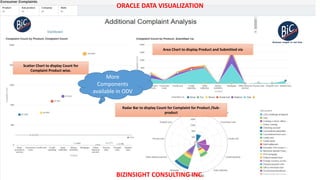
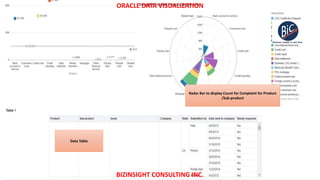
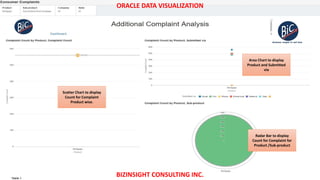
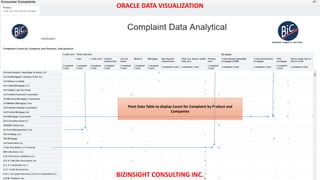
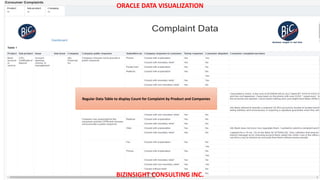
Oracle Data Visualization tool offers Rich, interactive visuals components , in this Short presentation we will explore some of these components and create Dashboard with Complaint data set.
[Infographic] Cloud Integration Drivers and Requirements in 2015SnapLogic
SnapLogic and TechValidate queried more than 100 U.S. companies with revenues greater than $500 million about the business and technical drivers and barriers for enterprise cloud application adoption in 2015 and beyond.
You can also learn how the SnapLogic Elastic Integration Platform can help by going to www.SnapLogic.com/iPaaS.
Webinar: The Death of Traditional Data IntegrationSnapLogic
In this webinar, we hear from industry analyst, middleware expert and author David Linthicum on why “existing approaches to data integration won’t meet future needs as the use of technology continues to change.” David also says that, “drastic measures must be taken now to prepare enterprises for the arrival of this technology, and to position enterprises to take full advantage.”
This webinar will show you how the game is changing, and what you can do about it right now. We summarize the changes that are happening, and review new and emerging patterns of data integration, as well as data integration technology that you can buy today that lives up to these new expectations.
To learn more, visit: www.snaplogic.com/big-data
Migrating to the Cloud – Is Application Performance Monitoring still required?eG Innovations
As more businesses adopt cloud technologies for their various benefits it must be noted that not all cloud offerings are the same and provide different services or infra SLA. Do you know that not all SLA from cloud providers mean your application will be ensured similar availability?
Depending on whether you are leveraging Saas, Paas, Iaas, etc to deliver your applications, you will have a different level of visibility and control of how you manage performance and deliver the user experience expected by your users.
Join the session and find out what remains within your responsibility and how you can monitor the various cloud infrastructure/services to give yourself the needed visibility to deliver the expected user experience without over-provisioning to ensure better performance.
The SnapLogic Integration Cloud for ServiceNowSnapLogic
Learn more about using the SnapLogic Integration Cloud to unlock ServiceNow potential by integrating it with major ITSM Cloud and on-premise applications including BMC Remedy, CA Clarity, SAP SolutionManager, and Workday. SnapLogic’s ServiceNow integration will greatly improve efficiency and quality of IT service management.
To learn more, visit: http://www.snaplogic.com/solutions/servicenow-integration.
Data and its Role in Your Digital TransformationVMware Tanzu
Data plays a big role in building the kinds of experiences demanded by the market today. In this session, we’ll unpack what goes into building a data-driven app, case studies of how organizations have successfully overcome siloed data and analytics to bring new predictive features into their applications, and what your next steps for data should be on your digital transformation journey.
Speaker: Les Klein, EMEA CTO Data, Pivotal
Pivotal Digital Transformation Forum: Becoming a Data Driven EnterpriseVMware Tanzu
Next Steps in Your Digital Transformation
This session brings together all the lessons learnt throughout the day and shares with you practical advice on how to get started with, or accelerate, your journey to become a digital business.
The Transformation of your Data in modern IT (Presented by DellEMC)Cloudera, Inc.
Organizations have a wealth of data contained within the existing infrastructures. At DellEMC we’re helping customers remove the barriers of legacy datastores and transforming the customer experience in the modern datacentre. Learn how to unshackle the valuable data inside your existing data warehouse, leverage new techniques, applications and technology to enhance the financial impact of all your data sources
Slides from Lenses session at Redis Conf 19
The Rise of DataOps on Streaming data, Lenses as a DataOps platform with SQL on Redis and Kafka.
Gain visibility and unlock your data scientists.
We are celebrating 5 years of FlexPod with Cisco! See what we have achieved, what is in store the future and more in this graphic.
Learn more about FlexPod:
NetApp - http://www.netapp.com/us/solutions/flexpod/
Cisco - http://www.cisco.com/c/en/us/solutions/data-center-virtualization/flexpod/index.html
Webinar: It's the 21st Century - Why Isn't Your Data Integration Loosely Coup...SnapLogic
In this webinar, learn from digital transformation and SOA thought leader Jason Bloomberg about traditional enterprise application integration (EAI), the rise of SOA and Web Services, and the latest REST and JSON initiatives.
This presentation also features a discussion of the age-old problem of implementing loosely coupled data integration, an architectural approach to solving this difficult problem and a demonstration of SnapLogic.
To learn more, visit: www.snaplogic.com/connect-faster
Webinar: DataStax and Microsoft Azure: Empowering the Right-Now Enterprise wi...DataStax
Today’s Right-Now Economy means employees and customers alike expect applications to be always on, real time, and contextual. But how do you manage applications that collect data from a variety of sources, at cloud scale, and provide instant insights? And, can you embrace the public cloud while still retaining control of your data? Join us to hear from Microsoft Cloud Architect and Azure Global Black Belt Ron Abellera to learn how an enterprise-ready hybrid cloud data layer can help to accelerate time to market and scale linearly, ensure continuous availability, and achieve data autonomy with a hybrid cloud strategy.
View webinar recording: https://youtu.be/_-GqmAk5C_I
Explore all DataStax webinars: https://www.datastax.com/resources/webinars
** Watch the video to accompany these slides: https://www.cloverdx.com/webinars/starting-your-modern-dataops-journey **
- What is "Data Ops" and why should you consider it?
- How to begin your transition to a DevOps and DataOps-style of work
- How agile methodologies, version control, continuous integration or 'infrastructure as code' can improve the effectivity of your teams
- How you can use technology like CloverDX to start with DataOps
Discover how to make your development and data analytics processes more efficient and effective by shifting to a Dev/DataOps approach.
More CloverDX webinars: https://www.cloverdx.com/webinars
Twitter: https://twitter.com/cloverdx
LinkedIn: https://www.linkedin.com/company/cloverdx/
Get a free 45 day trial of the CloverDX Data Management Platform: https://www.cloverdx.com/trial-platform
Data technology experts from Pivotal give the latest perspective on how big data analytics and applications are transforming organizations across industries.
This event provides an opportunity to learn about new developments in the rapidly-changing world of big data and understand best practices in creating Internet of Things (IoT) applications.
Learn more about the Pivotal Big Data Roadshow: http://pivotal.io/big-data/data-roadshow
Pivotal Data Warehouse in the Age of Digital TransformationVMware Tanzu
View the recording: https://content.pivotal.io/webinars/the-data-warehouse-in-the-age-of-digital-transformation?utm_source-pivotalwebsite&utm-medium-email-link&utm-campaign=datawarehouse-hiredbrains-q117
In the past years of Big Data and digital transformation “euphoria”, Hadoop and Spark received most of the attention as platforms for large-scale data management and analytics. Data warehouses based on relational database technology, for a variety of reasons, came under scrutiny as perhaps no longer needed.
However, if there is anything users have learned recently it’s that the mission of data warehouses is as vital as ever. Cost and operational deficiencies can be overcome with a combination of cloud computing and open source software, and by leveraging the same economics of traditional big data projects - scale-up and scale-out at commodity pricing.
In this webinar, Neil Raden from Hired Brains Research makes the case that an evolved data warehouse implementation continues to play a vital role in the enterprise, providing unique business value that actually aids digital transformation. Attendees will learn:
- How the role of the data warehouse has evolved over time
- Why Hadoop and Spark are not replacements for the data warehouse
- How the data warehouse supports digital transformation initiatives
- Real-life examples of data warehousing in digital transformation scenarios
- Advice and best practices for evolving your own data warehouse practice
Client approaches to successfully navigate through the big data stormIBM Analytics
Hadoop is not a platform for data integration: As a result, some organizations turn to hand coding for integration – or end up deploying solutions that aren’t fully scalable. Review this Slideshare to learn about IBM client best practices for Big Data Integration success.
Become an data driven organization through unified metadata using ODPi EgeriaData Con LA
Data Con LA 2020
Description
Learn how ODPi Egeria uses its distributed virtual graph to connect metadata about an enterprise's data and IT services from many different tools and then apply governance across this landscape. In this talk we will describe the principles behind the distributed virtual graph and how different technologies can connect in. We will also cover how the JanusGraph technology can be used to fill in the gaps between the tools to ensure the metadata is linked together.
Speaker
Mandy Chessell, IBM, ODPi TSC Chairperson and ODPi Egeria project chairperson. IBM Distinguished Engineer
Get Started with Cloudera’s Cyber SolutionCloudera, Inc.
Cloudera empowers cybersecurity innovators to proactively secure the enterprise by accelerating threat detection, investigation, and response through machine learning and complete enterprise visibility. Cloudera’s cybersecurity solution, based on Apache Spot, enables anomaly detection, behavior analytics, and comprehensive access across all enterprise data using an open, scalable platform. But what’s the easiest way to get started?
Join Cloudera, StreamSets, and Arcadia Data as we show you first hand how we have made it easier to get your first use case up and running. During this session you will learn:
Signs you need Cloudera’s cybersecurity solution
How StreamSets can help increase enterprise visibility
Providing your security analyst the right context at the right time with modern visualizations
3 things to learn:
Signs you need Cloudera’s cybersecurity solution
How StreamSets can help increase enterprise visibility
Providing your security analyst the right context at the right time with modern visualizations
Webinar: Building a Multi-Cloud Strategy with Data Autonomy featuring 451 Res...DataStax
Data autonomy goes hand-in-hand with building a powerful, multi-cloud data management strategy. Enterprises today are rethinking their data management tactics in light of what they can achieve with the correct usage of the public clouds. In this on-demand webcast, guest speaker James Curtis, Senior Analyst, Data Platforms & Analytics, 451 Research, discussed how enterprises are getting valuable data autonomy and building game-changing multi-cloud database management strategies.
View recording: https://youtu.be/RMoEaATgGO8
Explore all DataStax webinars: https://www.datastax.com/resources/webinars
Webinar: How Active Everywhere Database Architecture Accelerates Hybrid Cloud...DataStax
In this webinar, we’ll discuss how an Active Everywhere database—a masterless architecture where multiple servers (or nodes) are grouped together in a cluster—provides a consistent data fabric between on-premises data centers and public clouds, enabling enterprises to effortlessly scale their hybrid cloud deployments and easily transition to the new hybrid cloud world, without changes to existing applications.
View recording: https://youtu.be/ob6tr-9YiF4
Oracle EBS iBiz Dashboard (Business mobile app)Falak
Enterprise mobile app Oracle EBS iBiz Dashboard for Oracle E-Business Suite helps you stay on top of your business through your iPhones/iPads, Android, Windows Phone 7 & 8. Integrated with your Oracle Application server, accessible anytime anywhere.
http://training.solidq.com/es/class/solidq-summit-madrid-2016/
Presentación de Eduardo Azanza y Teresa A. Martinez, de Pyramid Analytics, partner de SolidQ, durante la sesión de Data Drive el pasado 13 de Abril en las oficinas de Microsoft, Madrid.
VIDIZMO gives channel managers and admins a high level overview of what’s happening in their channels in the form of a current status dashboard and graphical charts and trends showing patterns of overall media viewing, user behavior, campaigns/courses performance and usage.
In this session, you will see a demo of Oracle Business Intelligence Visual Analyzer, taking a real-world business use case from end to end, to learn how straightforward it is to tell a compelling story with data and prototype with greater speed, while gaining insights into information with this new cutting-edge data visualization access.
This session will show some useful data visualisation tips and how they can be used in Oracle Business Intelligence and Data Visualization Cloud Services
Business intelligence dashboards and data visualizations serve as a launching point for better business decision making. Learn how you can leverage Power BI to easily build reports and dashboards with interactive visualizations.
This is the introduction of the data visualization software, Visualr. It contains brief detail of the features of Visualr and how data visualization can help your organization in effective decision making.
Field View Analytics - Sempre AnalyticsNick Patrick
Automated Analytics Platform that lifts the data from Field View, consolidates it and provides insightful dashboards and analysis of snags, sub-contractor performance and compliance. Ability to bring in other data sources to enrich your insights, and deliver cross project reporting.
Amazon QuickSight is a fast BI service that makes it easy for you to build visualizations, perform ad-hoc analysis, and quickly get business insights from your data. QuickSight is built to harness the power and scalability of the cloud, so you can easily run analysis on large datasets, and support hundreds of thousands of users. In this session, we’ll demonstrate how you can easily get started with Amazon QuickSight, uploading files, connecting to S3 and Redshift, and creating analyses from visualizations that are optimized based on the underlying data. Once we’ve built our analysis and dashboard, we’ll show you easy it is to share it with colleagues and stakeholders in just a few seconds.
Denodo DataFest 2016: The Governed Data Lake – Putting Big Data to WorkDenodo
Watch the full session: Denodo DataFest 2016 sessions: https://goo.gl/VyrAbY
Data lakes are en vogue, especially when you based it on avant-garde in-memory technologies such as Spark. However, these investments don’t deliver the anticipated benefits when they are not properly governed in conjunction with legacy data warehouses and other data source.
In this presentation, the Enterprise Architect at Autodesk, Mark Eaton will present:
• The philosophies behind agile, modern (Spark-based) data architectures
• How to use a logical data warehouse/ data lake as part of the data governance strategy
• Building an information architecture – dos and don’ts
This session is part of the Denodo DataFest 2016 event. You can also watch more Denodo DataFest sessions on demand here: https://goo.gl/VXb6M6
DAS Slides: Data Architect vs. Data Engineer vs. Data ModelerDATAVERSITY
The increasing focus on data in today’s organization has increased demand for critical roles such as data architect, data engineer, and data modeler. But there is often confusion and ambiguity around what these roles entail, and what overlap exists between them. This webinar will discuss these data-centric roles and their place in the data-driven organization.
With Endeca information discovery for Oracle Receivables User can review and analyze data using key Performance Indicators (KPIs), performance evaluation metrics, charts, graphs, and tables.
User can search using Receivables pages and Endeca Information Discovery (EID) design tools. These pages are hosted in an EID environment, and called from new container pages in EBS.
Accelerate Self-Service Analytics with Data Virtualization and VisualizationDenodo
Watch full webinar here: https://bit.ly/39AhUB7
Enterprise organizations are shifting to self-service analytics as business users need real-time access to holistic and consistent views of data regardless of its location, source or type for arriving at critical decisions.
Data Virtualization and Data Visualization work together through a universal semantic layer. Learn how they enable self-service data discovery and improve performance of your reports and dashboards.
In this session, you will learn:
- Challenges faced by business users
- How data virtualization enables self-service analytics
- Use case and lessons from customer success
- Overview of the highlight features in Tableau
Salesforce analytics and BI continues to be a trending, hot topic as organizations implement new platforms to improve their customer intelligence. But what’s the best way to access the data? SOQL is the popular query language for Salesforce. However, SQL may be better suited for accessing data for analytics. Join us in the great SOQL vs. SQL query debate to see which one is best for your analytics project.
Are you really curious about Power BI Dashboards, but you are scared that you won’t understand any of the words? This is the session for you! During our short time together, I will define some basic terms and best practices in Data Analysis, provide a quick demo of Power BI, and show what it takes to create a few simple reports and dashboards.
What Will You Learn?
• How to ask the right questions
• How to quickly get and model data
• How to design easy reports and dashboards
This is very high level presentation to show how we can integrate Service cloud with Oracle EBS , by exposing Web Services (SOAP/REST) available in Oracle Integrated SOA gateway.
Oracle Human Resources Extensions for Oracle Endeca enables you to identify, measure, prioritize and resolve your day to day HR related business processes or help in formulating strategic decisions. In addition, you benefit from an improvement in the productivity of HR administrators and line managers, reduce repetitive search actions and result in a seamless completion of business flows.
You can use the Workforce Explorer page to search employees by leveraging quick search and guided navigation capabilities. HR users can analyze and interpret person data with the aid of key metrics, maps, tags, flexible charts and graphs. It also provides the ability to navigate to employee personnel actions for performing HR transactions.
Oracle E-Business Suite Information Discovery is a collection of integrated applications that enable enterprises to
optimize operational decisions and improve process efficiency with realtime access to operational data, driving better cost and revenue decisions
Oracle E-Business Suite Extensions for Oracle Endeca is a solution that allows users to find actionable information in real time, improve their productivity, and leverage their investment in Oracle E-Business Suite Human Capital Management (HCM) products.
This presentation is about how to Create Drop Ship Sales Order Across the Operating Units in R12i and then how to perform Inter company Transactions.
Here I will discuss following Process
1.Drop Ship SO Creation
2.PO Creation
3.Receiving against PO
4.AP/AR Invoice Creation
5.Intercompany Invoice Creation
This presentation is about how to Create Line Sets like Ship / Arrival / Fulfillment in Oracle Order Management and Functionality as well as advantages of having line sets.
This is Presentation about New feature about Copying Line Sets while Copying the Order lines between existing Sales Order, Introduced in Release R12i of Oracle Appliaction.
This is short Demo about How to Enter Serial Number on Return order for Serial Control items at the time of RMA Creation from Sales Order UI (User Interface)
In this presentation I will explain how to handle Serial Control Items in Oracle Order Management ( for Outbound as well as inbound Orders).
How to Define Serial Control Item in Oracle Inventory.
Complete Sales Order Flow for Serial Control Items in Order Management
Complete RMA Order Flow for Serial Control Items in Order Management
Partial receiving of RMA.
Data Centers - Striving Within A Narrow Range - Research Report - MCG - May 2...pchutichetpong
M Capital Group (“MCG”) expects to see demand and the changing evolution of supply, facilitated through institutional investment rotation out of offices and into work from home (“WFH”), while the ever-expanding need for data storage as global internet usage expands, with experts predicting 5.3 billion users by 2023. These market factors will be underpinned by technological changes, such as progressing cloud services and edge sites, allowing the industry to see strong expected annual growth of 13% over the next 4 years.
Whilst competitive headwinds remain, represented through the recent second bankruptcy filing of Sungard, which blames “COVID-19 and other macroeconomic trends including delayed customer spending decisions, insourcing and reductions in IT spending, energy inflation and reduction in demand for certain services”, the industry has seen key adjustments, where MCG believes that engineering cost management and technological innovation will be paramount to success.
MCG reports that the more favorable market conditions expected over the next few years, helped by the winding down of pandemic restrictions and a hybrid working environment will be driving market momentum forward. The continuous injection of capital by alternative investment firms, as well as the growing infrastructural investment from cloud service providers and social media companies, whose revenues are expected to grow over 3.6x larger by value in 2026, will likely help propel center provision and innovation. These factors paint a promising picture for the industry players that offset rising input costs and adapt to new technologies.
According to M Capital Group: “Specifically, the long-term cost-saving opportunities available from the rise of remote managing will likely aid value growth for the industry. Through margin optimization and further availability of capital for reinvestment, strong players will maintain their competitive foothold, while weaker players exit the market to balance supply and demand.”
Techniques to optimize the pagerank algorithm usually fall in two categories. One is to try reducing the work per iteration, and the other is to try reducing the number of iterations. These goals are often at odds with one another. Skipping computation on vertices which have already converged has the potential to save iteration time. Skipping in-identical vertices, with the same in-links, helps reduce duplicate computations and thus could help reduce iteration time. Road networks often have chains which can be short-circuited before pagerank computation to improve performance. Final ranks of chain nodes can be easily calculated. This could reduce both the iteration time, and the number of iterations. If a graph has no dangling nodes, pagerank of each strongly connected component can be computed in topological order. This could help reduce the iteration time, no. of iterations, and also enable multi-iteration concurrency in pagerank computation. The combination of all of the above methods is the STICD algorithm. [sticd] For dynamic graphs, unchanged components whose ranks are unaffected can be skipped altogether.
Quantitative Data AnalysisReliability Analysis (Cronbach Alpha) Common Method...2023240532
Quantitative data Analysis
Overview
Reliability Analysis (Cronbach Alpha)
Common Method Bias (Harman Single Factor Test)
Frequency Analysis (Demographic)
Descriptive Analysis
Levelwise PageRank with Loop-Based Dead End Handling Strategy : SHORT REPORT ...Subhajit Sahu
Abstract — Levelwise PageRank is an alternative method of PageRank computation which decomposes the input graph into a directed acyclic block-graph of strongly connected components, and processes them in topological order, one level at a time. This enables calculation for ranks in a distributed fashion without per-iteration communication, unlike the standard method where all vertices are processed in each iteration. It however comes with a precondition of the absence of dead ends in the input graph. Here, the native non-distributed performance of Levelwise PageRank was compared against Monolithic PageRank on a CPU as well as a GPU. To ensure a fair comparison, Monolithic PageRank was also performed on a graph where vertices were split by components. Results indicate that Levelwise PageRank is about as fast as Monolithic PageRank on the CPU, but quite a bit slower on the GPU. Slowdown on the GPU is likely caused by a large submission of small workloads, and expected to be non-issue when the computation is performed on massive graphs.
Adjusting OpenMP PageRank : SHORT REPORT / NOTESSubhajit Sahu
For massive graphs that fit in RAM, but not in GPU memory, it is possible to take
advantage of a shared memory system with multiple CPUs, each with multiple cores, to
accelerate pagerank computation. If the NUMA architecture of the system is properly taken
into account with good vertex partitioning, the speedup can be significant. To take steps in
this direction, experiments are conducted to implement pagerank in OpenMP using two
different approaches, uniform and hybrid. The uniform approach runs all primitives required
for pagerank in OpenMP mode (with multiple threads). On the other hand, the hybrid
approach runs certain primitives in sequential mode (i.e., sumAt, multiply).
06-04-2024 - NYC Tech Week - Discussion on Vector Databases, Unstructured Data and AI
Round table discussion of vector databases, unstructured data, ai, big data, real-time, robots and Milvus.
A lively discussion with NJ Gen AI Meetup Lead, Prasad and Procure.FYI's Co-Found
1. ORACLE DATA VISUALIZATION
BIZINSIGHT CONSULTING INC.
Oracle Data Visualization Dashboard
for Customer Complain database
Bizinsight Consulting Inc.
www.bizinsightinc.com
inquiry@bizinsightinc.com
2. ORACLE DATA VISUALIZATION
BIZINSIGHT CONSULTING INC.
Making sense of your data shouldn't be tough. Oracle Data Visualization Desktop gives decision-makers their own personal desktop
application to access, explore, blend, and share data visualizations.
Oracle Data Visualization is stunningly visual. You can create visual stories on data from a variety of sources including spreadsheets,
databases and applications.
Combine and blend your data using the intelligent visualizations to quickly see patterns. Selecting data in one visualization highlights related data in
everything else on the screen. You can capture insights and comments to create an interactive story that you can share with colleagues.
Highlights of Oracle data Visualization
Rich, interactive visuals to show the story in your data .
Get more answers as quick as a click with fast
Decipher your data with visuals
Automatically analyze data from multiple sources
Easily upload your data, then drag and drop your way to compelling analysis.
3. ORACLE DATA VISUALIZATION
BIZINSIGHT CONSULTING INC.
In this Simple demo , we are using ODV to analyzed Customer Complaint data for Year of 2011-2016,
whole Idea is to explore various visualization components available in oracle data visualization tool
In our data set we have following data elements
Date received
Product
Sub-product
Issue
Sub-issue
Consumer complaint narrative
Company public response
Company
State
ZIP code
Tags
Consumer consent provided
Submitted via
Date sent to company
Company response to consumer
Timely response
Consumer disputed
Complaint ID
4. ORACLE DATA VISUALIZATION
BIZINSIGHT CONSULTING INC.
List of components that we want to explore
1. Tag Clouds
2. Tile/Summary bars
3. Filters
4. Hyperlinks
5. Images
6. Charts
• Bar Charts
• Horizontal/Vertical
• Horizontal/Vertical Stacked
• Line Charts
• Area Chart
• Pie Charts
• Donut Chart
• Scatter Chart
• Sunburst
• Radar Bar
7. Geographical Map
• Heat Map
8. Treemap
9. Table
10. Pivot Table
5. BIZINSIGHT CONSULTING INC.
ORACLE DATA VISUALIZATION
Rich, interactive visuals show the story in your data and make
it easy for you to share insights.
6. BIZINSIGHT CONSULTING INC.
ORACLE DATA VISUALIZATION
As easy as you expect—upload your data,
then drag and drop your way to
compelling analysis.
7. ORACLE DATA VISUALIZATION
BIZINSIGHT CONSULTING INC.
Get more answers as quick as a click with fast,
fluid exploration of all your data.
Automatically analyze data from multiple sources
and easily create intelligent integrations.
8. ORACLE DATA VISUALIZATION
BIZINSIGHT CONSULTING INC.
Heat Map
Sunburst
Pie Donut
Stacked Bar Chart
Image
Filters
Title and Summary bar
Text Box for Quick Links
Components
available in ODV
9. BIZINSIGHT CONSULTING INC.
ORACLE DATA VISUALIZATION
Sunburst displays Product and Sub Product Information ,
Pie chart display Timely response
of Complaint by companies
Map Chart display Volume of complaints for each State
As you can see California has highest # of complaint , followed by
Florida and Texas
10. BIZINSIGHT CONSULTING INC.
ORACLE DATA VISUALIZATION
All the chart components let user select and filter the data .
On selection of Timely response = No, complete dashboard refreshed
Automatically
OLD Value
NEW Value
11. BIZINSIGHT CONSULTING INC.
ORACLE DATA VISUALIZATION
On selection of Submitted Via = Web, complete dashboard refreshed
Automatically to display on complaints submitted via Web
12. BIZINSIGHT CONSULTING INC.
ORACLE DATA VISUALIZATION
I have furthered narrow down search by selecting specific Product and complete
dashboard refreshed Automatically
15. BIZINSIGHT CONSULTING INC.
ORACLE DATA VISUALIZATION
On selection of Year = 2014/15/16, complete dashboard refreshed
Automatically to show data for these 3 years.
17. ORACLE DATA VISUALIZATION
BIZINSIGHT CONSULTING INC.
Scatter Chart to display Count for
Complaint Product wise.
Area Chart to display Product and Submitted via
Radar Bar to display Count for Complaint for Product /Sub-
product
More
Components
available in ODV
19. BIZINSIGHT CONSULTING INC.
ORACLE DATA VISUALIZATION
Scatter Chart to display
Count for Complaint
Product wise.
Area Chart to display
Product and Submitted
via
Radar Bar to display
Count for Complaint for
Product /Sub-product
22. BIZINSIGHT CONSULTING INC.
For addition information or Demo @Oracle Data Visualization please feel free to reach us at inquiry@bizinsightinc.com.
ORACLE DATA VISUALIZATION