Download to read offline
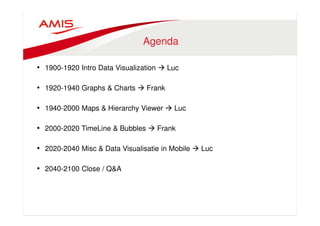

This document discusses a presentation on data visualization using Oracle ADF and MAF. The presentation introduces data visualization and its uses, explores various types of visualizations including graphs, charts, maps, timelines and bubbles, and looks at data visualization on mobile. It is delivered by Luc Bors and Frank Houweling from AMIS in the Netherlands on November 12th, 2014 in Utrecht.