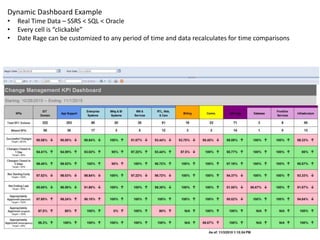
Dynamic Dashboard Example
• Real Time Data – SSRS < SQL < Oracle
• Every cell is “clickable”
• Date Rage can be customized to any period of time and data recalculates for time comparisons
Dynamic Dashboard Example
• Real Time Data – SSRS < SQL < Oracle
• Each record is “clickable”
• Pulls date range from main dashboard and displays corresponding data
• Can change metrics on the fly (colored cells “clickable”)
Dynamic Dashboard Example
• Real Time Data – SSRS < SQL < Oracle
• Displays raw data
• Pulls date range from main dashboard and
displays corresponding data
General SSRS Report - with Filter
• Real Time Data – SSRS < SQL < Oracle
• Allows user to filter/search for Approvers for any given application
SSRS Report – 13 Rolling Month KPI Chart with regression line calculated in SQL
• Real Time Data – SSRS < SQL < Oracle
• PPT Ready
Grouped SSRS Report - with Sortable Columns
• Real Time Data – SSRS < SQL < Oracle
• Allows user to filter/search for deployments by timeframe/type/status
General SSRS Report - with Filter
• Manually Updated Data – SQL < Custom App < Oracle
• Maps SAP Code to PR Code
Monthly Reporting - Static Data calculated and stored in Data Mart
• Stored in tables/views < SQL < Oracle
• Clickable cells to drilldown reports used for slides
Monthly Reporting - Static Data calculated and stored in Data Mart
• Stored in tables/views < SQL < Oracle
• Clickable cells to drilldown reports used for slides
Monthly Reporting - Static
Data calculated and stored
in Data Mart
• Stored in tables/views <
SQL < Oracle
• Clickable cells to drilldown
reports used for slides

SSRS Reporting Portfolio

  • 1.
    Dynamic Dashboard Example •Real Time Data – SSRS < SQL < Oracle • Every cell is “clickable” • Date Rage can be customized to any period of time and data recalculates for time comparisons
  • 2.
    Dynamic Dashboard Example •Real Time Data – SSRS < SQL < Oracle • Each record is “clickable” • Pulls date range from main dashboard and displays corresponding data • Can change metrics on the fly (colored cells “clickable”)
  • 3.
    Dynamic Dashboard Example •Real Time Data – SSRS < SQL < Oracle • Displays raw data • Pulls date range from main dashboard and displays corresponding data
  • 4.
    General SSRS Report- with Filter • Real Time Data – SSRS < SQL < Oracle • Allows user to filter/search for Approvers for any given application
  • 5.
    SSRS Report –13 Rolling Month KPI Chart with regression line calculated in SQL • Real Time Data – SSRS < SQL < Oracle • PPT Ready
  • 6.
    Grouped SSRS Report- with Sortable Columns • Real Time Data – SSRS < SQL < Oracle • Allows user to filter/search for deployments by timeframe/type/status
  • 7.
    General SSRS Report- with Filter • Manually Updated Data – SQL < Custom App < Oracle • Maps SAP Code to PR Code
  • 8.
    Monthly Reporting -Static Data calculated and stored in Data Mart • Stored in tables/views < SQL < Oracle • Clickable cells to drilldown reports used for slides
  • 9.
    Monthly Reporting -Static Data calculated and stored in Data Mart • Stored in tables/views < SQL < Oracle • Clickable cells to drilldown reports used for slides
  • 10.
    Monthly Reporting -Static Data calculated and stored in Data Mart • Stored in tables/views < SQL < Oracle • Clickable cells to drilldown reports used for slides