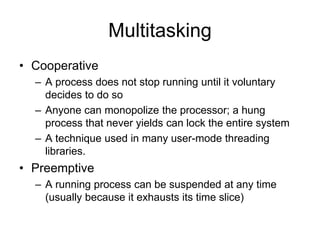
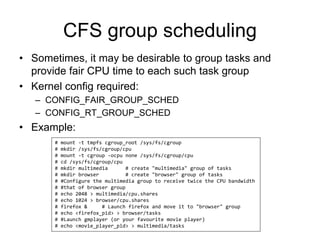
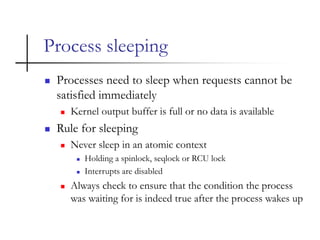
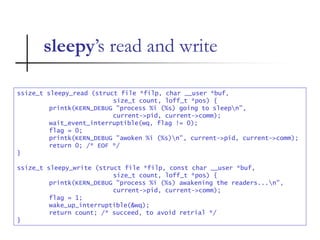
![Process priority
• Processes with a higher priority
– run before those with a lower priority
– receive a longer time slice
• Priority range [static, dynamic]
– Normal, batch: [always 0, -20~+19], default: [0, 0],
dynamic priority is the nice value you adjust in user
space. A larger “nice” value correspond to a lower
priority
– FIFO, RR: [0~99, 0], higher value means greater
priority. FIFO, RR processes are at a higher priority
than normal processes
– Deadline: Not applicable. Deadline processes are
always the highest priority in the system](https://image.slidesharecdn.com/processscheduling-170629144609/85/Process-scheduling-6-320.jpg)
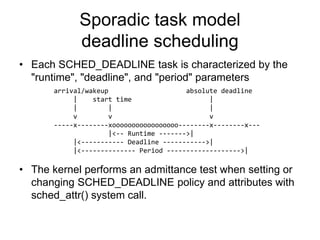
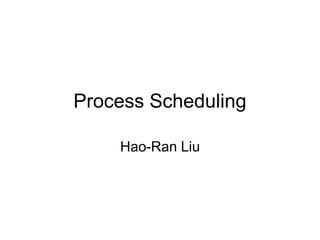
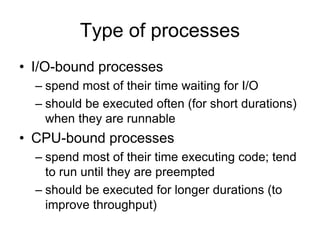
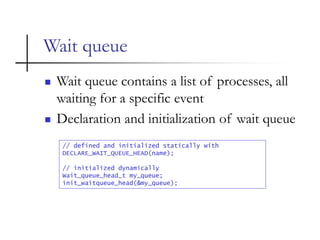
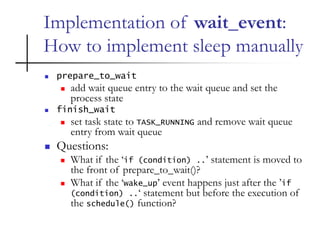
![Some tools for real-time tasks
• chrt sets or retrieves the real-time scheduling attributes
of an existing pid, or runs command with the given
attributes.
• Limiting the CPU usage of real-time and deadline
processes
– A nonblocking infinite loop in a thread scheduled under the
FIFO, RR, or DEADLINE policy will block all threads with lower
priority forever
– two /proc files can be used to reserve a certain amount of CPU
time to be used by non-real-time processes.
• /proc/sys/kernel/sched_rt_period_us (default: 1000000)
• /proc/sys/kernel/sched_rt_runtime_us (default: 950000)
chrt [options] [<policy>] <priority> [-p <pid> | <command> [<arg>...]]](https://image.slidesharecdn.com/processscheduling-170629144609/85/Process-scheduling-14-320.jpg)
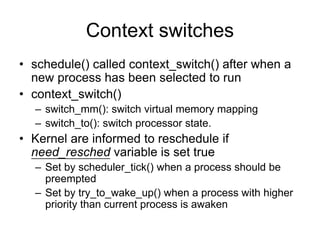
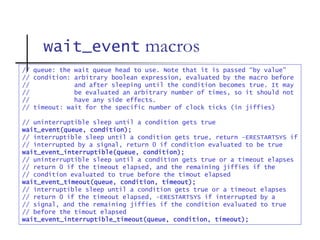


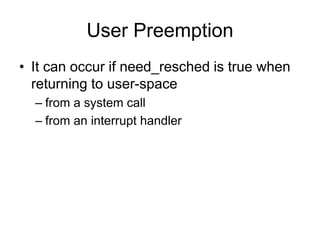
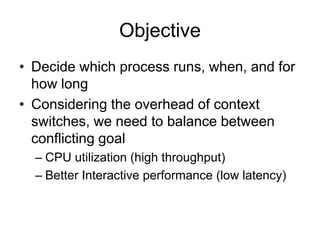
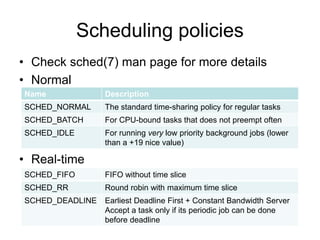
![Cases that needs preemption disable
• Per-CPU data structures
• Some registers must be protected
– On x86, kernel does not save FPU state
except for user tasks. Entering and exiting
FPU mode is a critical section that must occur
while preemption is disabled
struct this_needs_locking tux[NR_CPUS];
tux[smp_processor_id()] = some_value;
/* task is preempted here... */
something = tux[smp_processor_id()];](https://image.slidesharecdn.com/processscheduling-170629144609/85/Process-scheduling-28-320.jpg)

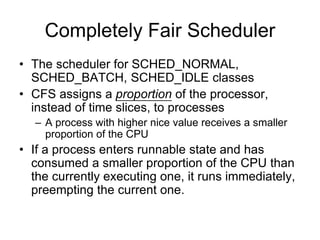
The document discusses process scheduling in operating systems, focusing on objectives, types of processes (I/O-bound and CPU-bound), and various scheduling policies, including cooperative and preemptive multitasking. It details the Completely Fair Scheduler (CFS), its functioning with time slices, and the implications of process priorities and groups. Additionally, it mentions real-time scheduling and the mechanisms for managing process sleeping and waking in the kernel.