


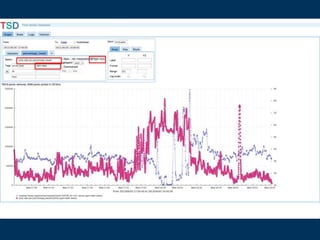
![http://opentsdb.example.com
/#start=2013/06/05-17:00:00
&end=2013/06/05-19:00:00
&m=sum:hadoop.hbase.regionserver.requests
{server_type=dwh-data}
&o=axis x1y1
&m=sum:proc.stat.cpu.percentage_iowait
{server_type=dwh-data,dc=lv7,host=data08}
&o=axis x1y2
&ylabel=HBase Requests
&y2label=&CPU IOWait
&yrange=[0:]
&wxh=1475x600](https://image.slidesharecdn.com/operations-session3-130708183842-phpapp01/85/HBaseCon-2013-OpenTSDB-at-Box-25-320.jpg)
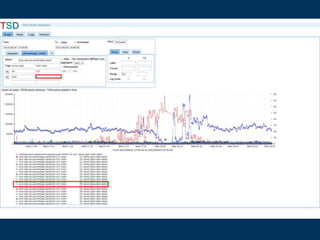
![http://opentsdb.example.com
/q?start=2013/06/05-17:00:00
&end=2013/06/05-19:00:00
&m=sum:hadoop.hbase.regionserver.requests
{server_type=dwh-data}
&o=axis x1y1
&m=sum:proc.stat.cpu.percentage_iowait
{server_type=dwh-data,dc=lv7,host=data08}
&o=axis x1y2
&ylabel=HBase Requests
&y2label=&CPU IOWait
&yrange=[0:]
&wxh=1475x600
&ascii](https://image.slidesharecdn.com/operations-session3-130708183842-phpapp01/85/HBaseCon-2013-OpenTSDB-at-Box-26-320.jpg)


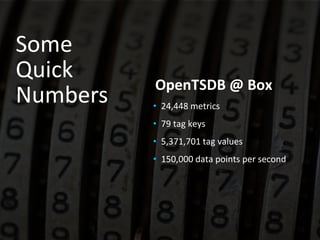

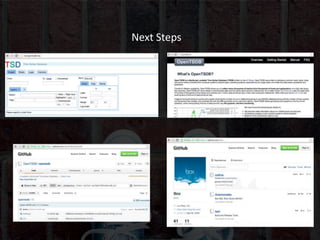


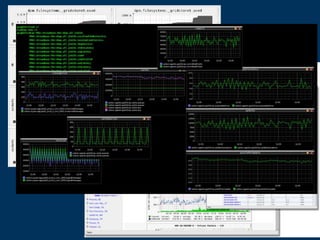
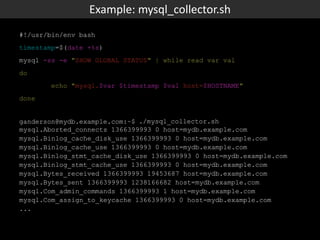
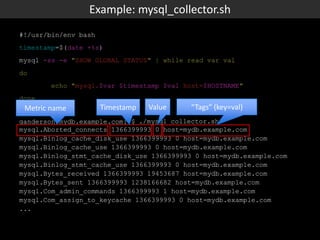
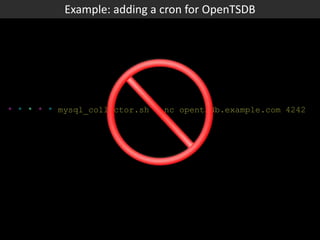
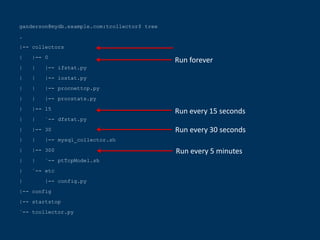
This document discusses Box's use of OpenTSDB to store and query time series metrics data. It describes how OpenTSDB provides a scalable and easy way to collect, store, and query large amounts of metrics data compared to previous solutions. It includes examples of using OpenTSDB, such as a script to collect MySQL metrics and adding it as a cron job, and examples of querying the data through the OpenTSDB API and web interface. It also provides some statistics about Box's OpenTSDB deployment and next steps.


![[FR] Timeseries appliqué aux couches de bébé](https://cdn.slidesharecdn.com/ss_thumbnails/breizhcamp-2016-160325163719-thumbnail.jpg?width=640&height=640&fit=bounds)


![Paul Dix [InfluxData] The Journey of InfluxDB | InfluxDays 2022](https://cdn.slidesharecdn.com/ss_thumbnails/2022-11-02influxdays-journeyofinfluxdb-221020214252-ff7c76c5-thumbnail.jpg?width=640&height=640&fit=bounds)