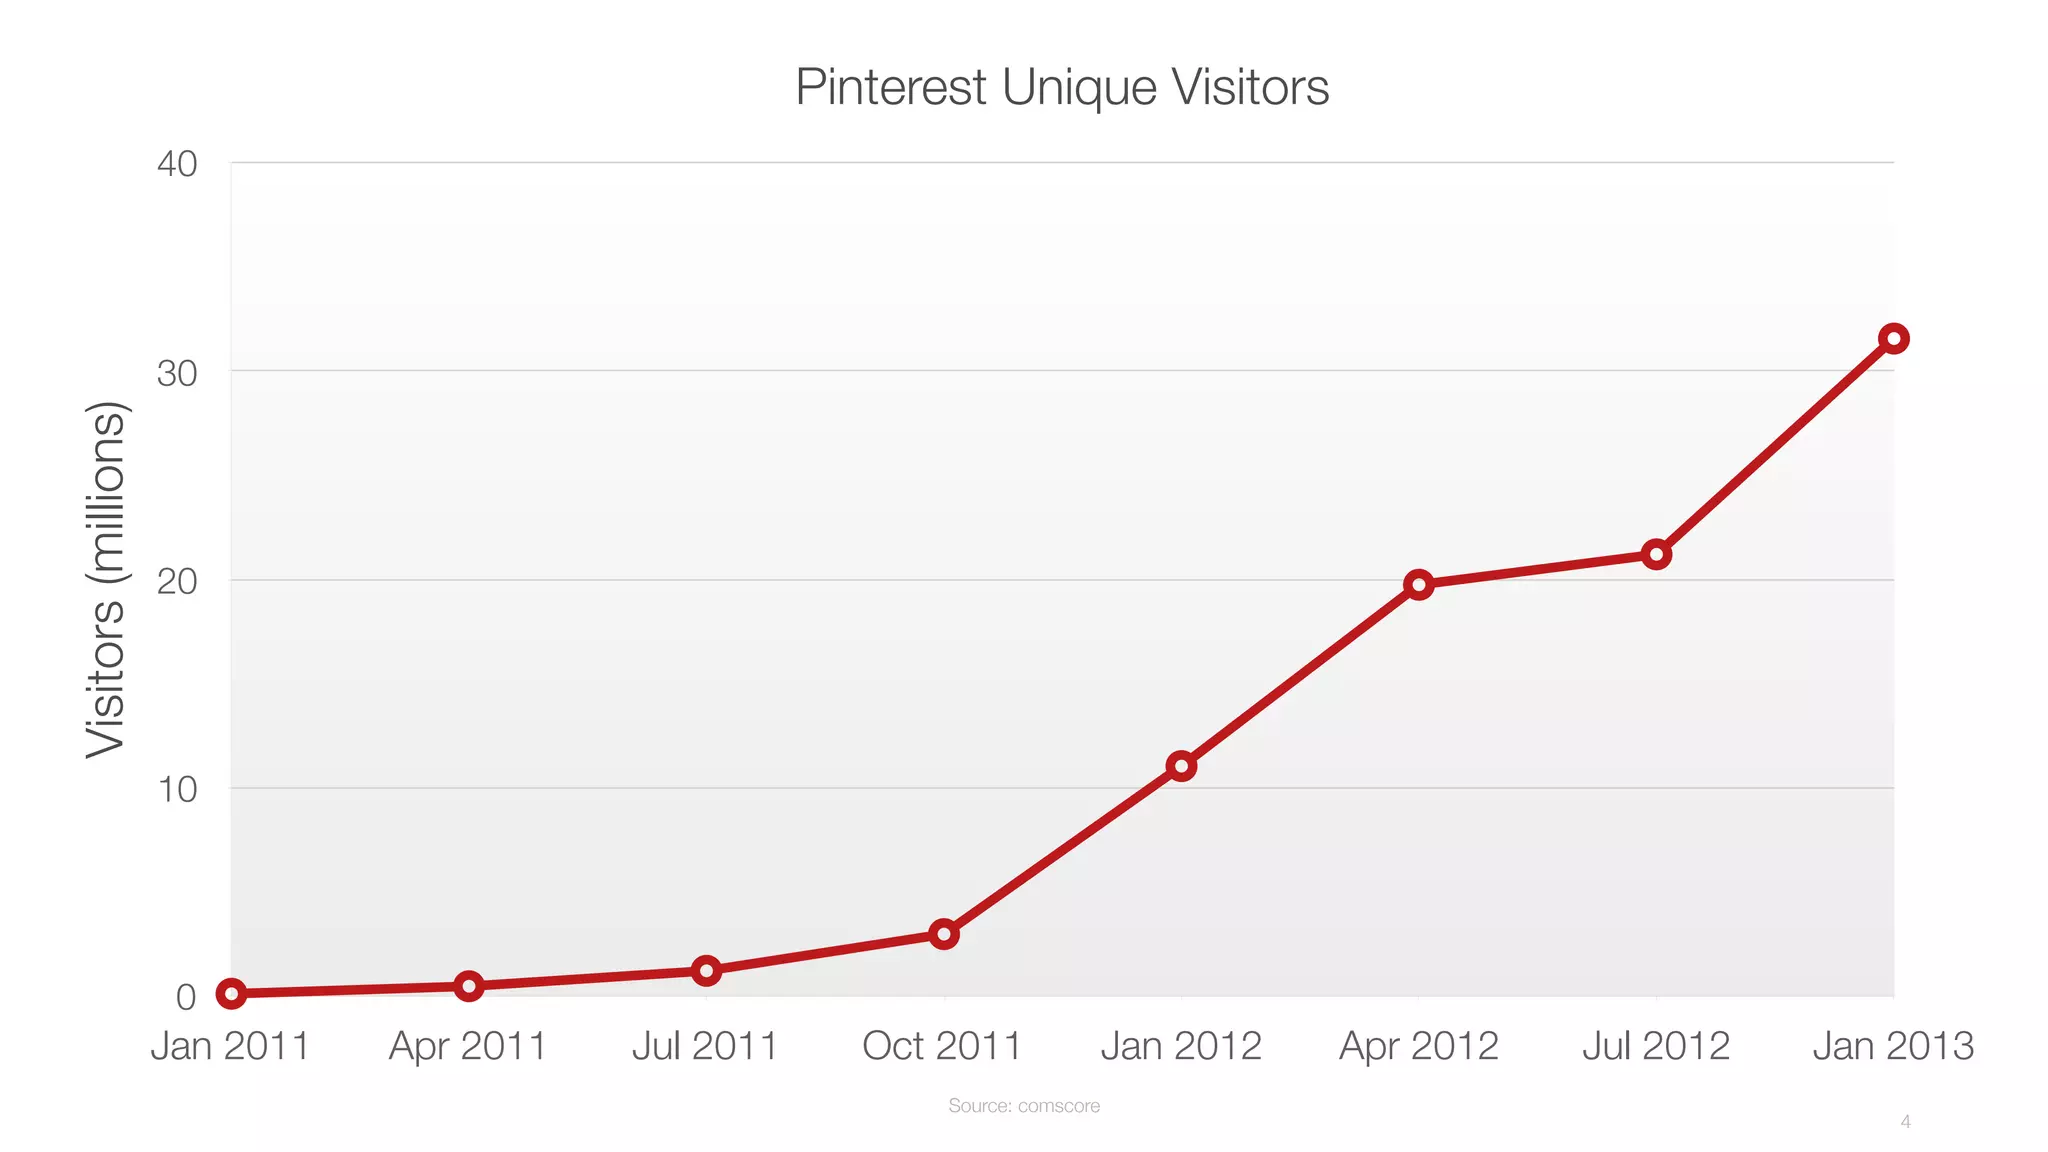
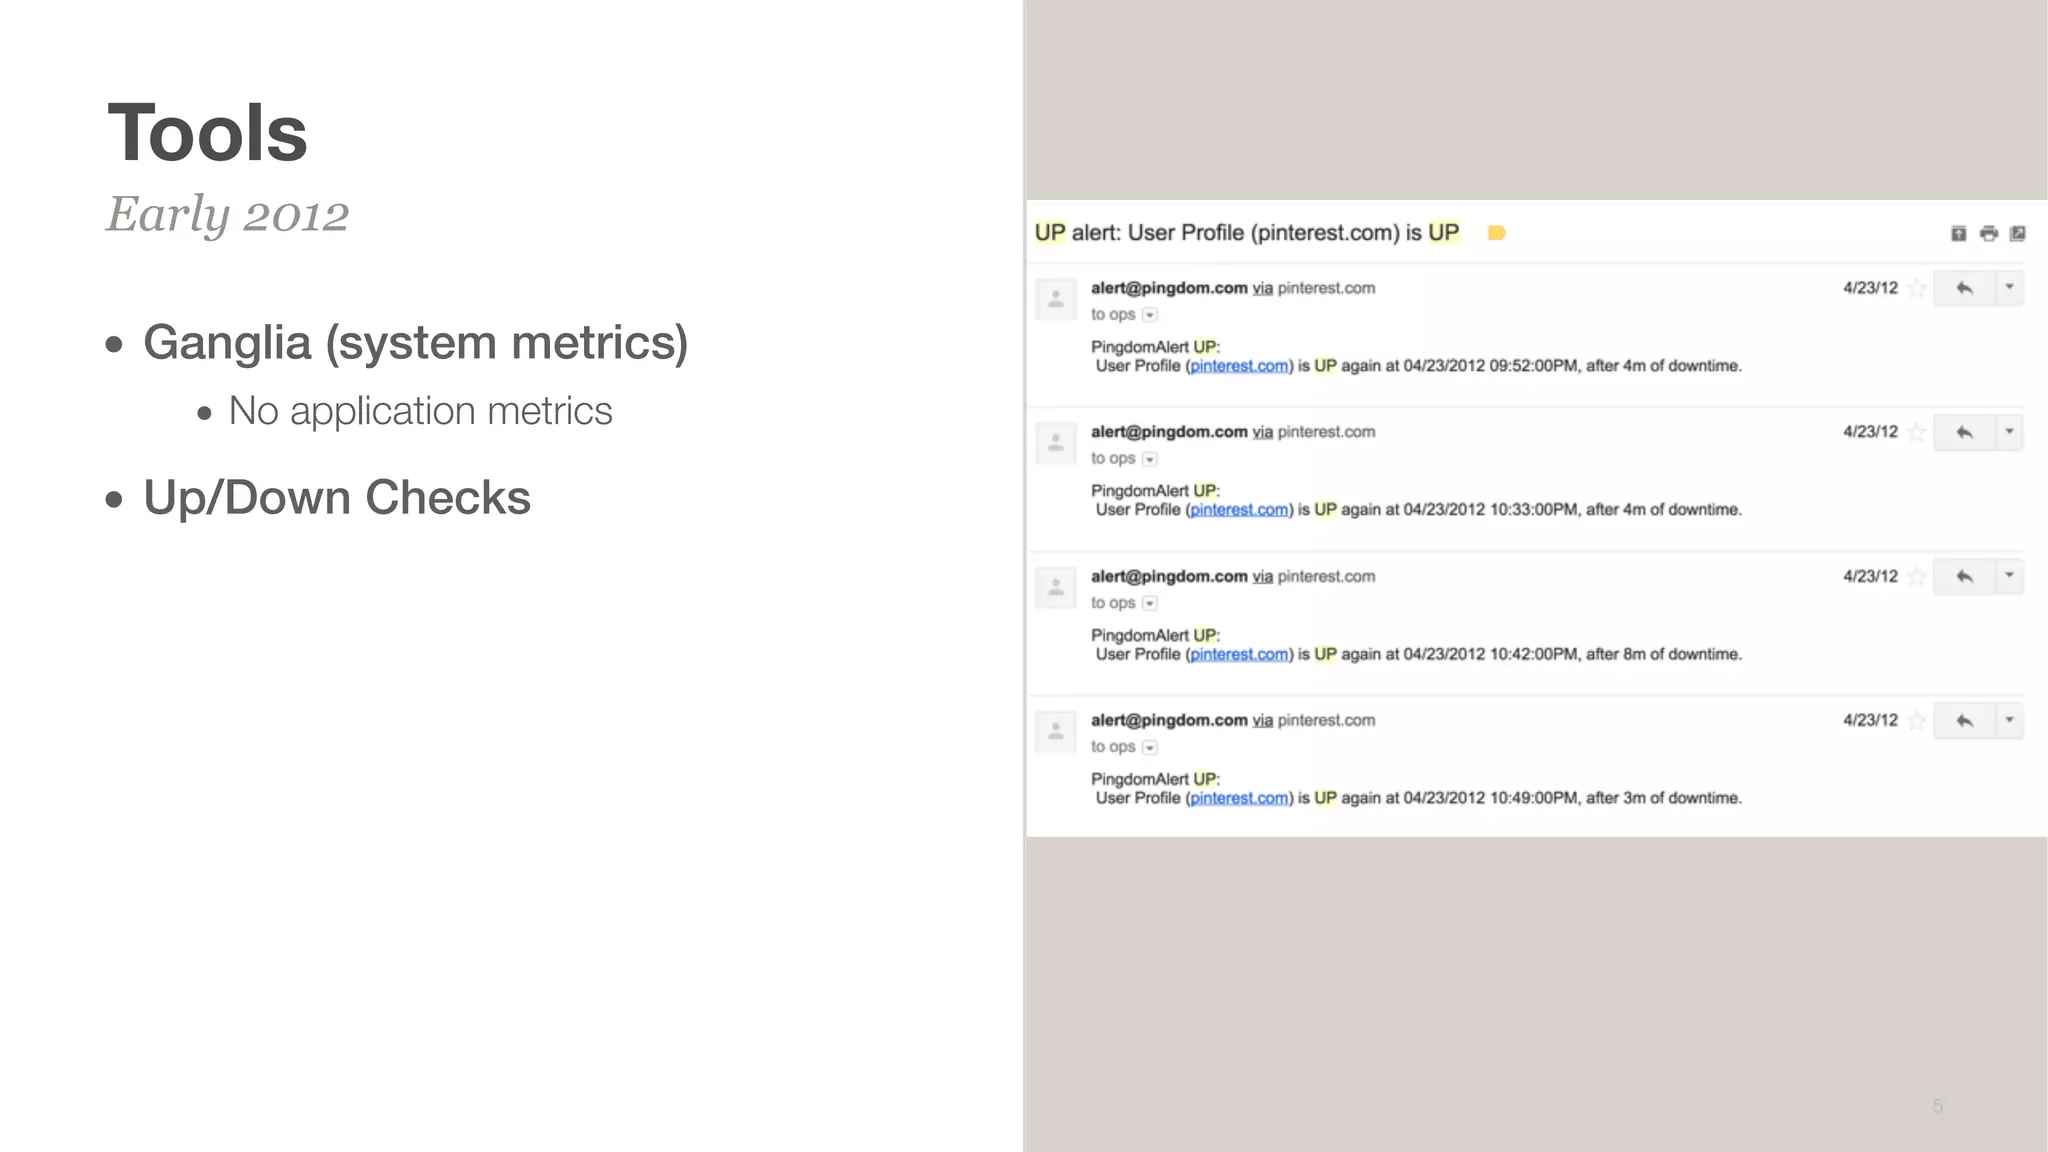
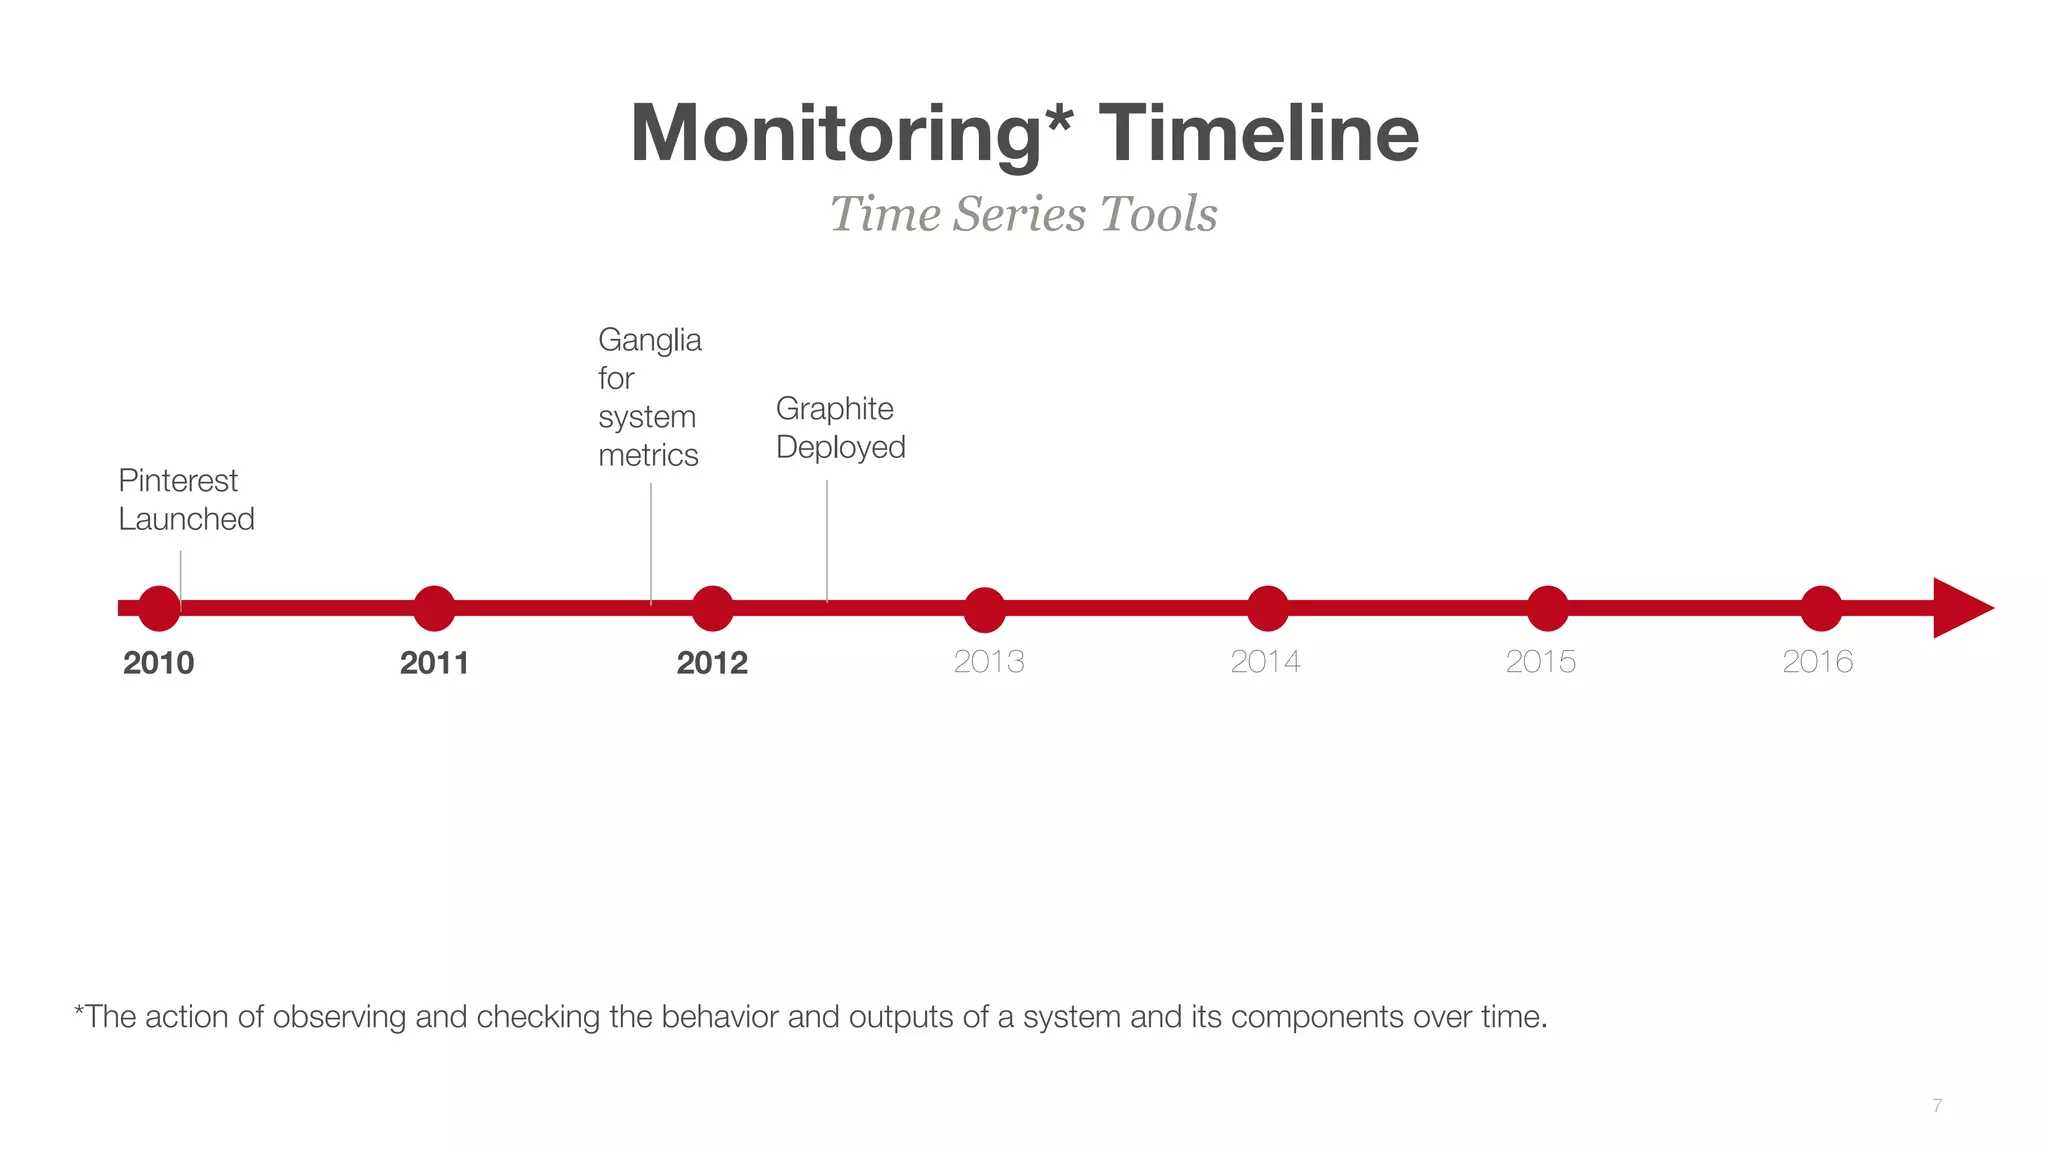
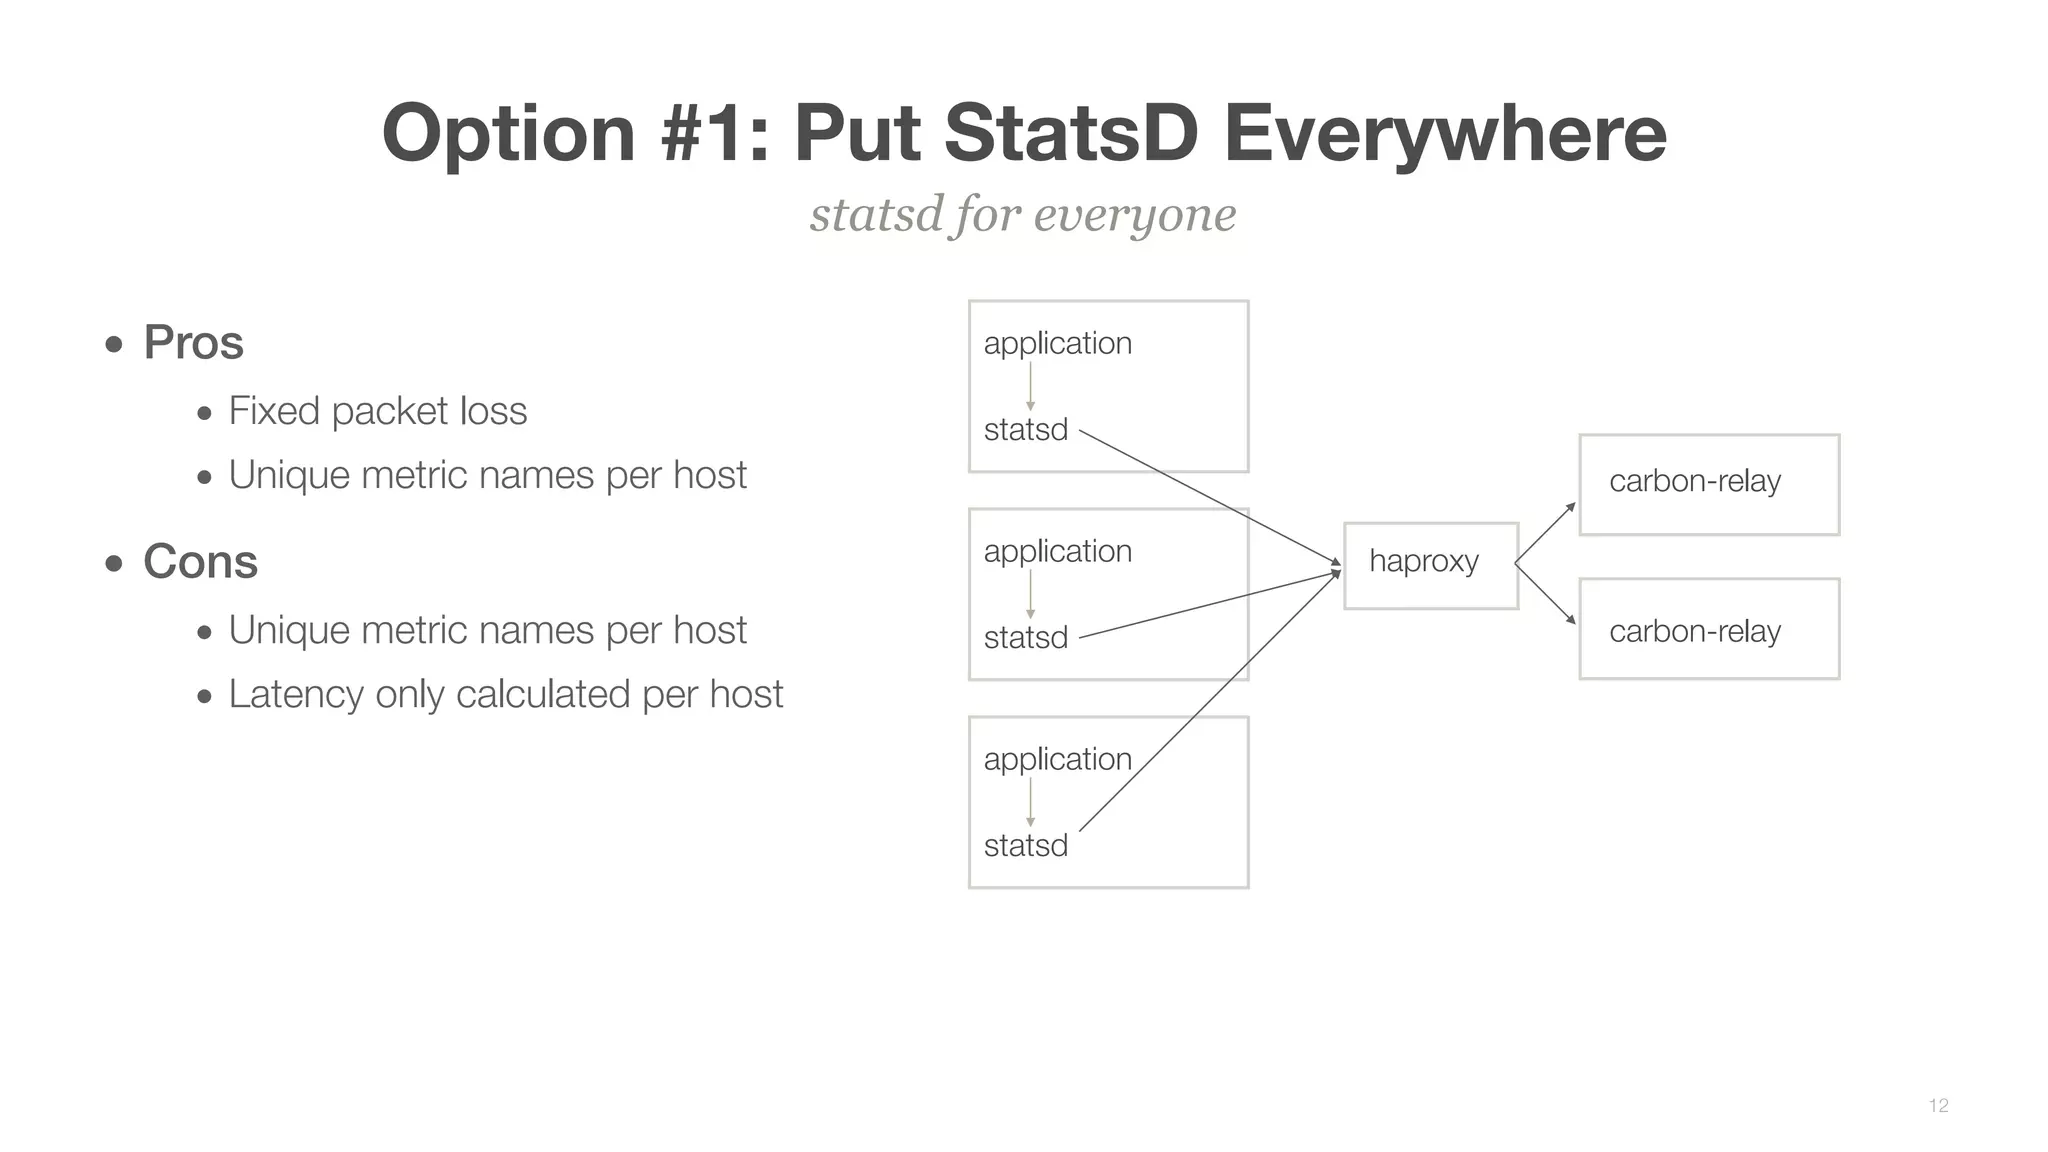
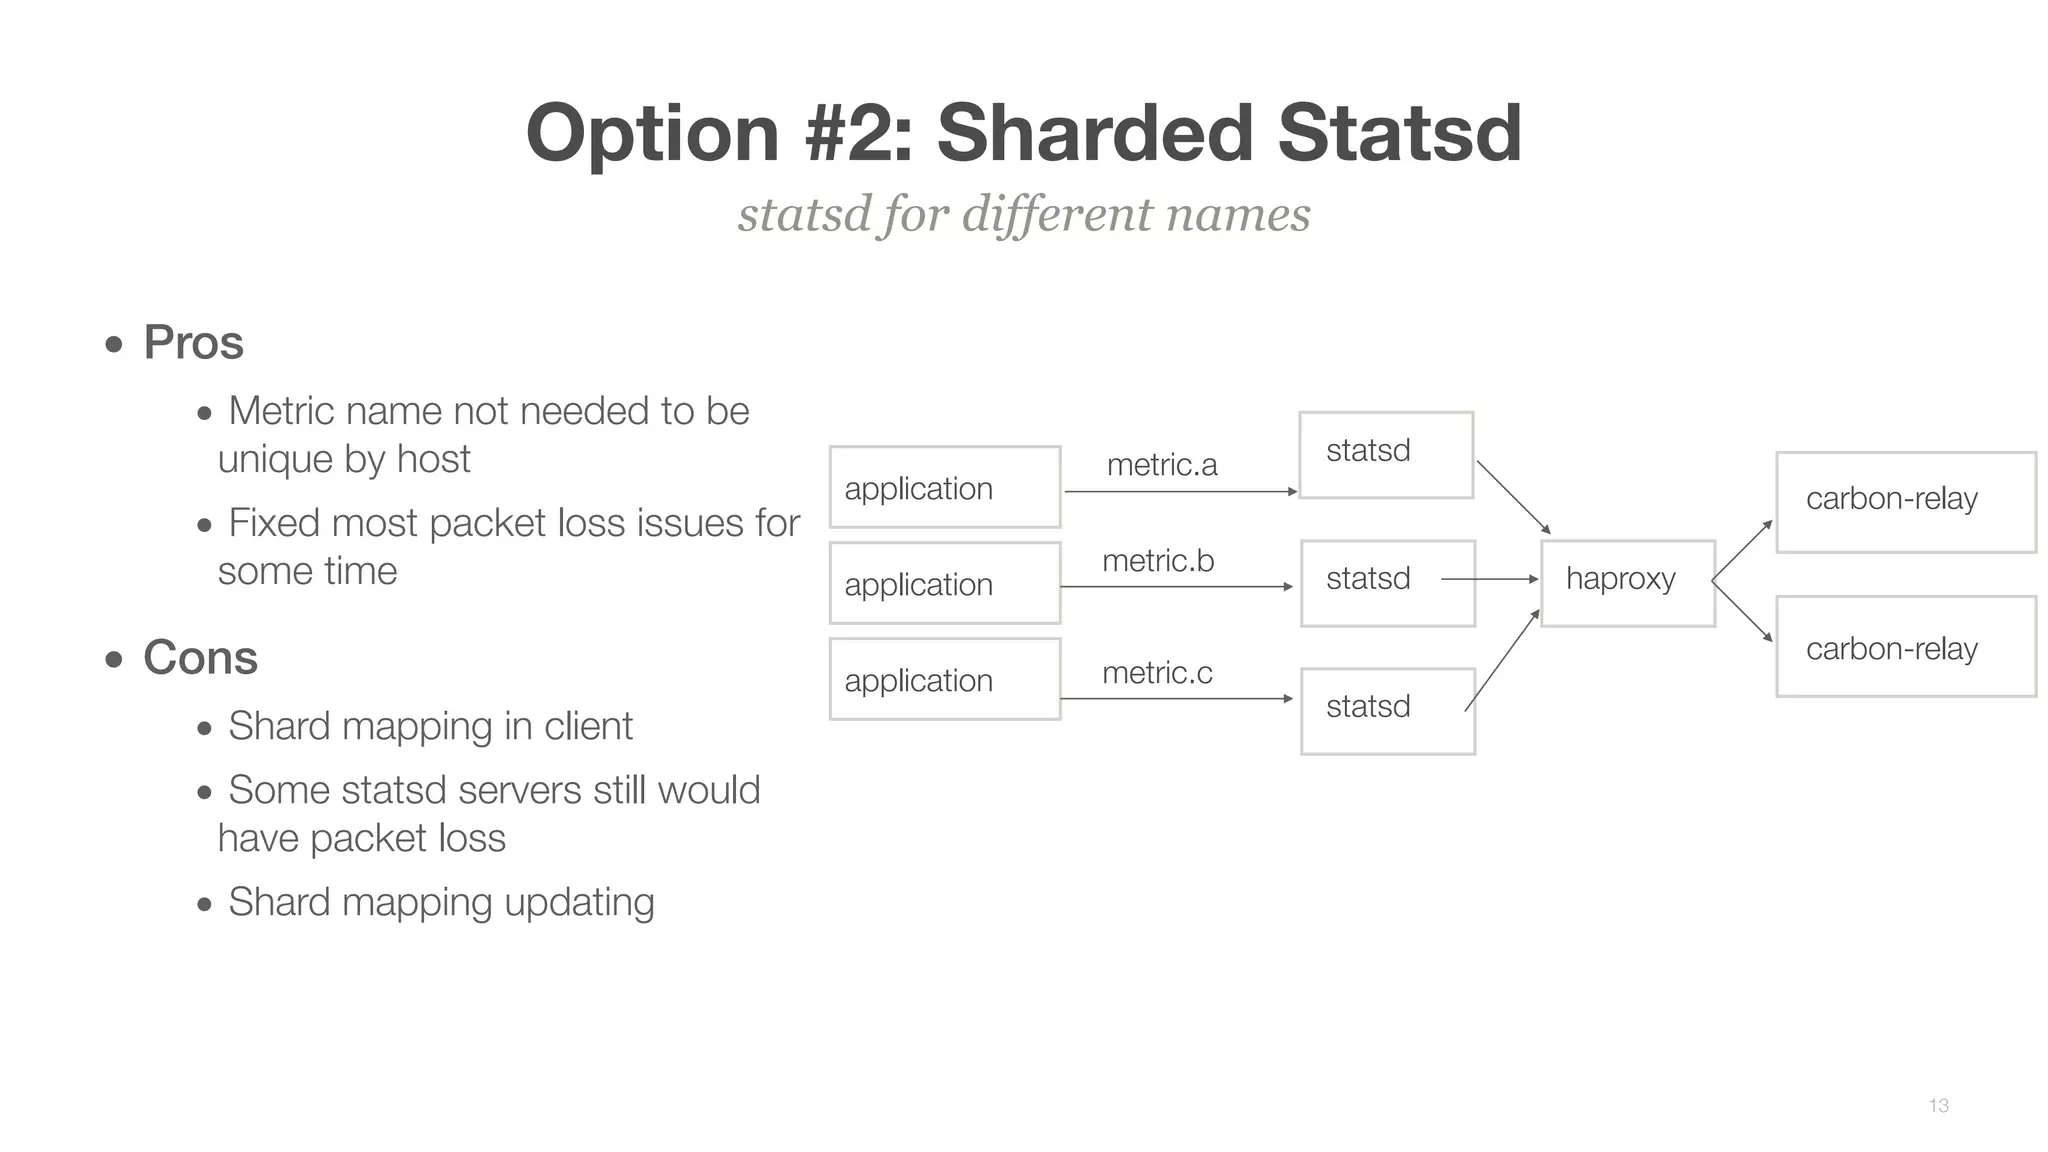
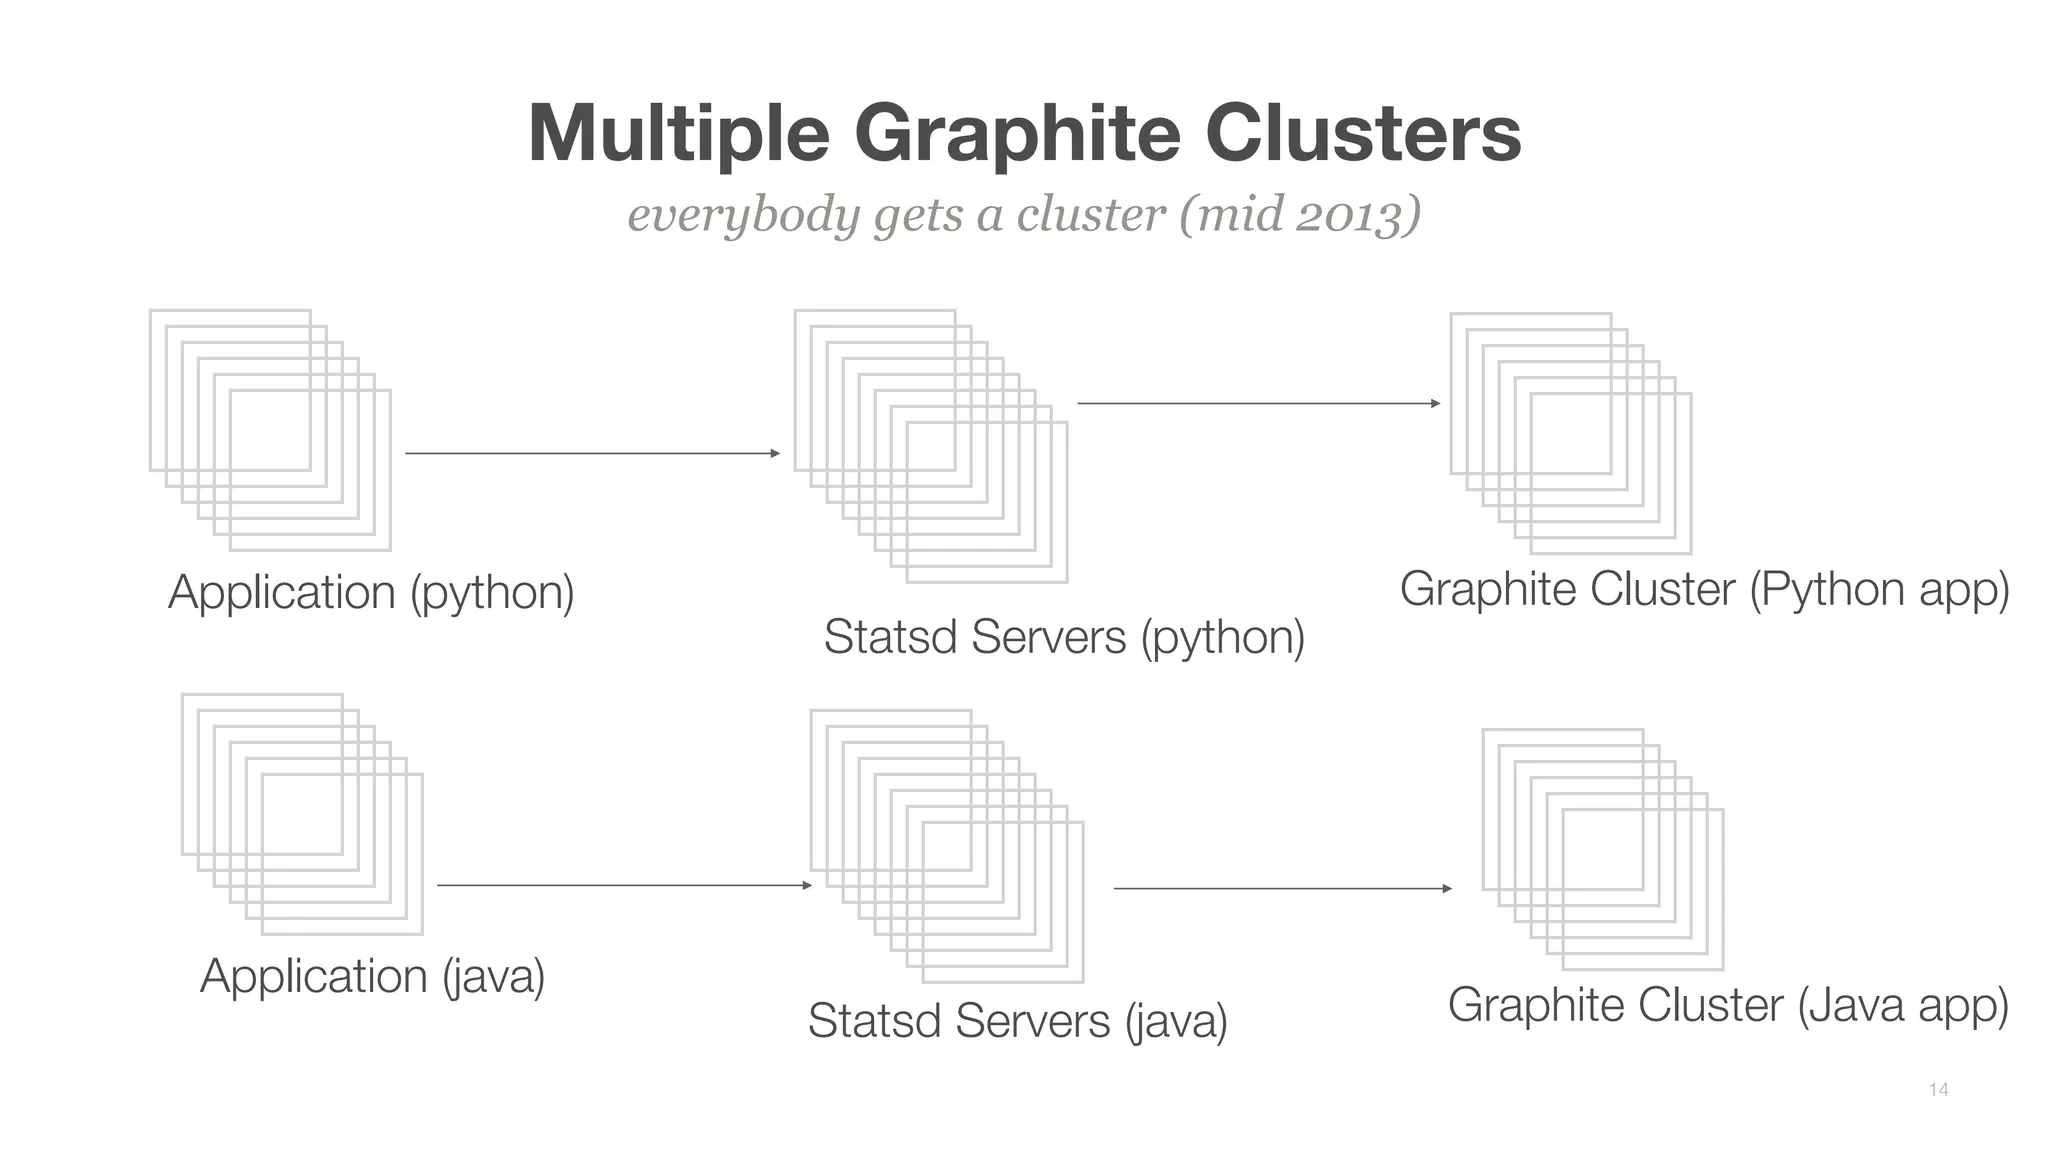
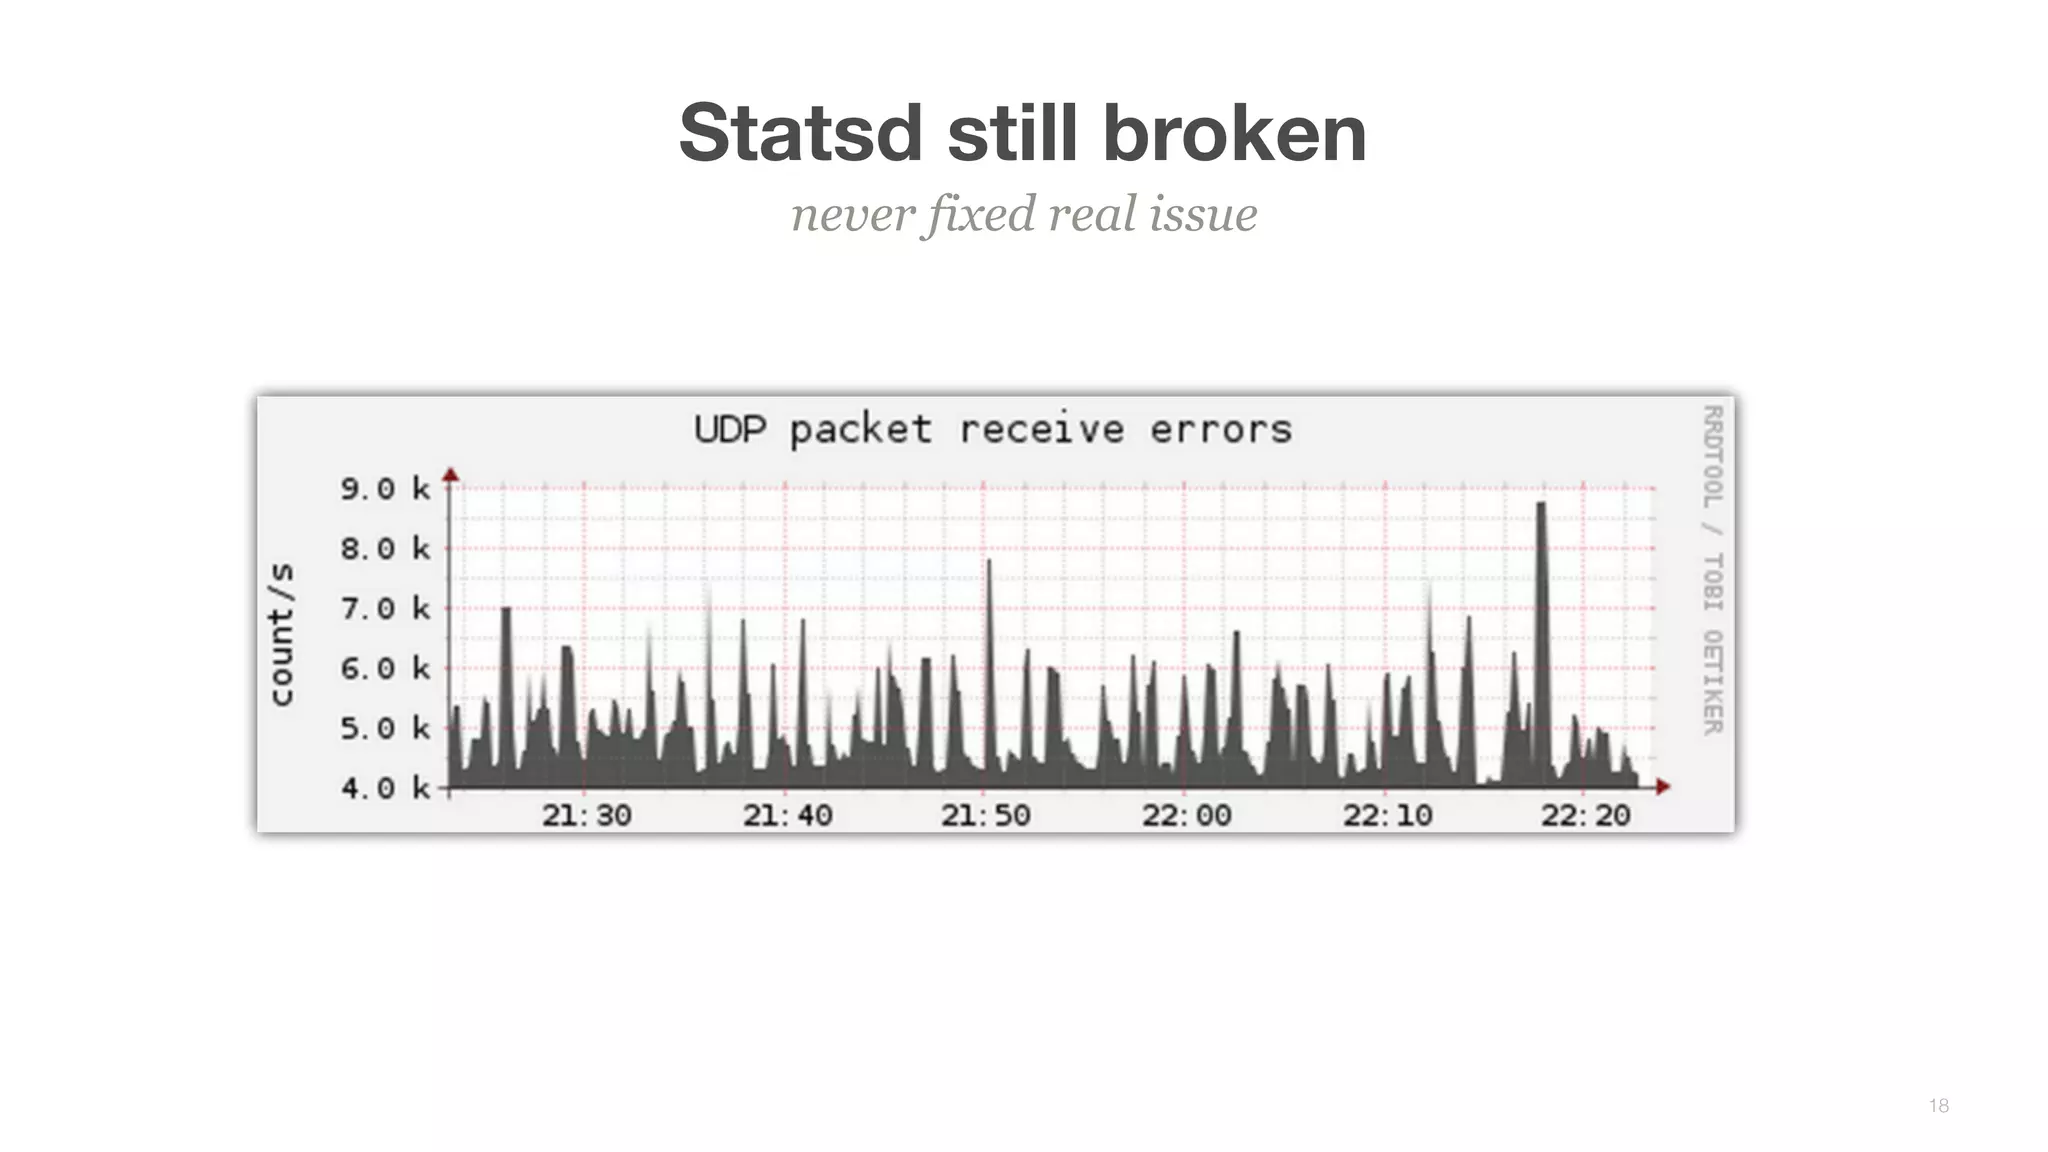
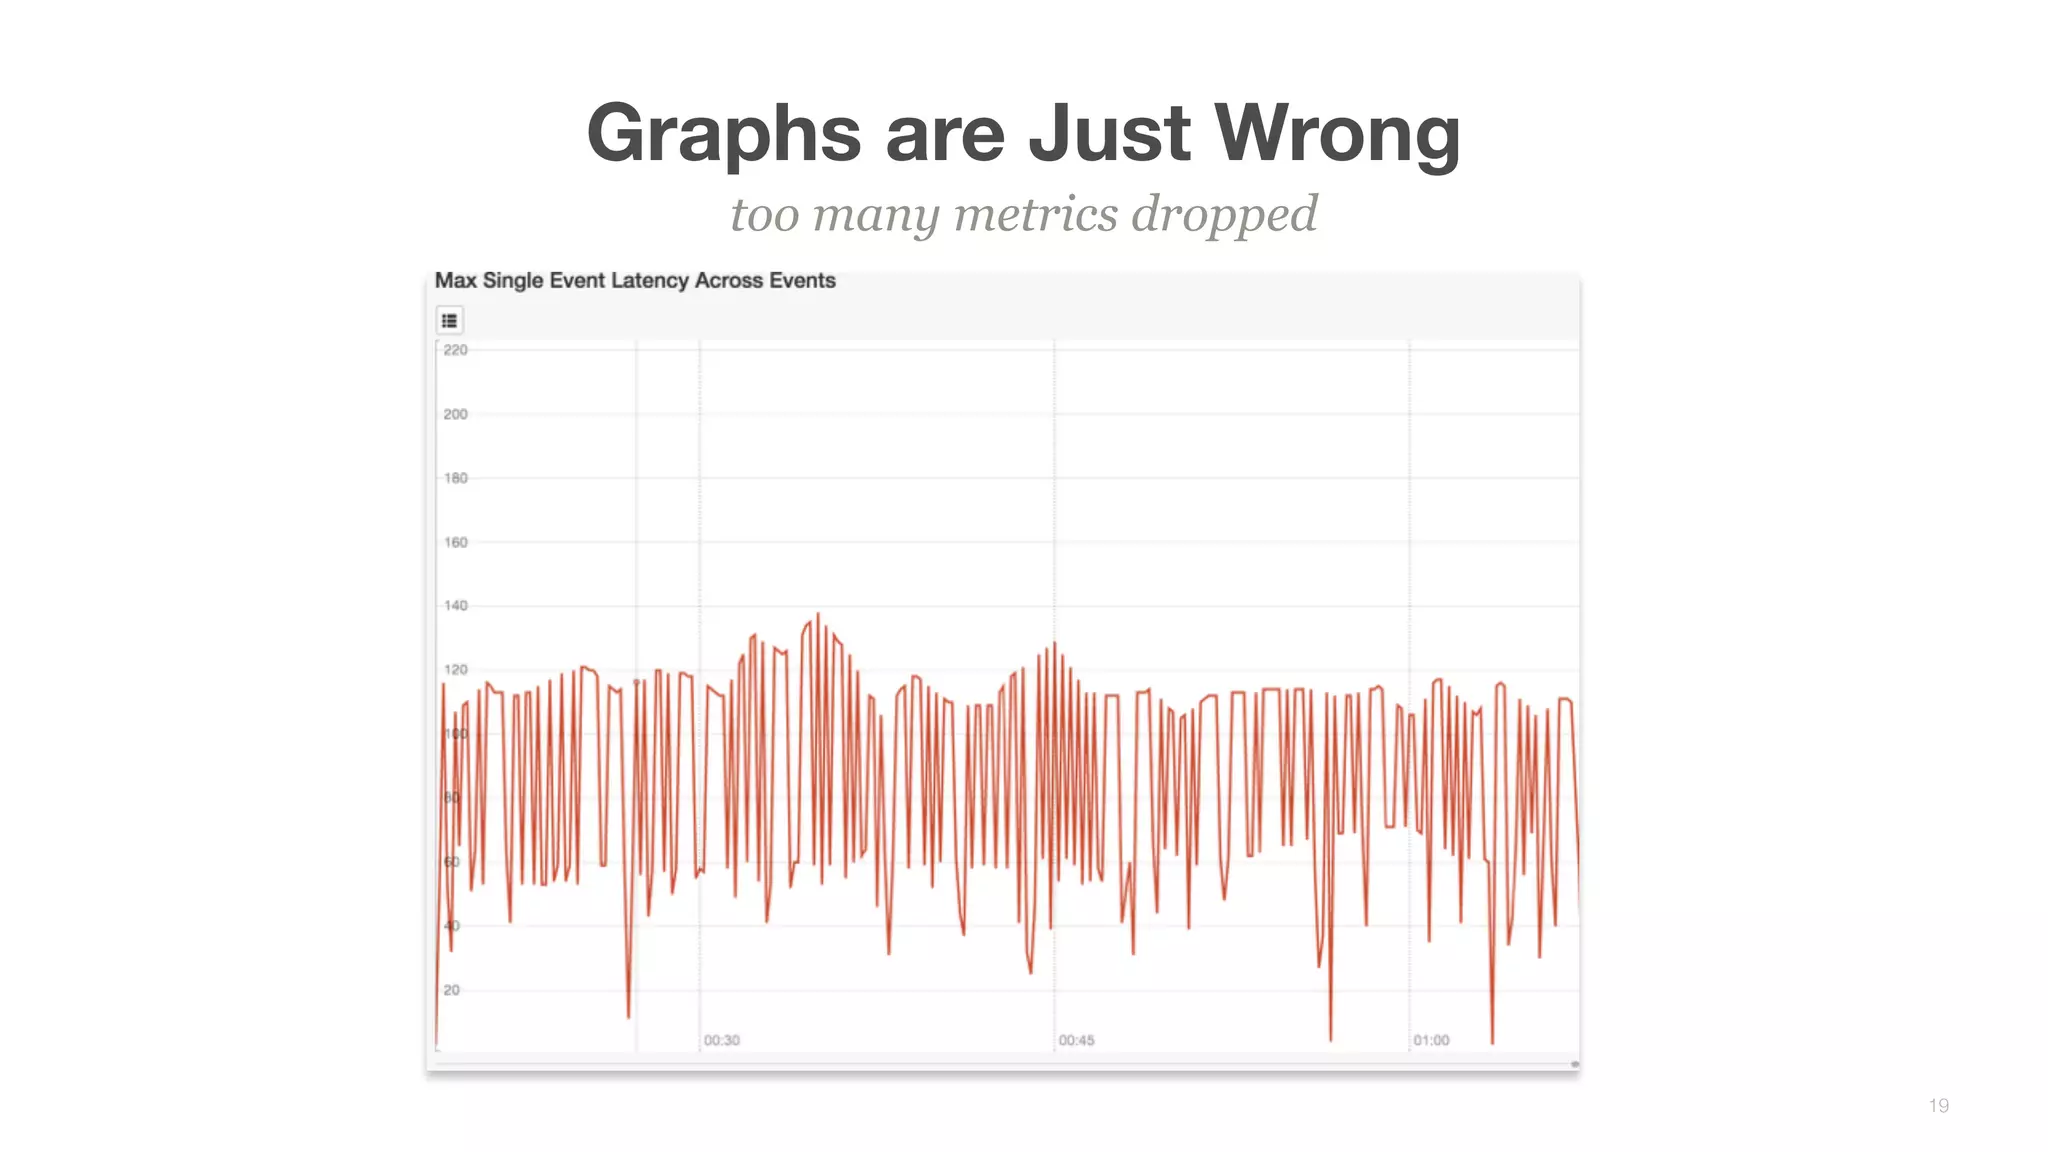
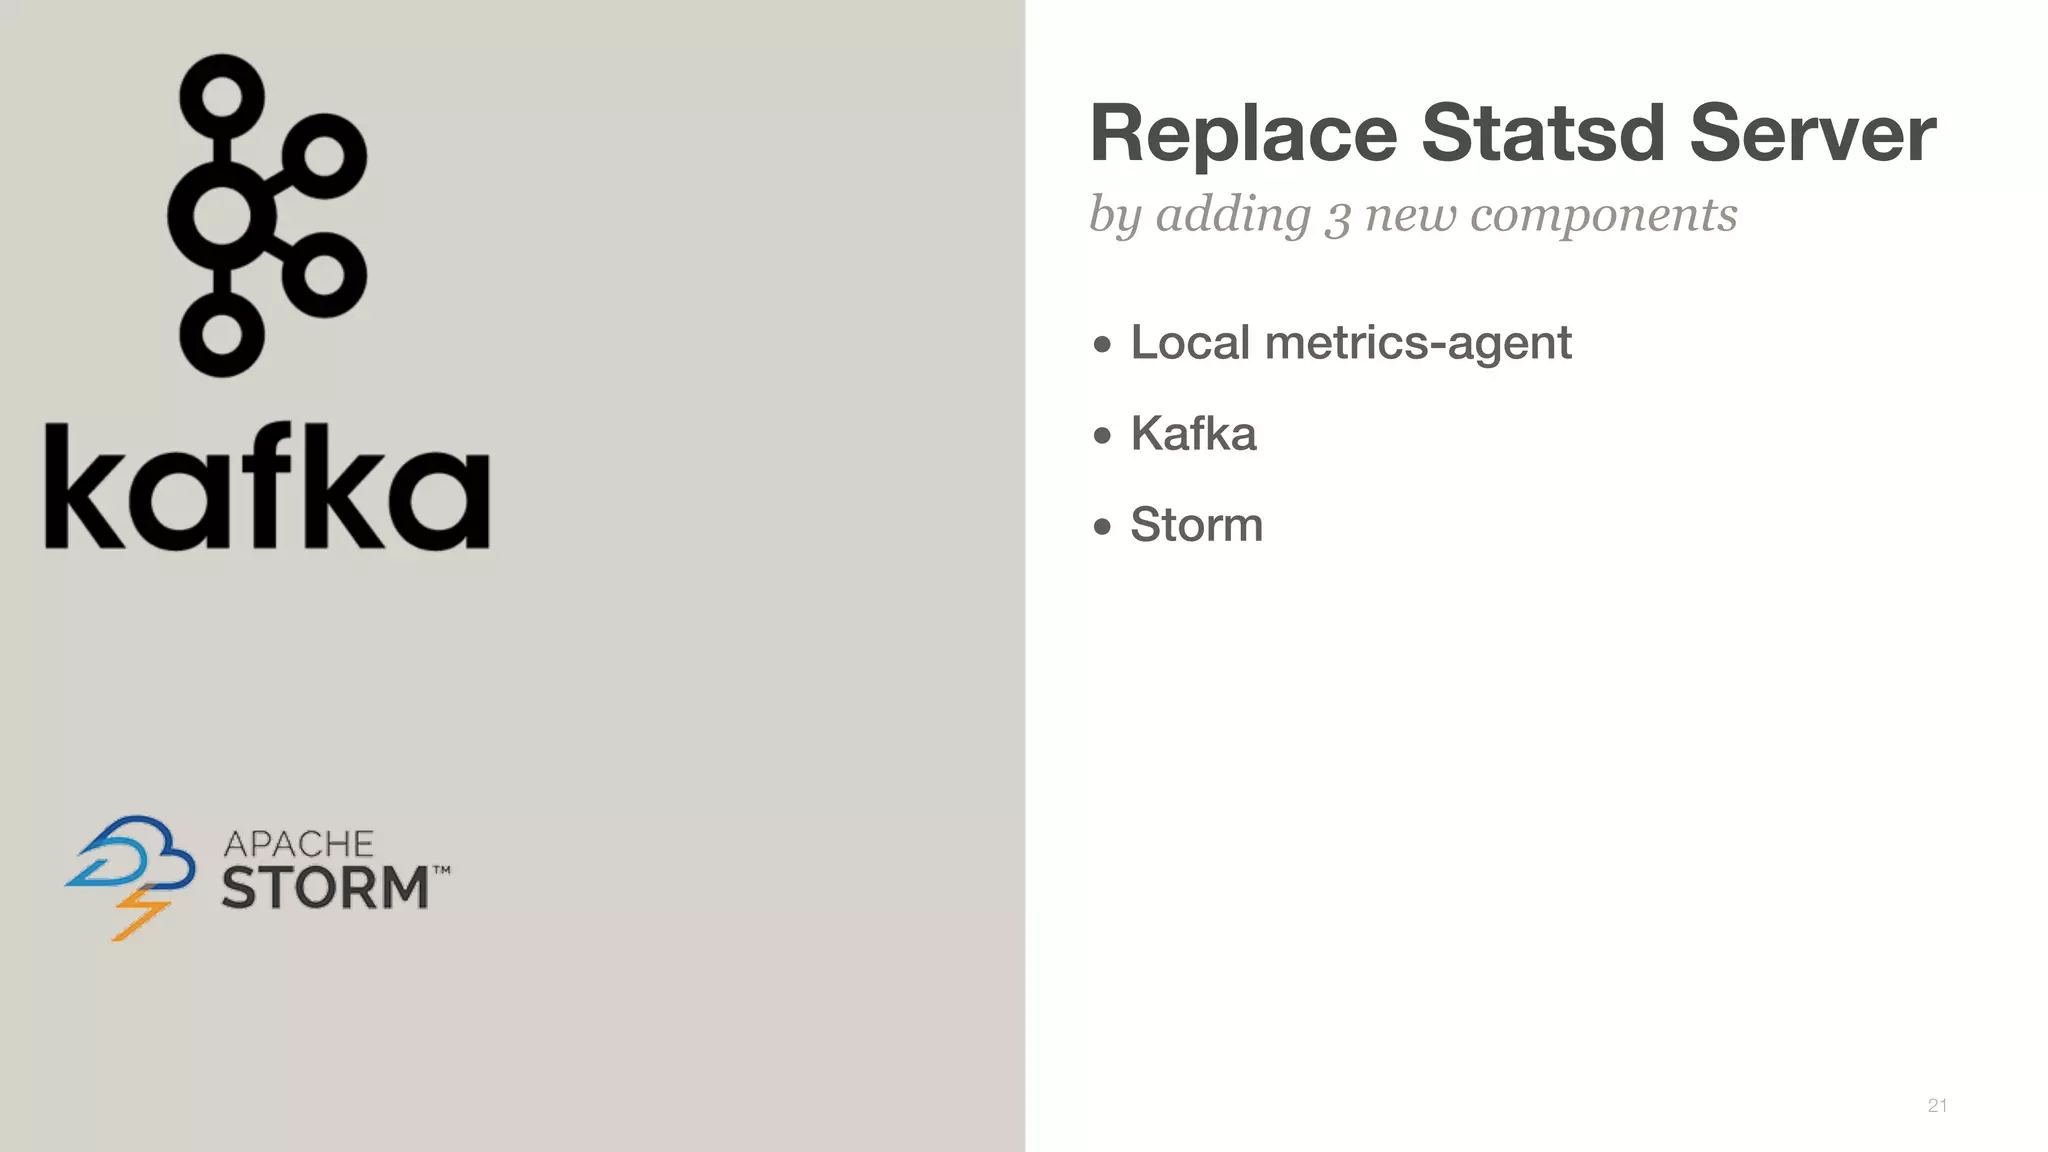
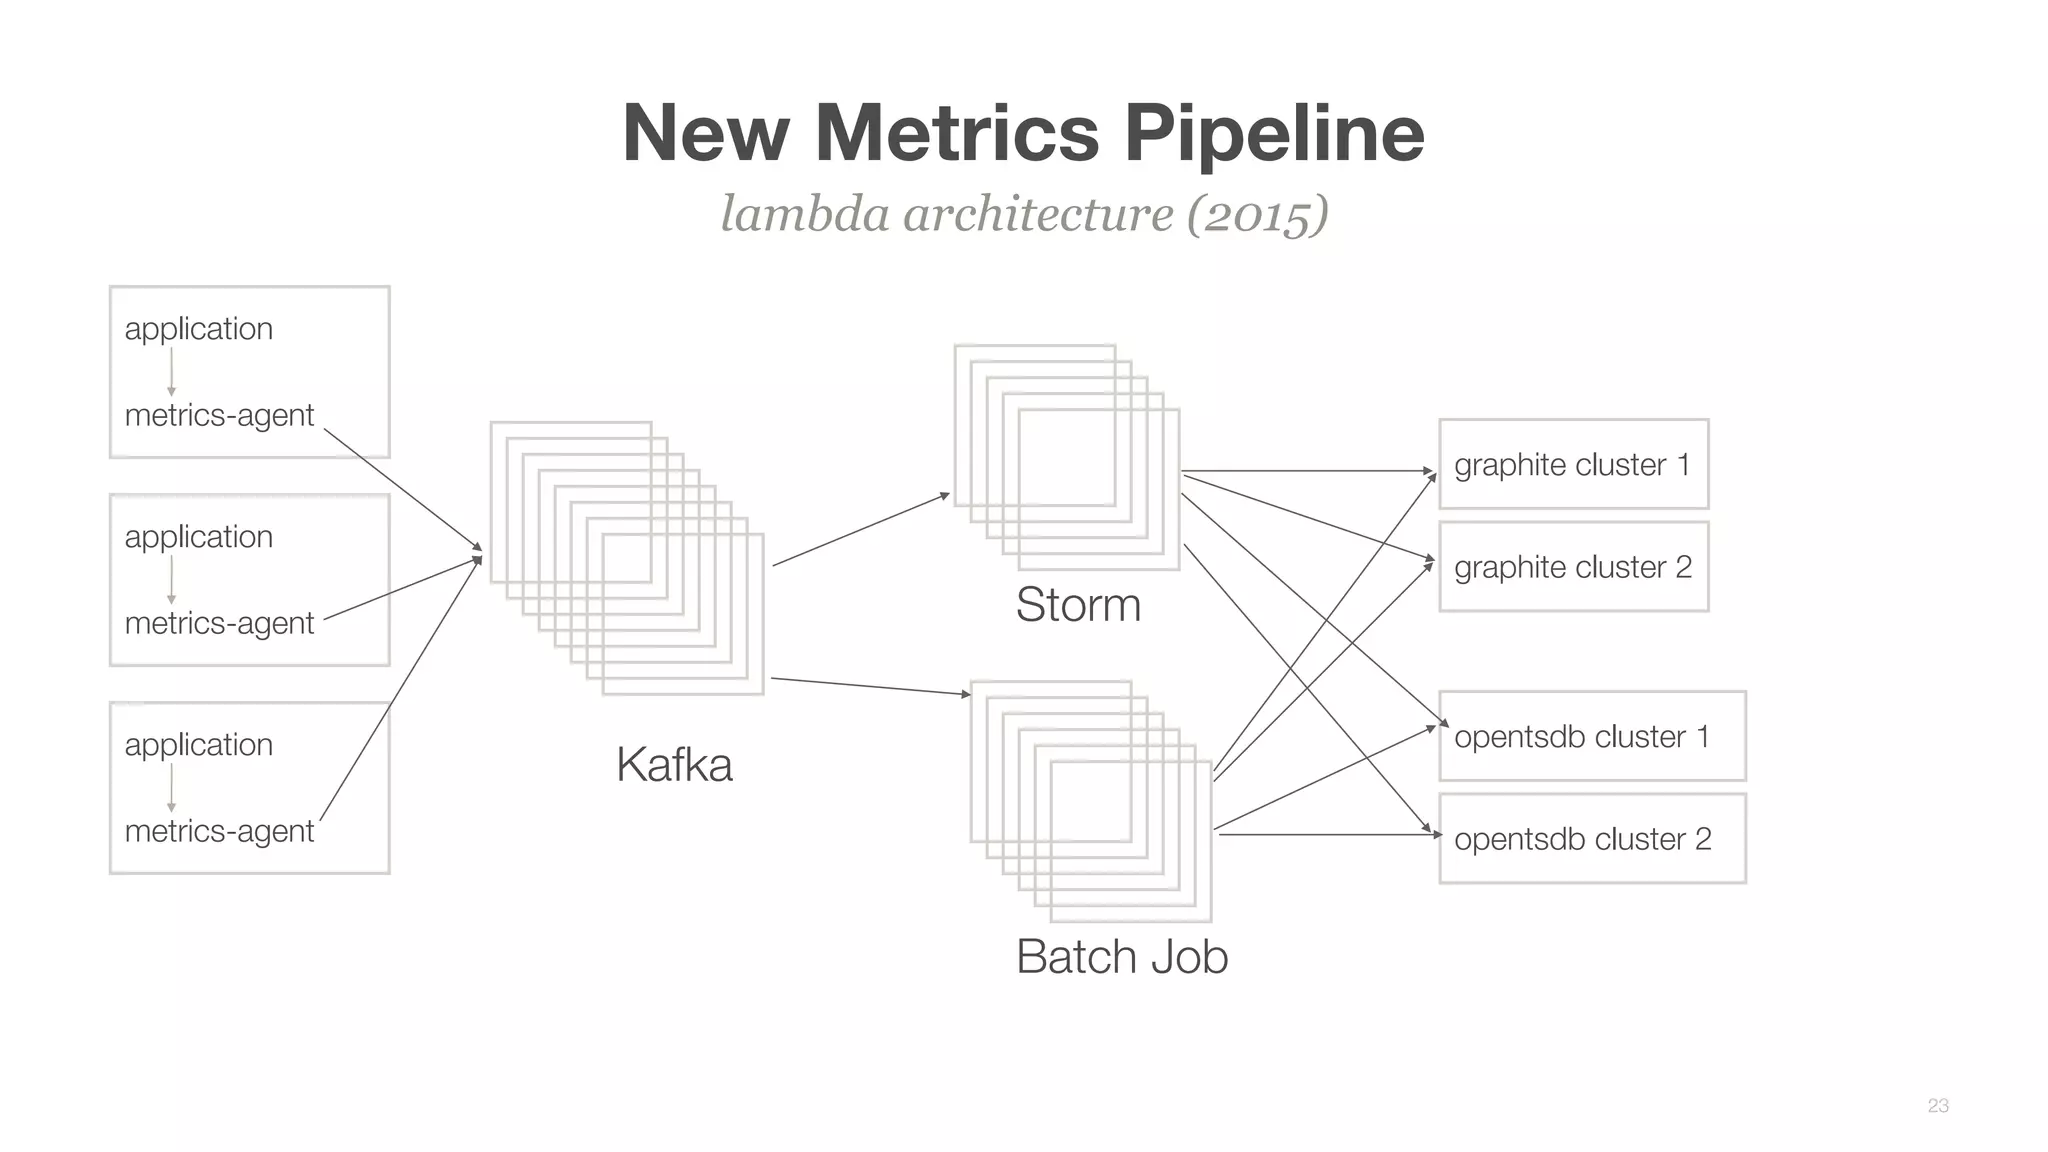
Scaling Pinterest’s Monitoring
1
Brian Overstreet - Visibility Software Engineer
Monitorama Agenda
• What is Pinterest?
• Starting from Scratch
• Scaling the Monitoring System
• Focused on time series metrics
• Challenges faced
• The Missing Element
• Lessons Learned
• Summary
Scaling Pinterest’s Monitoring
2
75+ Billion Ideas
categorized by people into more than

1 Billion Boards
3
4
Pinterest Unique VisitorsVisitors(millions)
0
10
20
30
40
Jan 2011 Apr 2011 Jul 2011 Oct 2011 Jan 2012 Apr 2012 Jul 2012 Jan 2013
Source: comscore
Tools
• Ganglia (system metrics)
• No application metrics
• Up/Down Checks
Early 2012
5
From Bad to Worse
Lots of Outages
6
Monitoring* Timeline
Time Series Tools
7
Pinterest
Launched
Graphite
Deployed
Ganglia
for
system
metrics
2010 20122011 2013 2014 2015 2016
*The action of observing and checking the behavior and outputs of a system and its components over time.
First Graphite Architecture
Single Box — Early 2012
8
Application
graphite-web
carbon-cache
statsd-server
Metrics Box
statsd UDP protocol
First Graphite Architecture
Single Box — Early 2012
9
Application
carbon-cache
statsd-server
Metrics Box
statsd UDP protocol
graphite-web
Second Graphite Architecture
Clustered — Early 2013
10
Application
haproxystatsd server
carbon-relay
carbon-relay
carbon-cache * 4
graphite-web
carbon-cache * 4
graphite-web
carbon-cache * 4
graphite-web
haproxy
graphite-web
Second Graphite Architecture
Clustered — Early 2013
11
Application
haproxystatsd server
carbon-relay
carbon-relay
carbon-cache * 4
graphite-web
carbon-cache * 4
graphite-web
carbon-cache * 4
graphite-web
haproxy
graphite-web
Option #1: Put StatsD Everywhere
• Pros
• Fixed packet loss
• Unique metric names per host
• Cons
• Unique metric names per host
• Latency only calculated per host
statsd for everyone
12
statsd
application
statsd
application
statsd
application
haproxy
carbon-relay
carbon-relay
Option #2: Sharded Statsd
• Pros
• Metric name not needed to be
unique by host
• Fixed most packet loss issues for
some time
• Cons
• Shard mapping in client
• Some statsd servers still would
have packet loss
• Shard mapping updating
statsd for different names
13
application
haproxy
carbon-relay
carbon-relay
application
application
statsd
statsd
statsd
metric.a
metric.b
metric.c
Multiple Graphite Clusters
everybody gets a cluster (mid 2013)
14
Application (python)
Statsd Servers (python)
Graphite Cluster (Java app)
Application (java)
Statsd Servers (java)
Graphite Cluster (Python app)
User Quote
• “Graphite isn't powerful enough to handle two globs in a request, so
‘obelix.pin.prod.*.*.metrics.coll.p99’ doesn't return anything most of the time.
With just one glob it usually works, but it can be very slow.”
on querying metrics in Graphite
15
Monitoring* Timeline
Time Series Tools
16
Pinterest
Launched
Graphite
Deployed
Ganglia
for
system
metrics
2010 20122011 2013 2014 2015 2016
OpenTSDB
Deployed
*The action of observing and checking the behavior and outputs of a system and its components over time.
User Quote
• “… convinced me to try out OpenTSDB, and I am VERY GLAD they did. The
interface isn't perfect, but it does let you construct queries quickly, and the data
is all there, easy to slice by tag and *fast*. I couldn't be happier, and it has saved
me hours of frustration and confusion over the last few days while tracking down
latency issues in our search clusters.”
on using OpenTSDB
17
Statsd still broken
never fixed real issue
18
Graphs are Just Wrong
too many metrics dropped
19
User Quotes
• “At this point I would give just about anything for a time-series database that I
could trust. The numbers coming out of graphite from the client and server sides
don't match, and neither of them match with the ganglia numbers.”
• “I don't know which to trust; even the shapes are different, so I'm no longer
convinced that the relative changes are right. That makes it hard for me to tell if
my theories are wrong, or the numbers are wrong, or both.”
on time series metrics
20
Replace Statsd Server
• Local metrics-agent
• Kafka
• Storm
by adding 3 new components
21
Metrics-agent
• Gatekeeper for time series data
• Interface for OpenTSDB and StatsD
• different ports
• Sends metrics to Kafka
• Needed to convert o Kafka pipeline with no downtime
• Double write to existing StatsD servers and Kafka
everybody gets an agent
22
New Metrics Pipeline
lambda architecture (2015)
23
Kafka
Storm
Batch Job
metrics-agent
application
metrics-agent
application
metrics-agent
application
graphite cluster 1
graphite cluster 2
opentsdb cluster 1
opentsdb cluster 2
Fixed Graphs
no more packet loss
24
Current Write Throughput
• Graphite
•120,000 points/second
• OpenTSDB
• 1.5 million points/second
Graphite and OpenTSDB
25
Statsboard
• Integrates Graphite, Ganglia,
OpenTSDB metrics
• Adds Graphite like functions to
OpenTSDB
• asPercent
• diffSeries
• integral
• sumSeries
• etc.
Time Series Dashboards and Alerts
26
Statsboard Config
• Dashboards
- "Outbound QPS Metrics":
- title: "Outbound QPS (by %)"
metrics:
- stat: metric_name_1
• Alerts
Alert Name:
threshold: metric > 100
pagerduty: service_name
Yet Another YAML Config Format
27
The Missing Element
The users
28
User Quotes on Graphite
• “I'm not saying Graphite isn't evil. It's evil. I'm just saying that if you spend a
week staring at it hard enough you can make some sense out of the madness :)”
• “I do not believe graphite is 'evil' since this is how RRD datasets have worked
since 1999.”
• “I don't think anyone is complaining about rrdtool, which is as much at fault for
Graphite as the Linux OS on which it runs. The problem is that you have to know
a lot of things to get correct results from a Graphite plot, and none of those
things are easy to find out (as John says, none of them appear on the data
plot).”
Graphite is Evil?
29
What about OpenTSDB?
I thought users were happy.
30
OpenTSDB Aggregation
• “Something is wrong with
OpenTSDB. My lines are often
unnaturally straight. Can you fix it?”
What exactly is getting aggregated?
31
Graphite User Education
• What RRDs are and how to normalize across intervals
• Metric summarization into next interval
• Getting requests/second from a timer
• Difference between stats and stats_counts
• Should I use hitcount or integral to calculate totals?
Train Users on System
32
OpenTSDB User Education
• Getting data from continually incrementing counters
• Interpolation of data points
• How aggregation works
• Query Optimization
Train Users on System — OpenTSDB
33
What else have we learned?
Besides system architecture and doing user education
34
Protect System from Clients
• Alert on unique metrics
• Block metrics using Zookeeper
Must control incoming metrics
35
metrics-agent
application
opentsdb
zookeeper
counts by common prefix
Alert on Prefix Count
on-call engineer
prefix block list
Trusting the Data
• Cannot control how users use the data
• Do not want business decisions off of wrong data
• Measuring data accuracy is hard
• Count metrics generated vs. metrics written at every phase.
• Lots of places a metric can get lost and not known that it was lost
Need to measure data points lost
36
Lessen Aggregator Overhead
• StatsD performs network call to update
a metric
• Manually tune sample rate to lessen overhead
(time consuming)
• Java uses Ostrich library for in process
aggregation
Ideally In Process
37
metrics-agent
Java Application
Ostrich
metrics-agent
StatsD Client
Lessen Operational Overhead
• More tools, more overhead
• Adding boxes to Graphite is hard
• Adding boxes to OpenTSDB is easy
• More monitoring systems, more monitoring of the monitoring system
• Removing a tool in production is hard
• Ganglia, Graphite, and OpenTSDB all still running
• As product gets more 9s so must the monitoring tools.
Fewer Tools?
38
Set User Expectations
• Data has a lifetime
• Unless otherwise conveyed, most users expect data to exist indefinitely.
• Not magical data warehouse tools that return data instantly
• Not all metrics will be efficient
I didn’t expect this talk to go on so long
39
Summary
• Match the monitoring system to where the company is at
• User education is key to scale these tools organizationally
• Tools scale with number of engineers not users of site
Thanks for listening
40

Scaling Pinterest's Monitoring

  • 1.
    Scaling Pinterest’s Monitoring 1 BrianOverstreet - Visibility Software Engineer
  • 2.
    Monitorama Agenda • Whatis Pinterest? • Starting from Scratch • Scaling the Monitoring System • Focused on time series metrics • Challenges faced • The Missing Element • Lessons Learned • Summary Scaling Pinterest’s Monitoring 2
  • 3.
    75+ Billion Ideas categorizedby people into more than
 1 Billion Boards 3
  • 4.
    4 Pinterest Unique VisitorsVisitors(millions) 0 10 20 30 40 Jan2011 Apr 2011 Jul 2011 Oct 2011 Jan 2012 Apr 2012 Jul 2012 Jan 2013 Source: comscore
  • 5.
    Tools • Ganglia (systemmetrics) • No application metrics • Up/Down Checks Early 2012 5
  • 6.
    From Bad toWorse Lots of Outages 6
  • 7.
    Monitoring* Timeline Time SeriesTools 7 Pinterest Launched Graphite Deployed Ganglia for system metrics 2010 20122011 2013 2014 2015 2016 *The action of observing and checking the behavior and outputs of a system and its components over time.
  • 8.
    First Graphite Architecture SingleBox — Early 2012 8 Application graphite-web carbon-cache statsd-server Metrics Box statsd UDP protocol
  • 9.
    First Graphite Architecture SingleBox — Early 2012 9 Application carbon-cache statsd-server Metrics Box statsd UDP protocol graphite-web
  • 10.
    Second Graphite Architecture Clustered— Early 2013 10 Application haproxystatsd server carbon-relay carbon-relay carbon-cache * 4 graphite-web carbon-cache * 4 graphite-web carbon-cache * 4 graphite-web haproxy graphite-web
  • 11.
    Second Graphite Architecture Clustered— Early 2013 11 Application haproxystatsd server carbon-relay carbon-relay carbon-cache * 4 graphite-web carbon-cache * 4 graphite-web carbon-cache * 4 graphite-web haproxy graphite-web
  • 12.
    Option #1: PutStatsD Everywhere • Pros • Fixed packet loss • Unique metric names per host • Cons • Unique metric names per host • Latency only calculated per host statsd for everyone 12 statsd application statsd application statsd application haproxy carbon-relay carbon-relay
  • 13.
    Option #2: ShardedStatsd • Pros • Metric name not needed to be unique by host • Fixed most packet loss issues for some time • Cons • Shard mapping in client • Some statsd servers still would have packet loss • Shard mapping updating statsd for different names 13 application haproxy carbon-relay carbon-relay application application statsd statsd statsd metric.a metric.b metric.c
  • 14.
    Multiple Graphite Clusters everybodygets a cluster (mid 2013) 14 Application (python) Statsd Servers (python) Graphite Cluster (Java app) Application (java) Statsd Servers (java) Graphite Cluster (Python app)
  • 15.
    User Quote • “Graphiteisn't powerful enough to handle two globs in a request, so ‘obelix.pin.prod.*.*.metrics.coll.p99’ doesn't return anything most of the time. With just one glob it usually works, but it can be very slow.” on querying metrics in Graphite 15
  • 16.
    Monitoring* Timeline Time SeriesTools 16 Pinterest Launched Graphite Deployed Ganglia for system metrics 2010 20122011 2013 2014 2015 2016 OpenTSDB Deployed *The action of observing and checking the behavior and outputs of a system and its components over time.
  • 17.
    User Quote • “…convinced me to try out OpenTSDB, and I am VERY GLAD they did. The interface isn't perfect, but it does let you construct queries quickly, and the data is all there, easy to slice by tag and *fast*. I couldn't be happier, and it has saved me hours of frustration and confusion over the last few days while tracking down latency issues in our search clusters.” on using OpenTSDB 17
  • 18.
    Statsd still broken neverfixed real issue 18
  • 19.
    Graphs are JustWrong too many metrics dropped 19
  • 20.
    User Quotes • “Atthis point I would give just about anything for a time-series database that I could trust. The numbers coming out of graphite from the client and server sides don't match, and neither of them match with the ganglia numbers.” • “I don't know which to trust; even the shapes are different, so I'm no longer convinced that the relative changes are right. That makes it hard for me to tell if my theories are wrong, or the numbers are wrong, or both.” on time series metrics 20
  • 21.
    Replace Statsd Server •Local metrics-agent • Kafka • Storm by adding 3 new components 21
  • 22.
    Metrics-agent • Gatekeeper fortime series data • Interface for OpenTSDB and StatsD • different ports • Sends metrics to Kafka • Needed to convert o Kafka pipeline with no downtime • Double write to existing StatsD servers and Kafka everybody gets an agent 22
  • 23.
    New Metrics Pipeline lambdaarchitecture (2015) 23 Kafka Storm Batch Job metrics-agent application metrics-agent application metrics-agent application graphite cluster 1 graphite cluster 2 opentsdb cluster 1 opentsdb cluster 2
  • 24.
    Fixed Graphs no morepacket loss 24
  • 25.
    Current Write Throughput •Graphite •120,000 points/second • OpenTSDB • 1.5 million points/second Graphite and OpenTSDB 25
  • 26.
    Statsboard • Integrates Graphite,Ganglia, OpenTSDB metrics • Adds Graphite like functions to OpenTSDB • asPercent • diffSeries • integral • sumSeries • etc. Time Series Dashboards and Alerts 26
  • 27.
    Statsboard Config • Dashboards -"Outbound QPS Metrics": - title: "Outbound QPS (by %)" metrics: - stat: metric_name_1 • Alerts Alert Name: threshold: metric > 100 pagerduty: service_name Yet Another YAML Config Format 27
  • 28.
  • 29.
    User Quotes onGraphite • “I'm not saying Graphite isn't evil. It's evil. I'm just saying that if you spend a week staring at it hard enough you can make some sense out of the madness :)” • “I do not believe graphite is 'evil' since this is how RRD datasets have worked since 1999.” • “I don't think anyone is complaining about rrdtool, which is as much at fault for Graphite as the Linux OS on which it runs. The problem is that you have to know a lot of things to get correct results from a Graphite plot, and none of those things are easy to find out (as John says, none of them appear on the data plot).” Graphite is Evil? 29
  • 30.
    What about OpenTSDB? Ithought users were happy. 30
  • 31.
    OpenTSDB Aggregation • “Somethingis wrong with OpenTSDB. My lines are often unnaturally straight. Can you fix it?” What exactly is getting aggregated? 31
  • 32.
    Graphite User Education •What RRDs are and how to normalize across intervals • Metric summarization into next interval • Getting requests/second from a timer • Difference between stats and stats_counts • Should I use hitcount or integral to calculate totals? Train Users on System 32
  • 33.
    OpenTSDB User Education •Getting data from continually incrementing counters • Interpolation of data points • How aggregation works • Query Optimization Train Users on System — OpenTSDB 33
  • 34.
    What else havewe learned? Besides system architecture and doing user education 34
  • 35.
    Protect System fromClients • Alert on unique metrics • Block metrics using Zookeeper Must control incoming metrics 35 metrics-agent application opentsdb zookeeper counts by common prefix Alert on Prefix Count on-call engineer prefix block list
  • 36.
    Trusting the Data •Cannot control how users use the data • Do not want business decisions off of wrong data • Measuring data accuracy is hard • Count metrics generated vs. metrics written at every phase. • Lots of places a metric can get lost and not known that it was lost Need to measure data points lost 36
  • 37.
    Lessen Aggregator Overhead •StatsD performs network call to update a metric • Manually tune sample rate to lessen overhead (time consuming) • Java uses Ostrich library for in process aggregation Ideally In Process 37 metrics-agent Java Application Ostrich metrics-agent StatsD Client
  • 38.
    Lessen Operational Overhead •More tools, more overhead • Adding boxes to Graphite is hard • Adding boxes to OpenTSDB is easy • More monitoring systems, more monitoring of the monitoring system • Removing a tool in production is hard • Ganglia, Graphite, and OpenTSDB all still running • As product gets more 9s so must the monitoring tools. Fewer Tools? 38
  • 39.
    Set User Expectations •Data has a lifetime • Unless otherwise conveyed, most users expect data to exist indefinitely. • Not magical data warehouse tools that return data instantly • Not all metrics will be efficient I didn’t expect this talk to go on so long 39
  • 40.
    Summary • Match themonitoring system to where the company is at • User education is key to scale these tools organizationally • Tools scale with number of engineers not users of site Thanks for listening 40