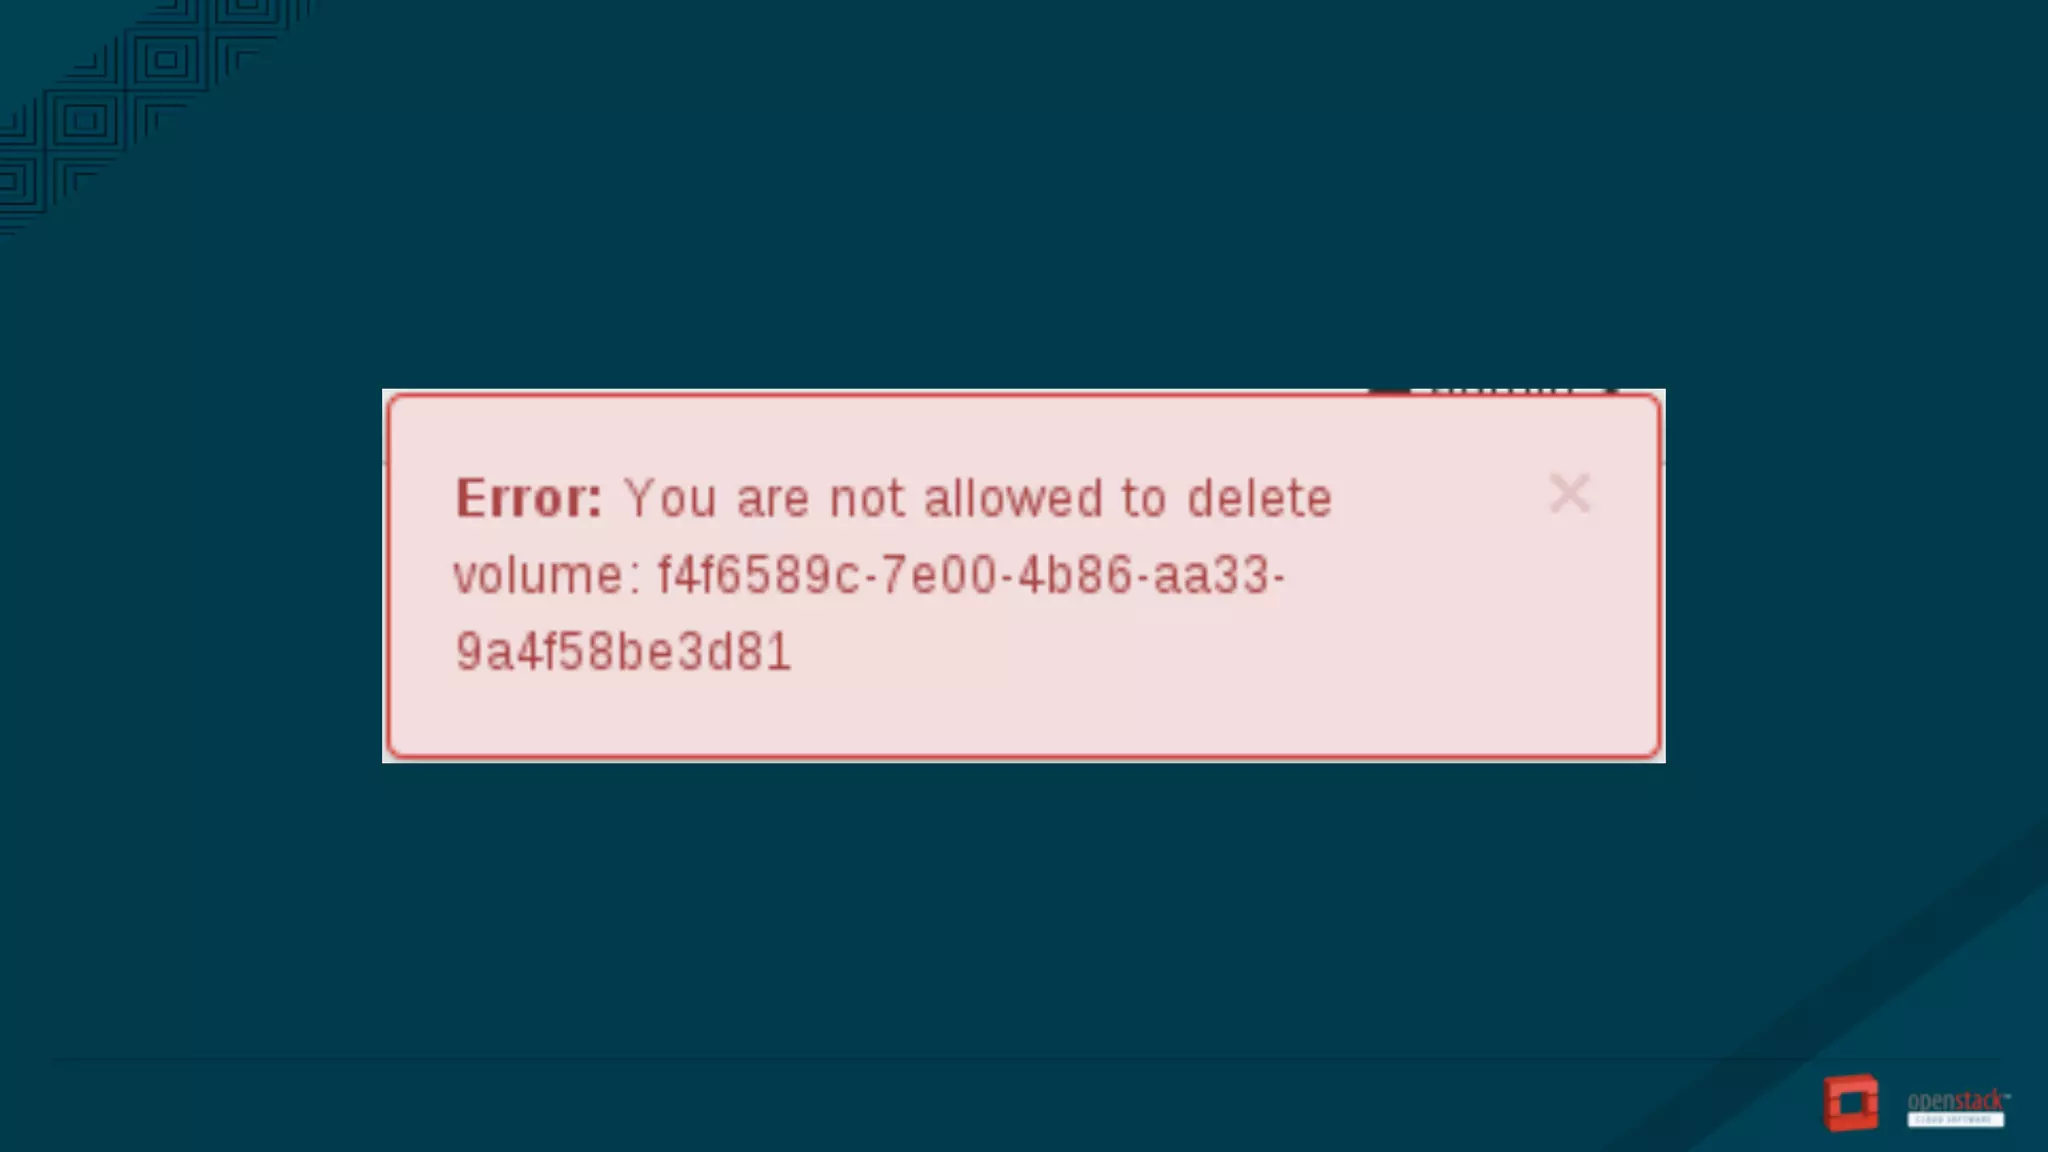
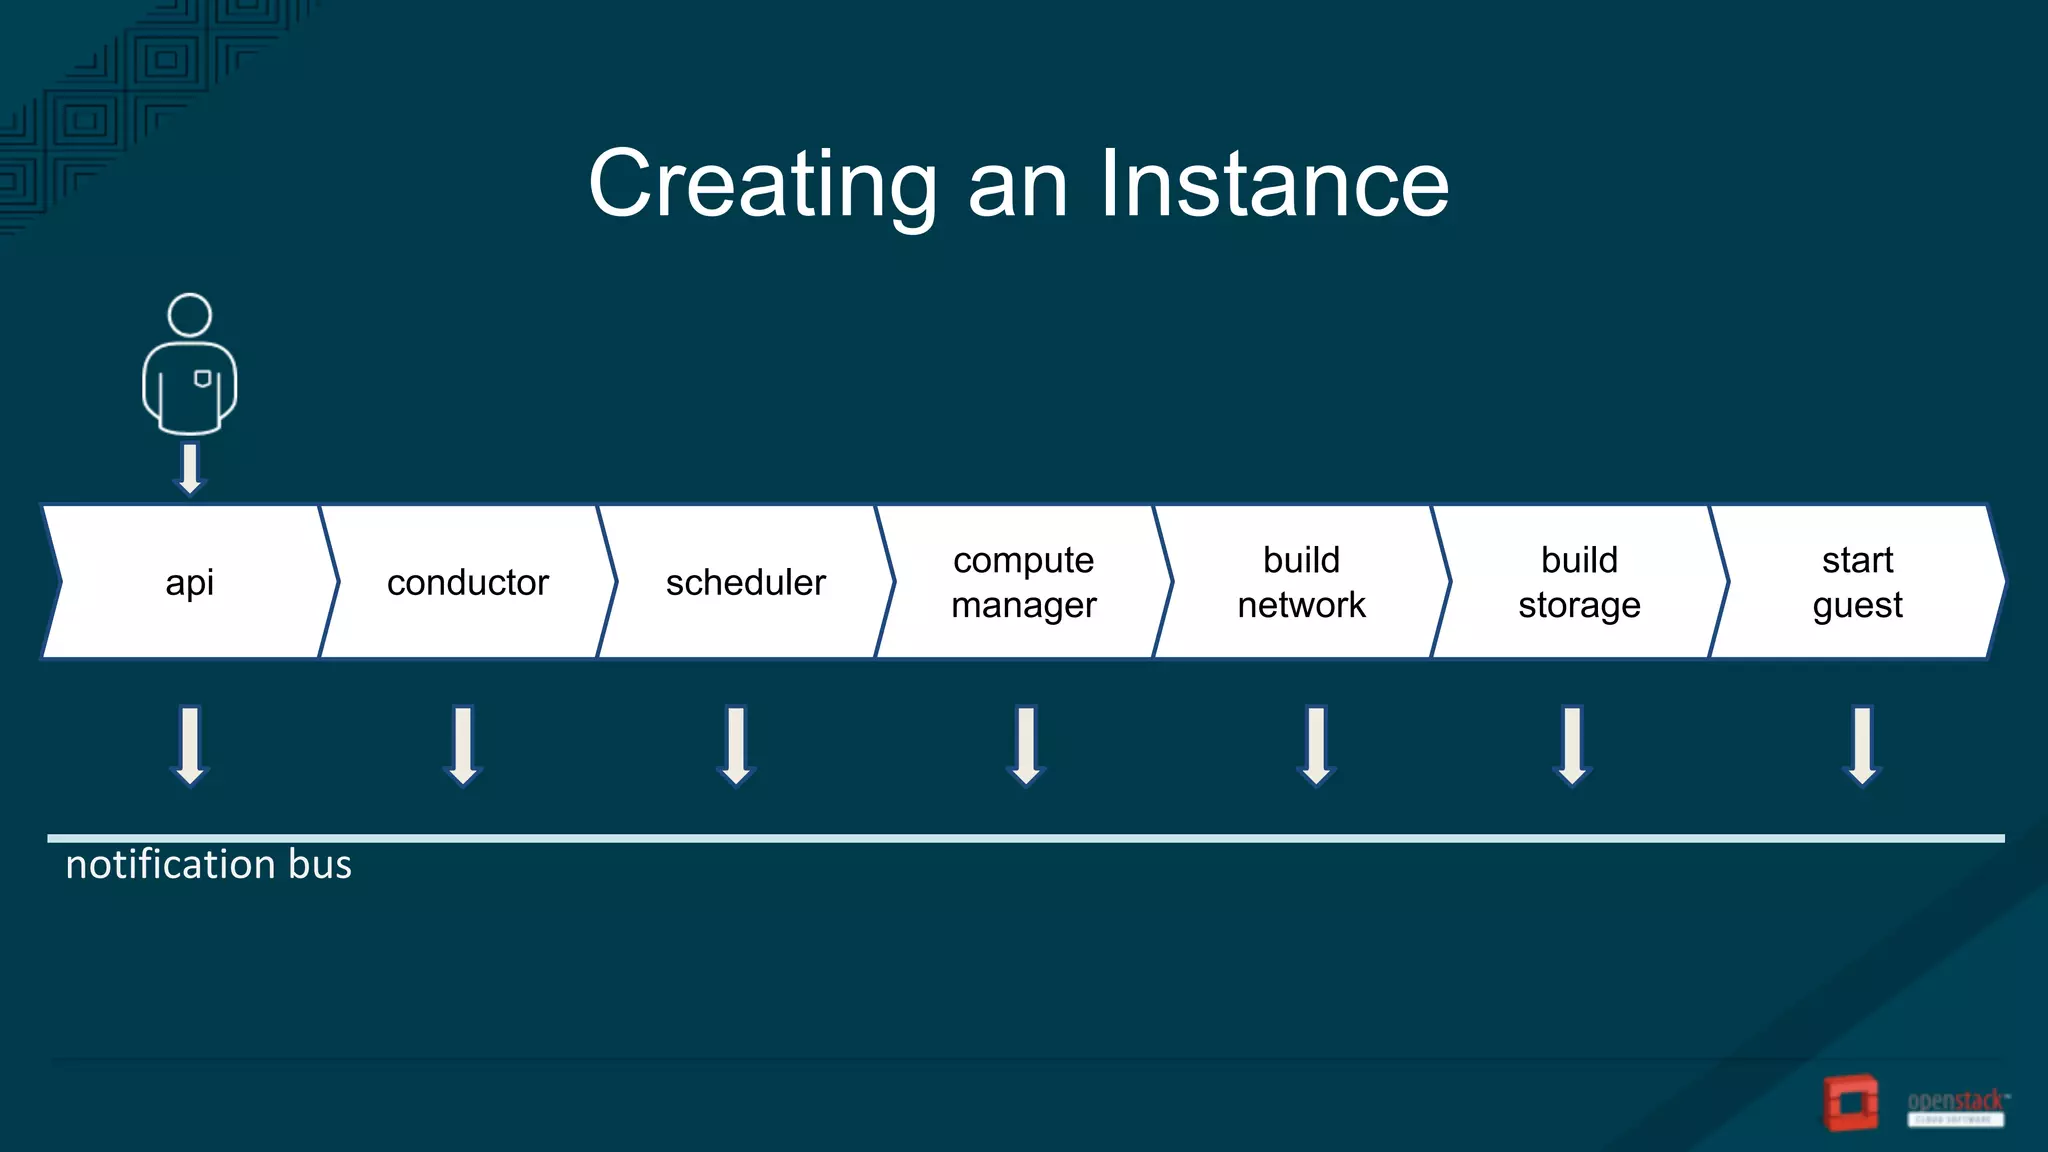
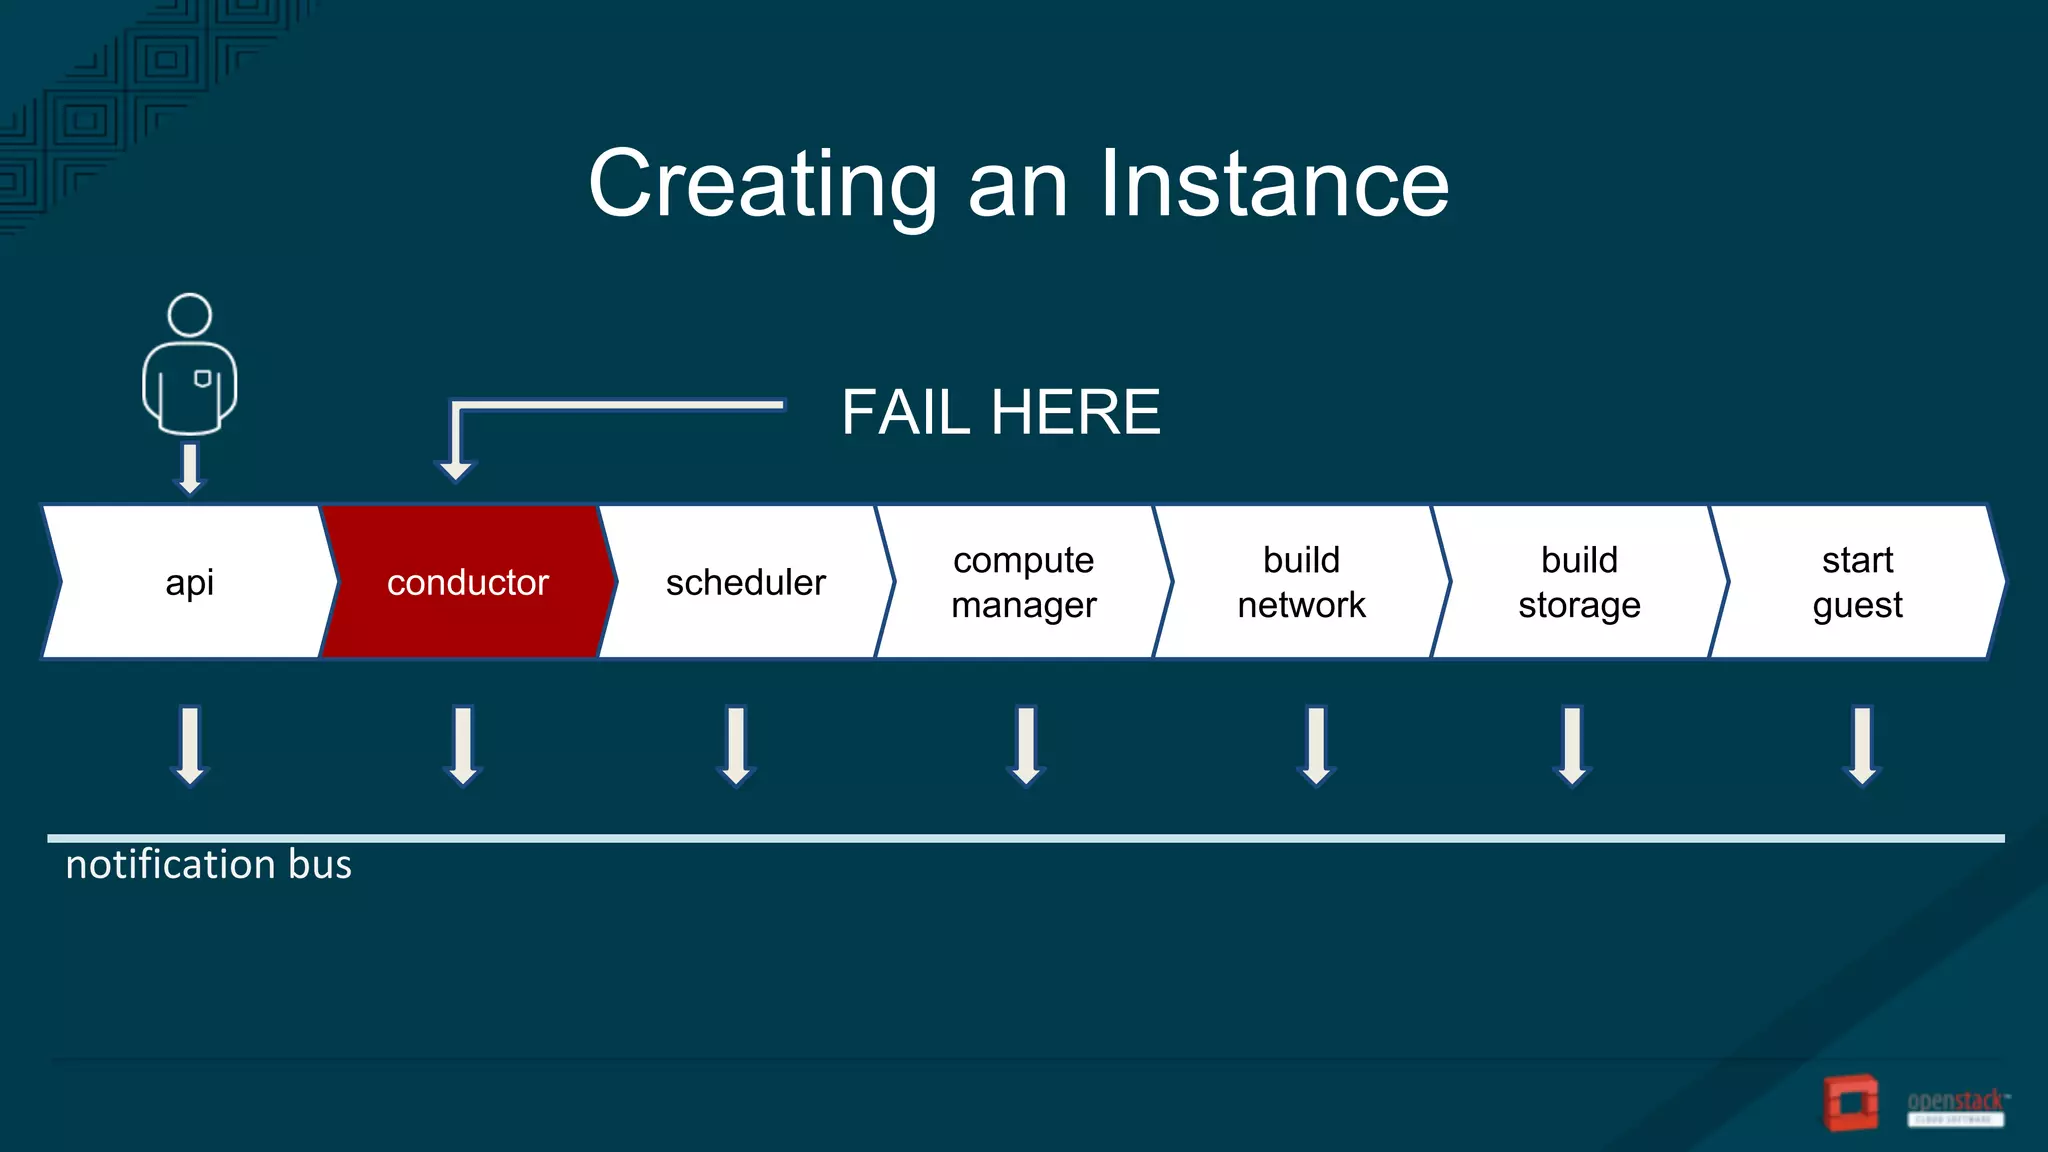
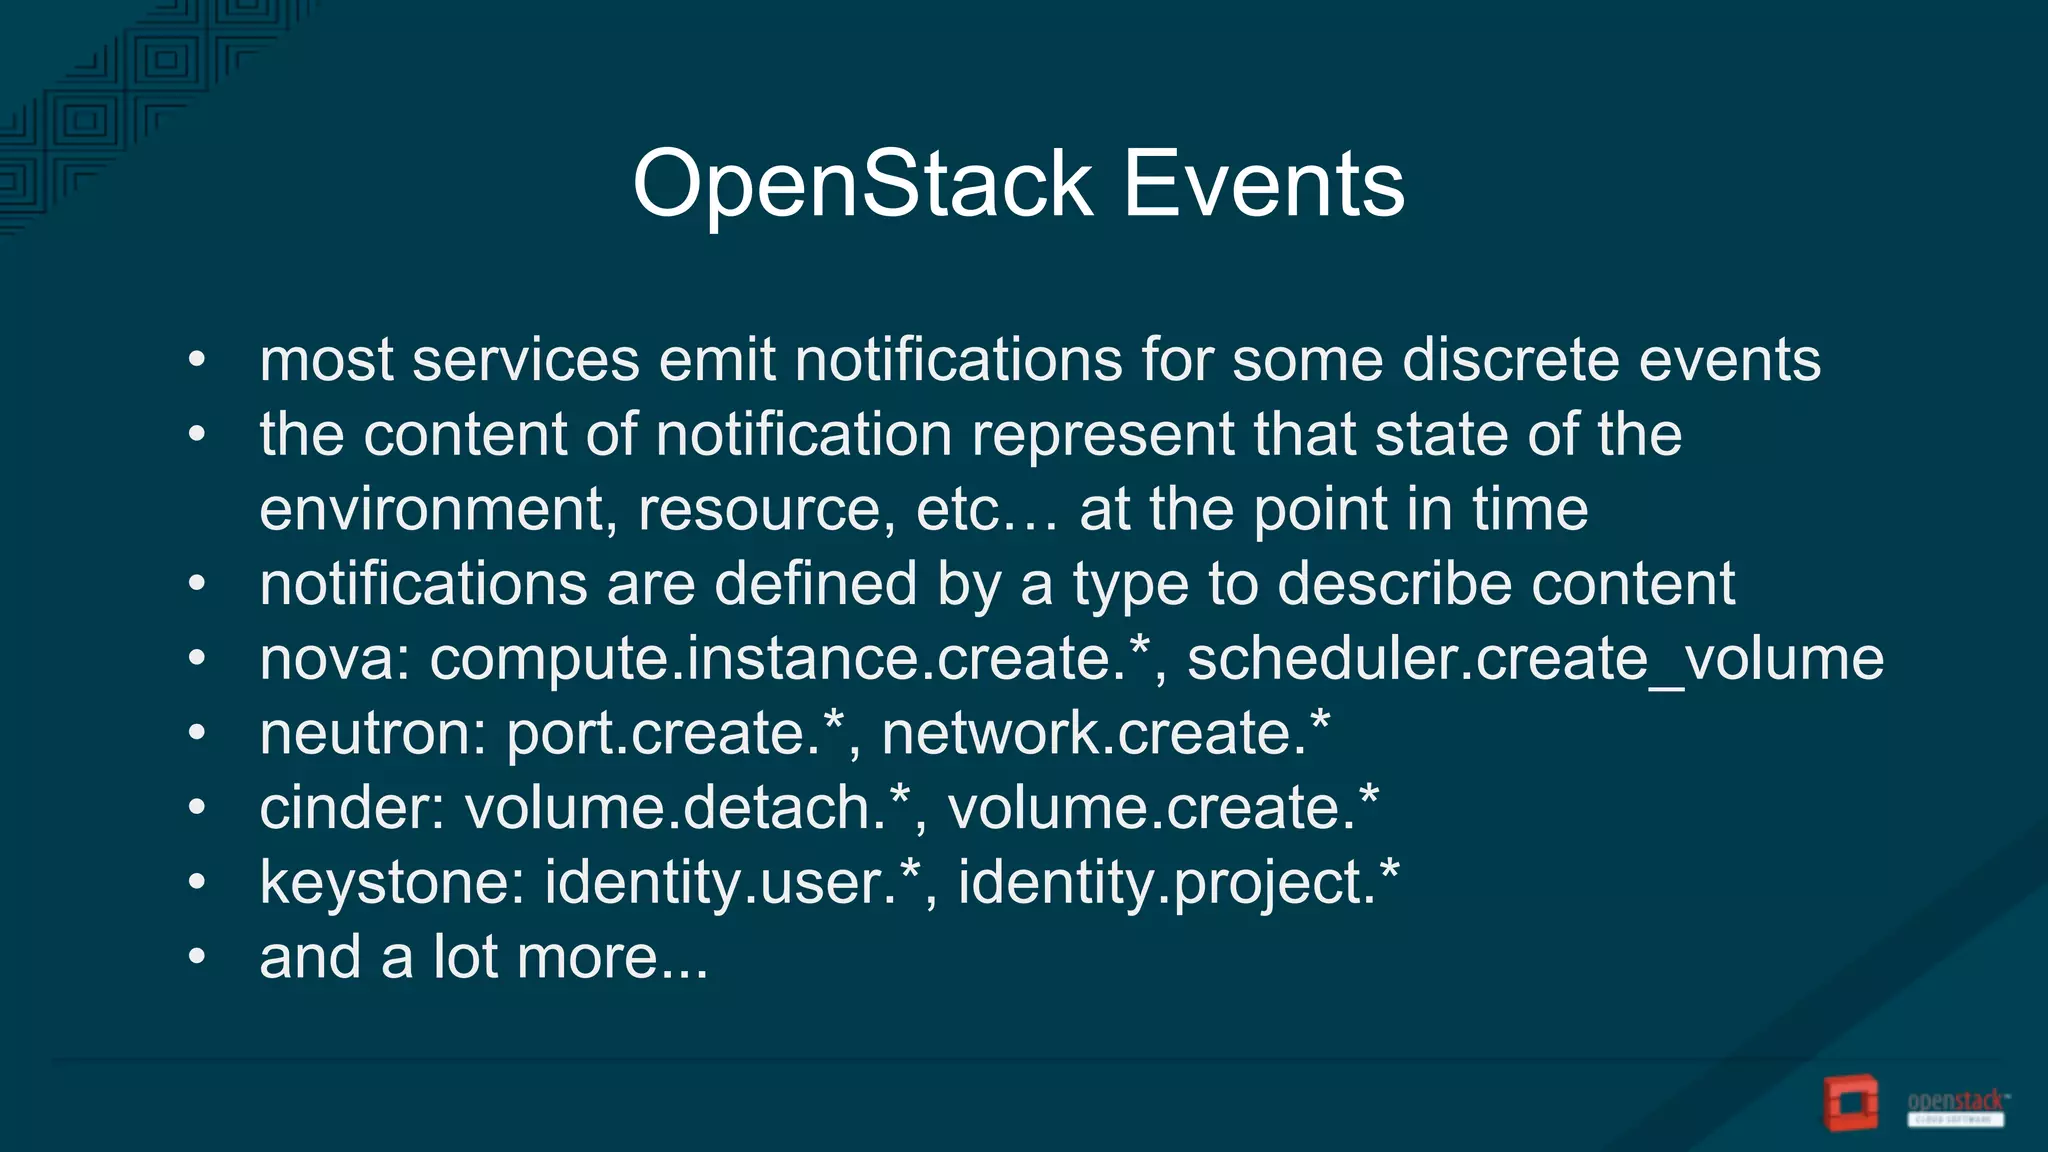
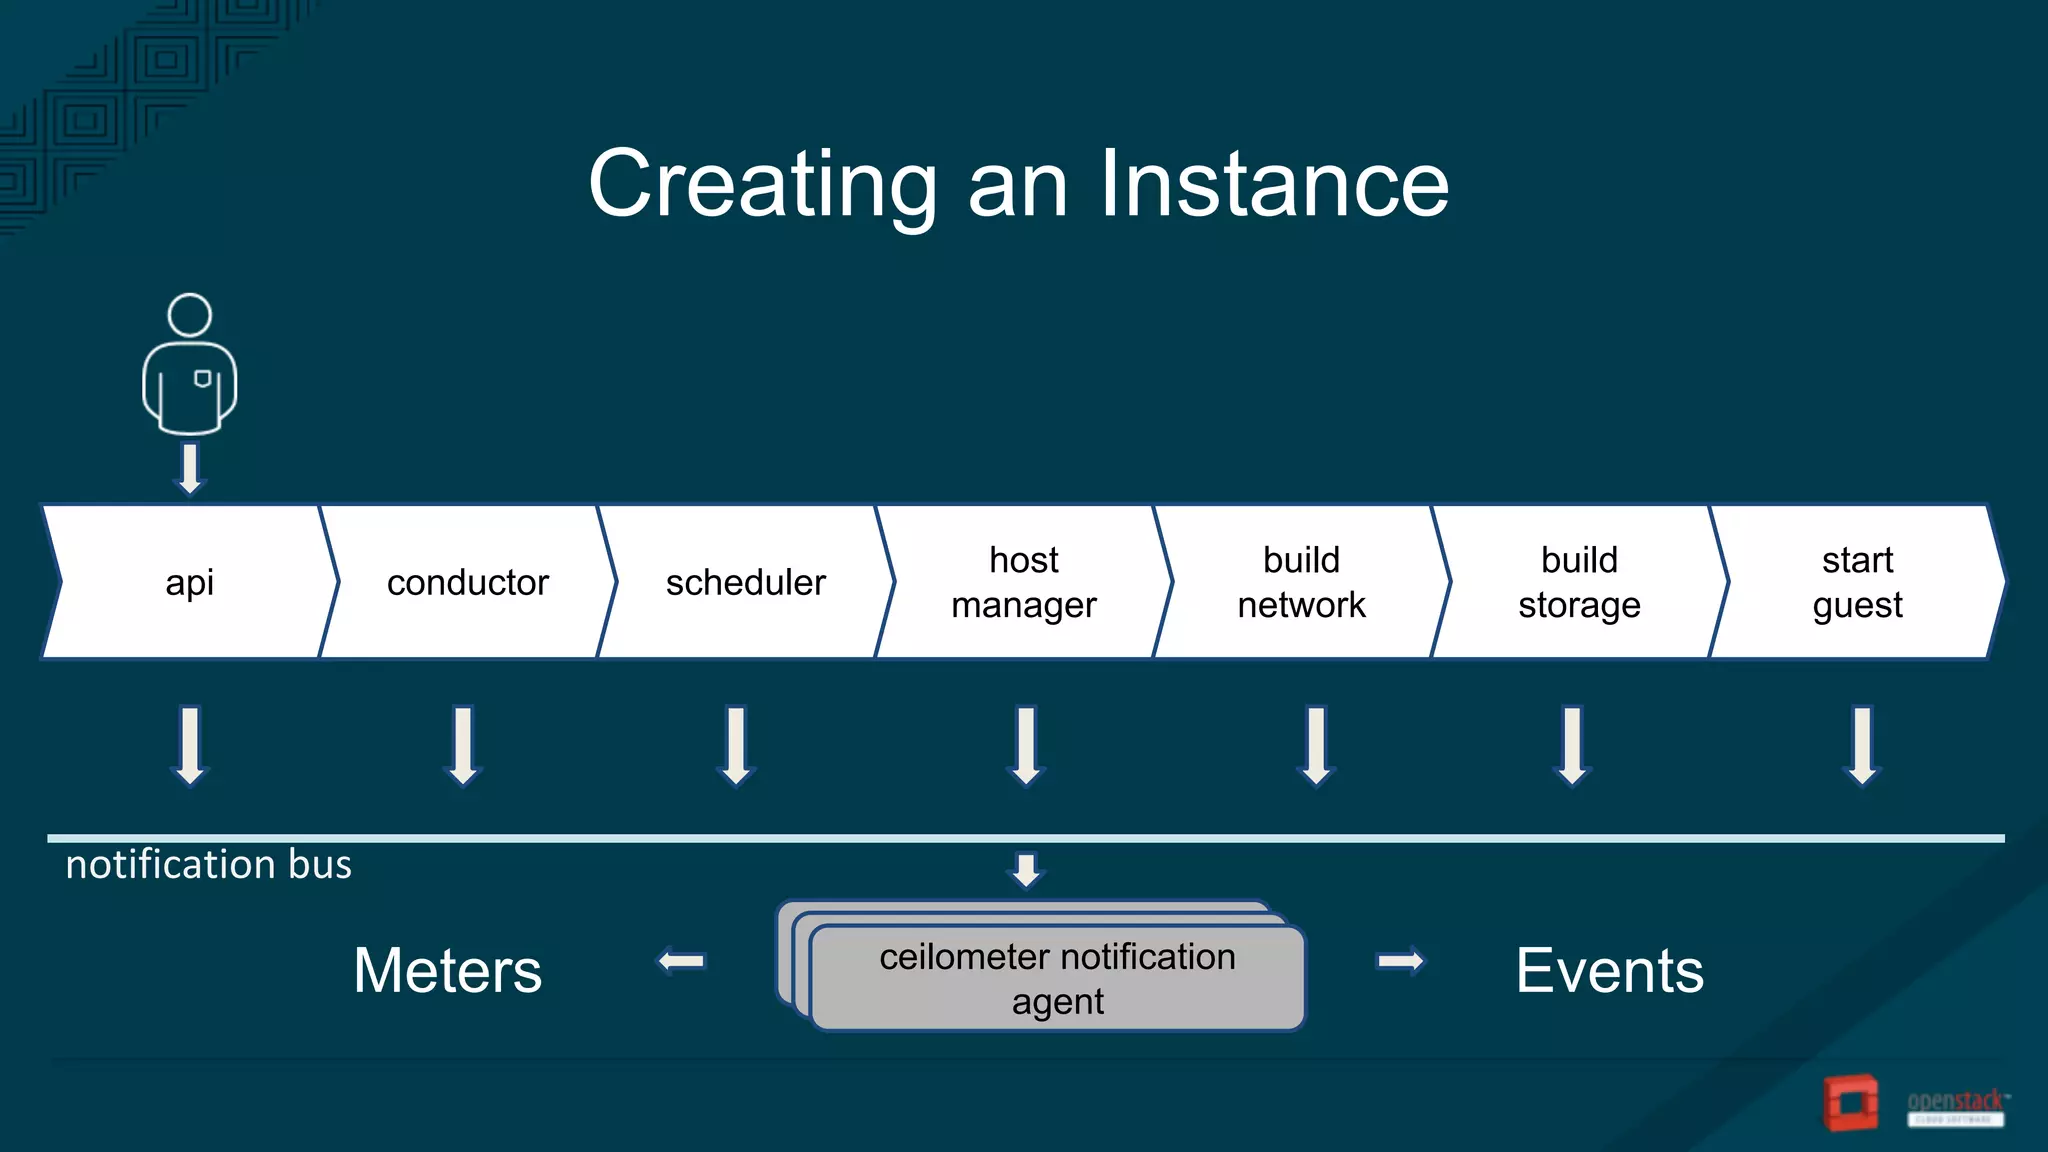
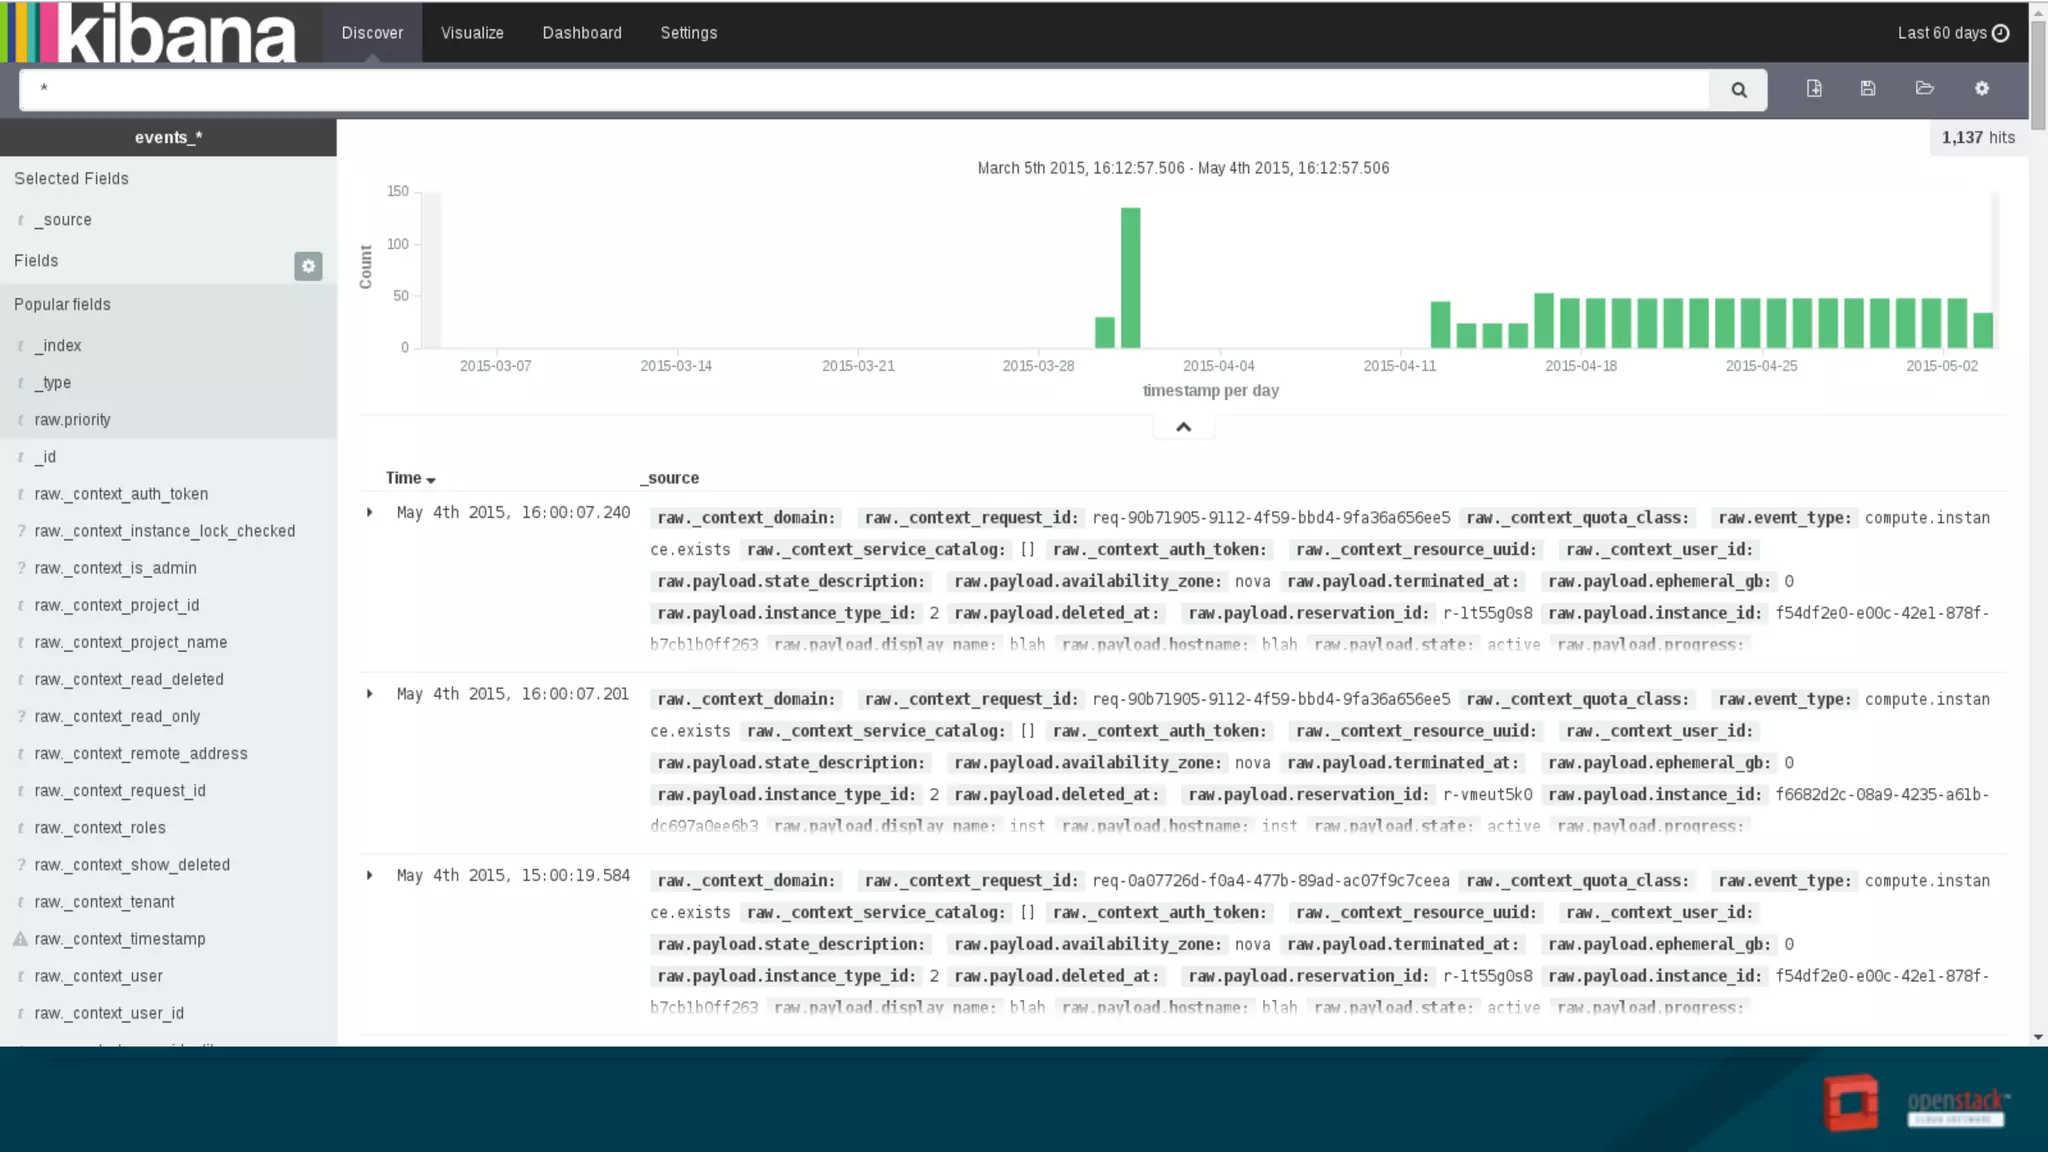
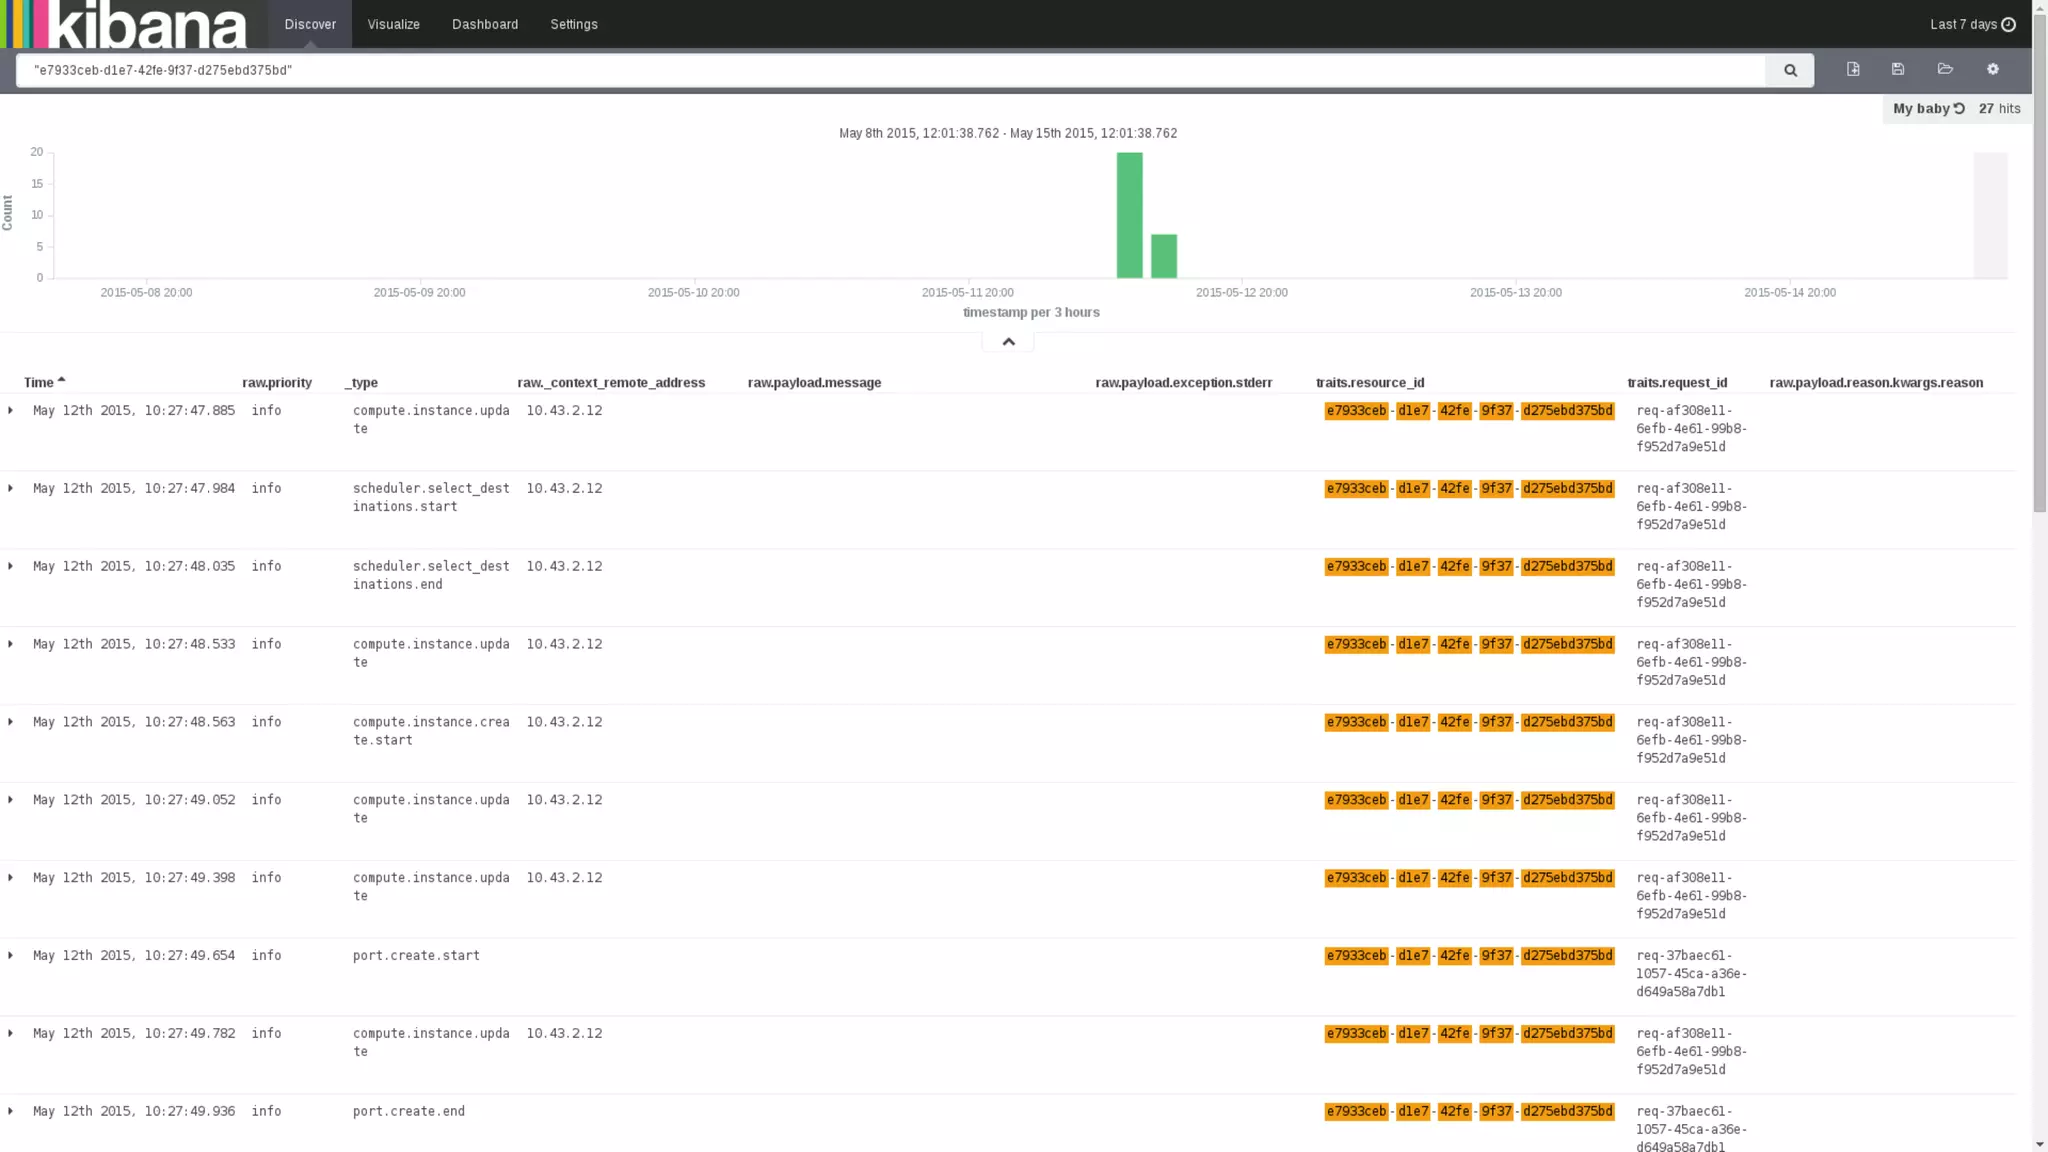
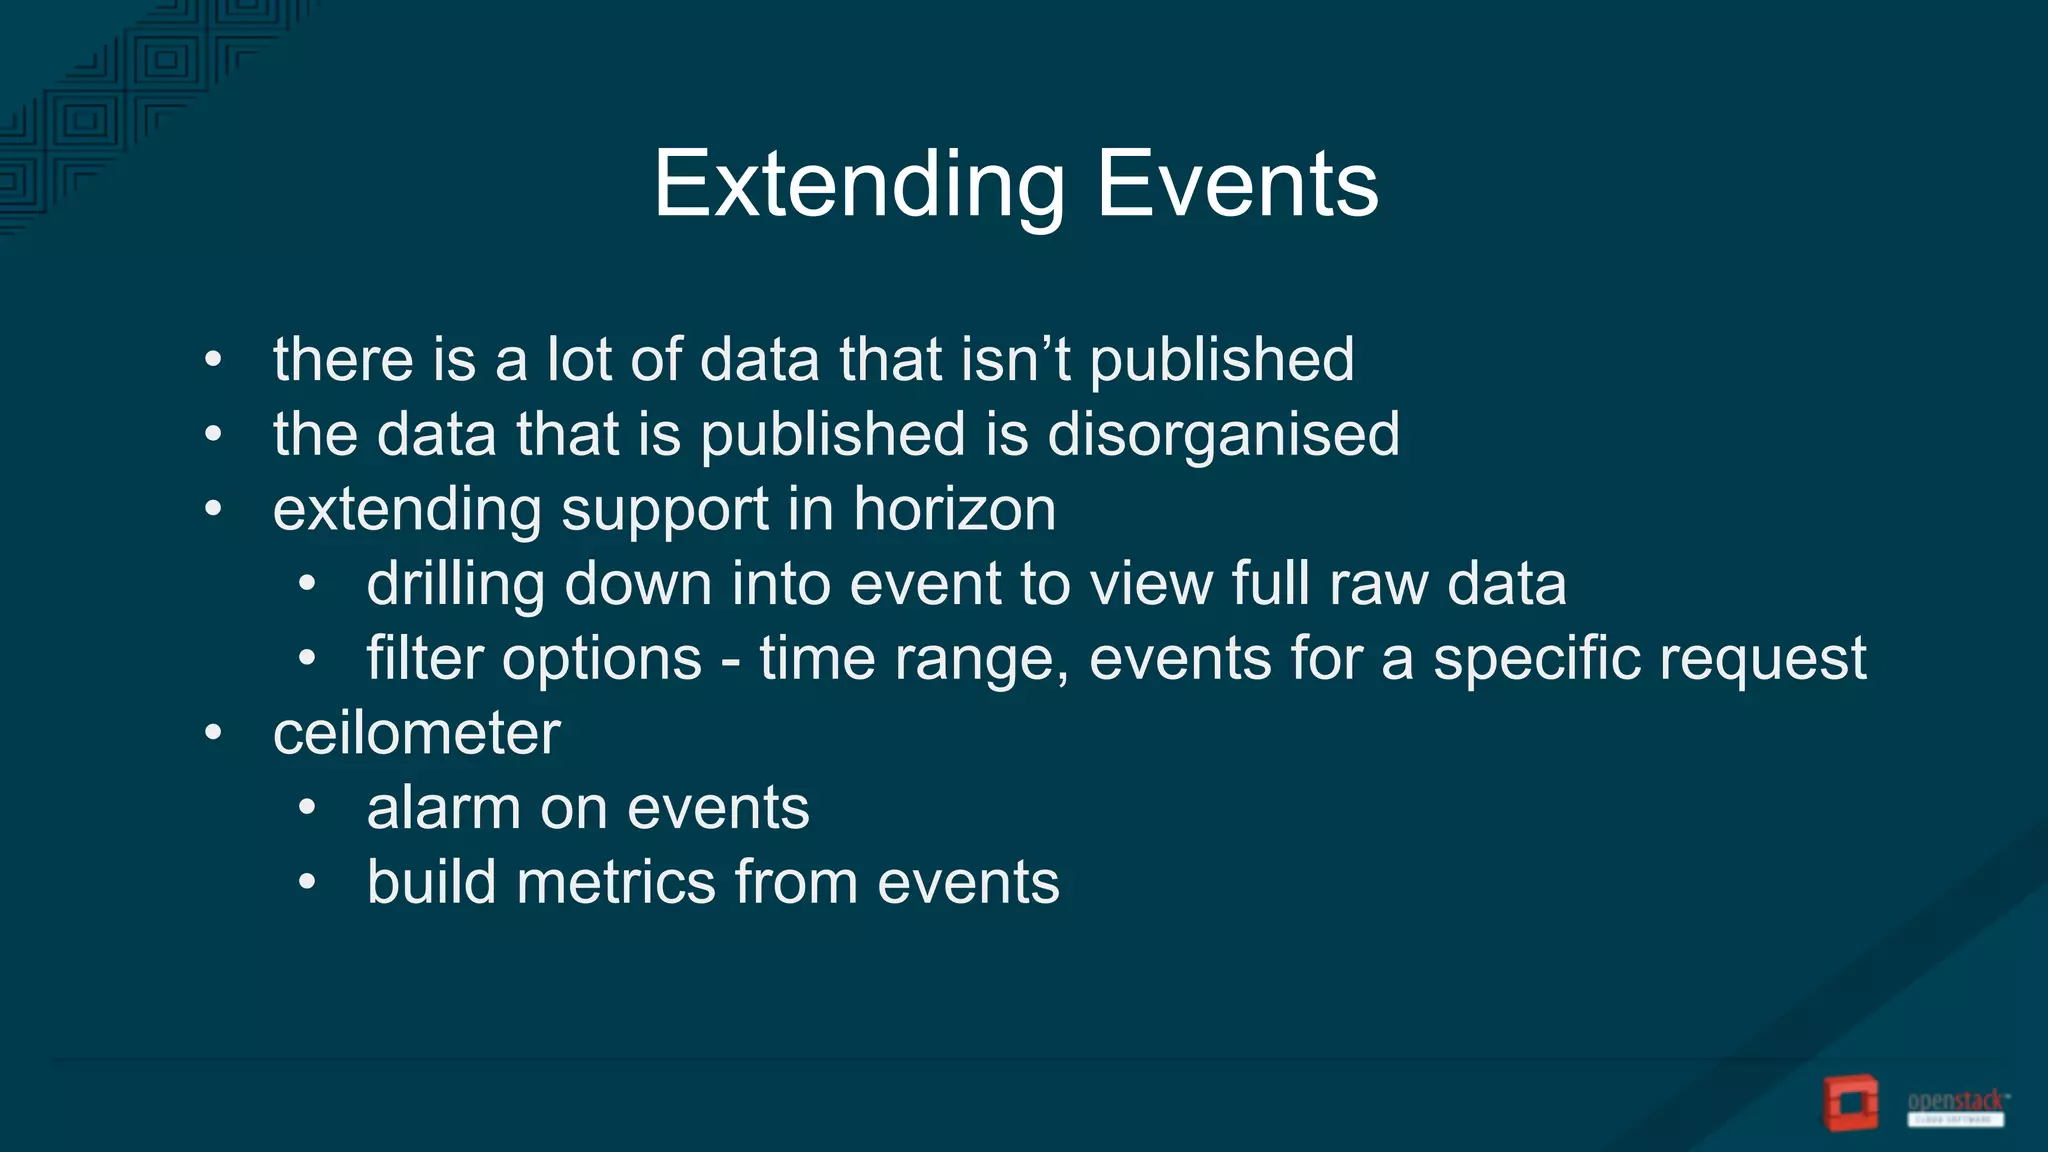
The document discusses the challenges and solutions related to event handling in OpenStack, particularly during instance creation. It highlights the complexities of the asynchronous, distributed nature of OpenStack services and introduces Ceilometer for monitoring notifications and events. Additionally, it mentions the use of Elasticsearch and Kibana for postmortem analysis and improving event organization and accessibility.
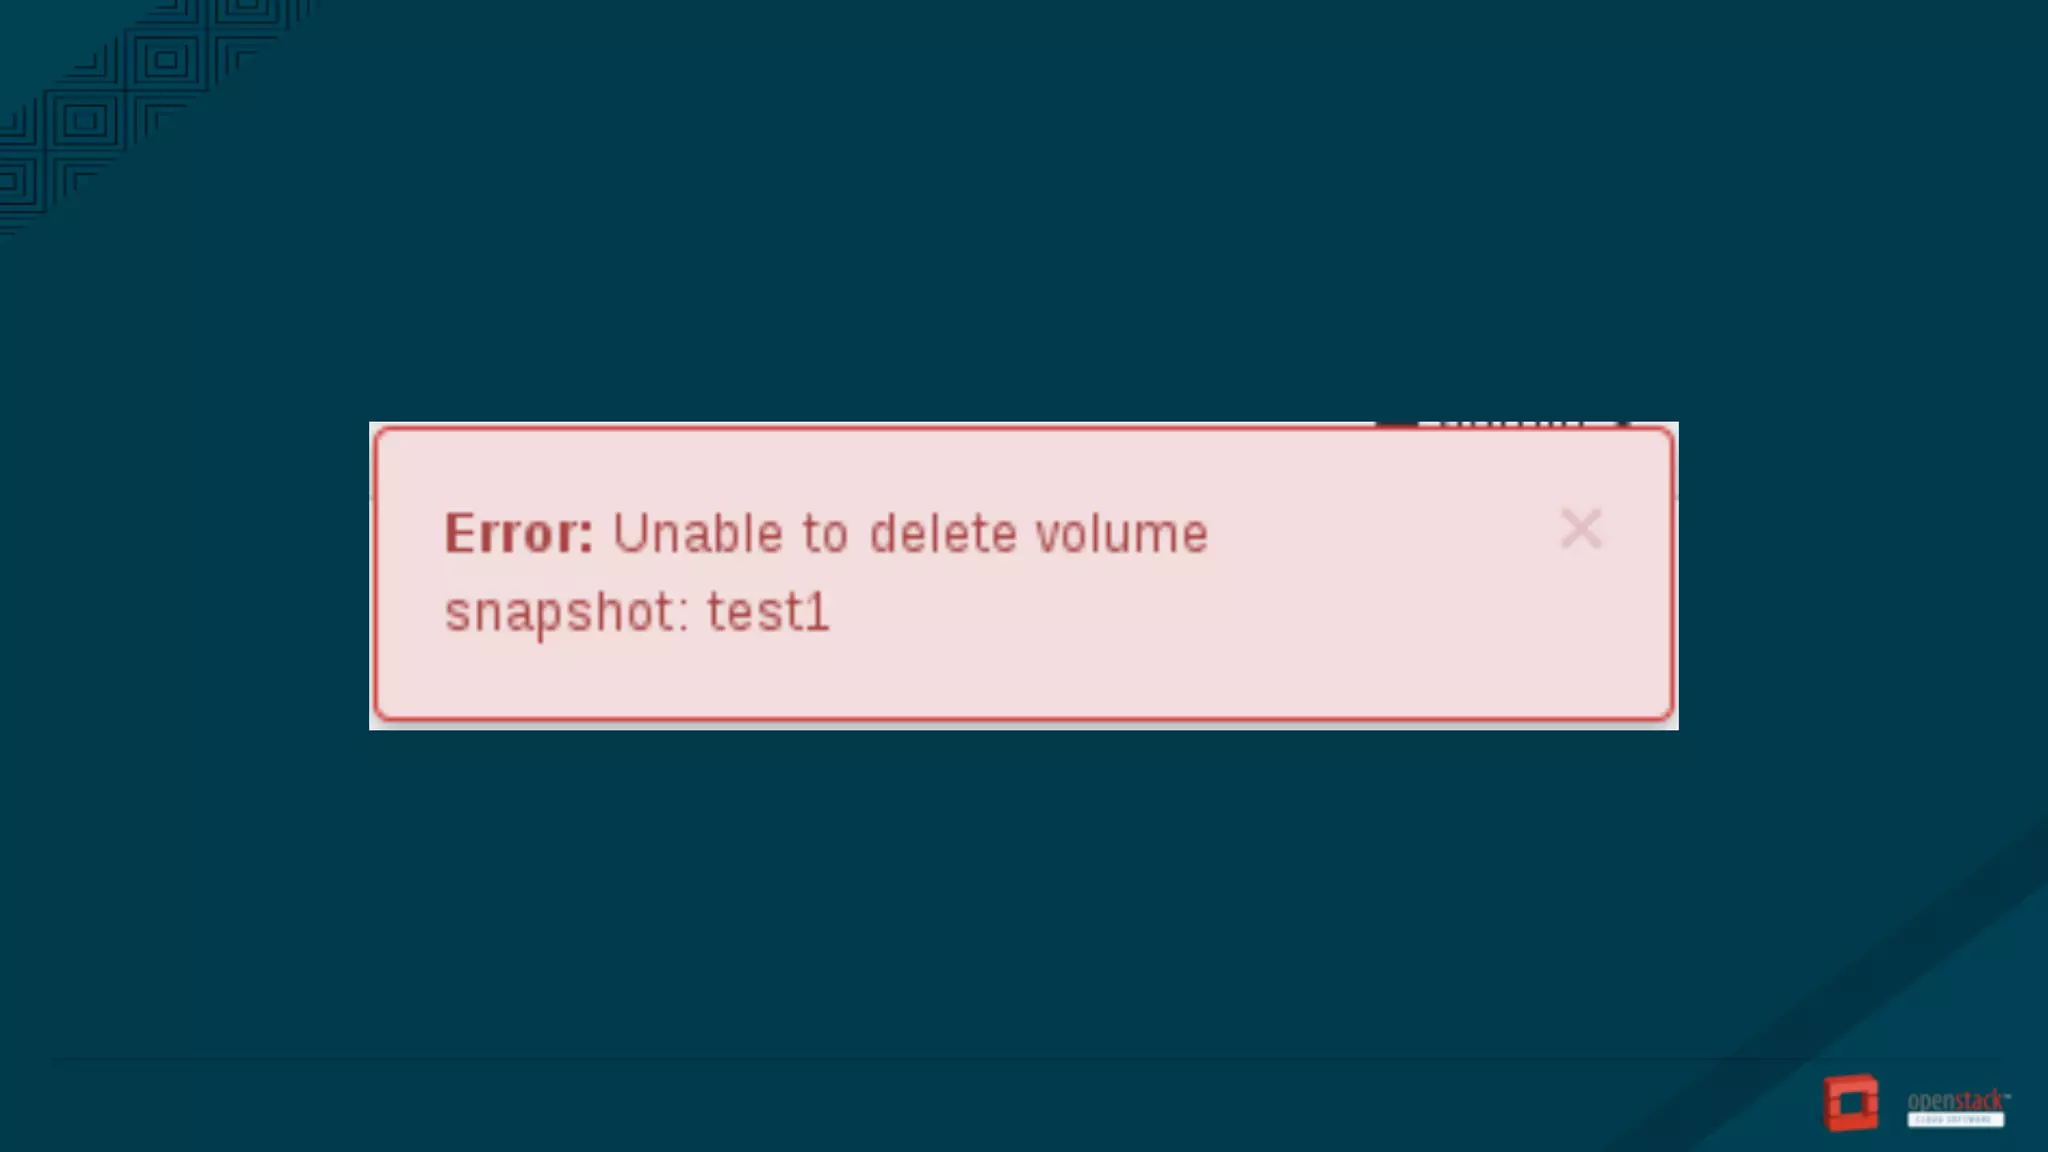

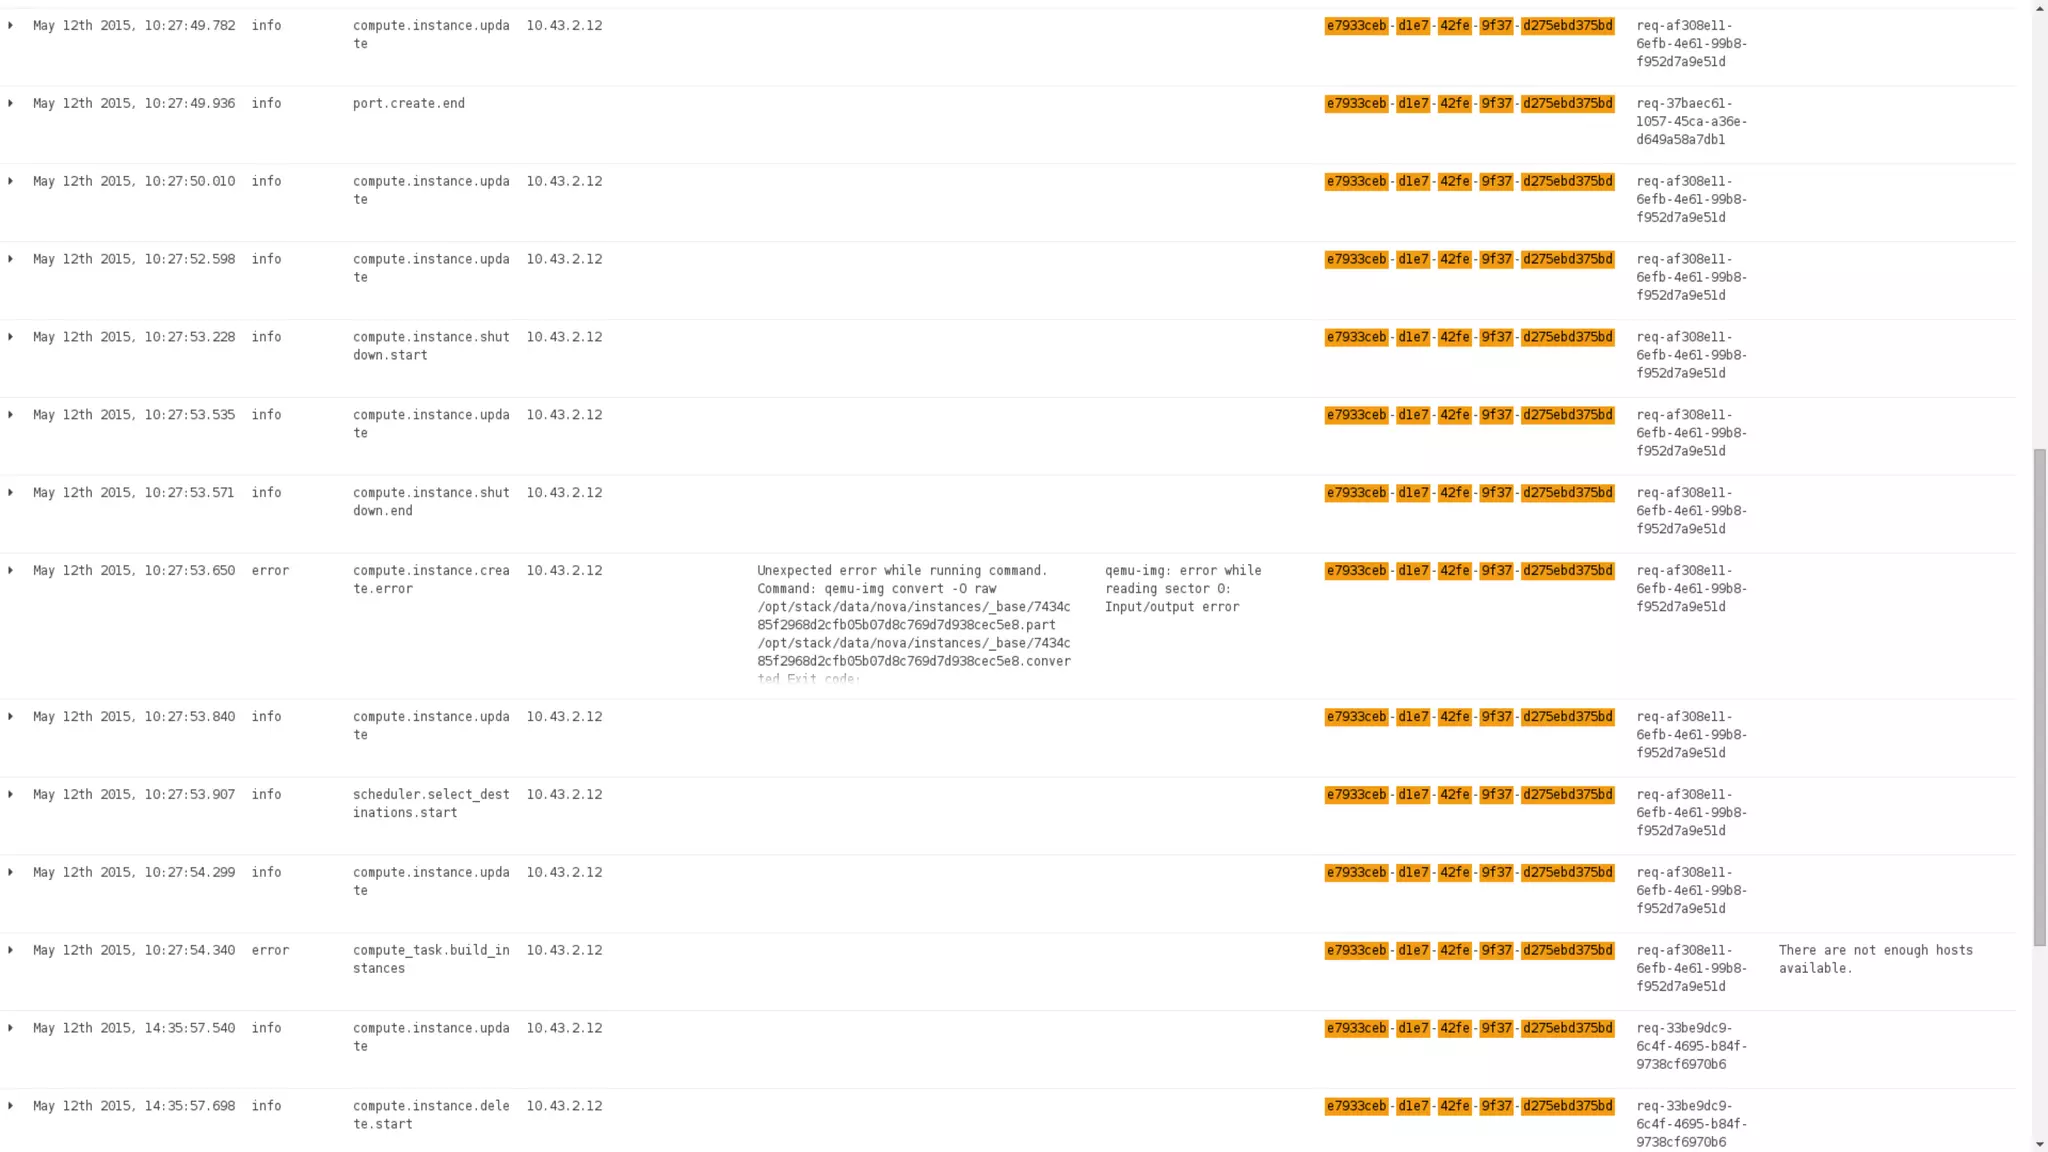
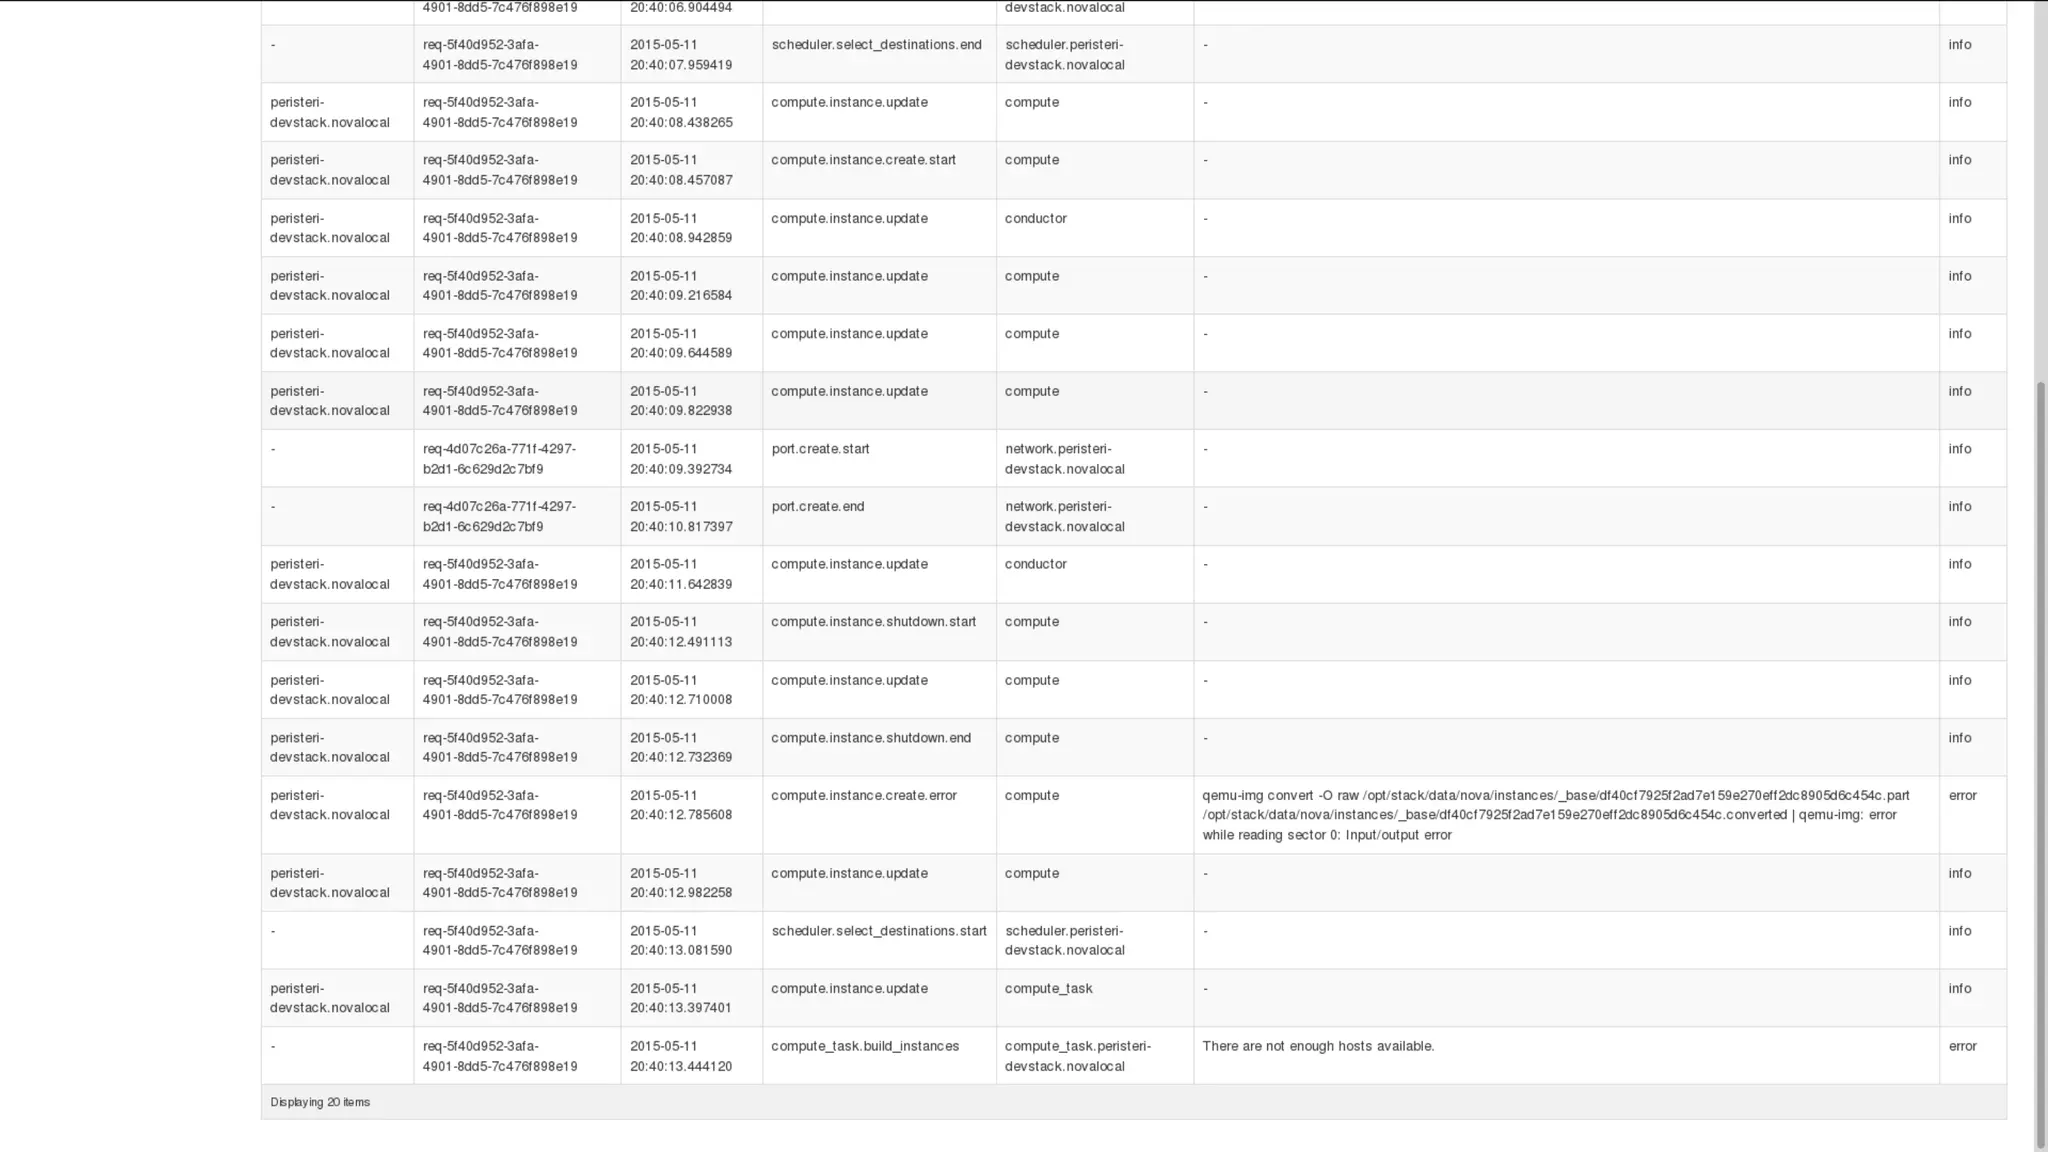
![if you’re lucky, you might find the real error!
[instance: e7933ceb-d1e7-42fe-9f37-d275ebd375bd] Instance failed to spawn
Traceback (most recent call last):
...
...
ProcessExecutionError: Unexpected error while running command.
Command: qemu-img convert -O raw
/opt/stack/data/nova/instances/_base/7434c85f2968d2cfb05b07d8c769d7d938cec5e
8.part
/opt/stack/data/nova/instances/_base/7434c85f2968d2cfb05b07d8c769d7d938cec5e
8.converted
Exit code: 1
Stdout: u''
Stderr: u'qemu-img: error while reading sector 0: Input/output errorn'](https://image.slidesharecdn.com/anatomyofanaction-150524192432-lva1-app6891/75/Anatomy-of-an-action-9-2048.jpg)


![[BDD 2025 - Full-Stack Development] The Modern Stack: Building Web & AI Appli...](https://cdn.slidesharecdn.com/ss_thumbnails/fs-themodernstackbuildingwebaiapplicationswithserverless-251124030844-388cf04f-thumbnail.jpg?width=640&height=640&fit=bounds)
![[BDD 2025 - Full-Stack Development] Agentic AI Architecture: Redefining Syste...](https://cdn.slidesharecdn.com/ss_thumbnails/fs-agenticaiarchitectureredefiningsystemcommunication-251124030838-e6c70cc2-thumbnail.jpg?width=640&height=640&fit=bounds)
![[DevFest Strasbourg 2025] - NodeJs Can do that !!](https://cdn.slidesharecdn.com/ss_thumbnails/devfeststrasbourg2025-nodejscandothat-251127142731-da65b6fd-thumbnail.jpg?width=640&height=640&fit=bounds)
![[BDD 2025 - Mobile Development] Mobile Engineer and Software Engineer: Are we...](https://cdn.slidesharecdn.com/ss_thumbnails/md-mobileengineerandsoftwareengineerarewestillrelevantsidiqpermana-251127010650-55224ef1-thumbnail.jpg?width=640&height=640&fit=bounds)


![Support, Monitoring, Continuous Improvement & Scaling Agentic Automation [3/3]](https://cdn.slidesharecdn.com/ss_thumbnails/agenticcommunityseries-day3-cfd-251120170304-ddef8112-thumbnail.jpg?width=640&height=640&fit=bounds)


![[BDD 2025 - Artificial Intelligence] AI for the Underdogs: Innovation for Sma...](https://cdn.slidesharecdn.com/ss_thumbnails/ai-aifortheunderdogsinnovationforsmallbusinesses-251124030839-72a599a4-thumbnail.jpg?width=640&height=640&fit=bounds)

