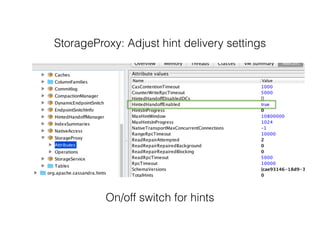
Nodetool is a command line interface for managing a Cassandra node. It provides commands for node administration, cluster inspection, table operations and more. The nodetool info command displays node-specific information such as status, load, memory usage and cache details. The nodetool compactionstats command shows compaction status including active tasks and progress. The nodetool tablestats command displays statistics for a specific table including read/write counts, space usage, cache usage and latency.
Light Weight Transactions Under Stress (Christopher Batey, The Last Pickle) ...DataStax
The Strong Consistency provided by QUORUM reads in Cassandra can still lead to read-write-modify problems when applications want to do things such as guarantee uniqueness or sell exactly 300 cinema tickets. Fortunately Light Weight Transactions (LWT) are designed to solve the problems Strong Consistency can not.
In this talk Christopher Batey, Consultant at The Last Pickle, will discuss:
- Syntax and semantics: Theoretical use cases
- How they work under the covers
Then we will go through LWTs in practice:
- How do the number of nodes/replicas/data centres affect performance?
- How does contention (multiple concurrent queries using LWTs) affect availability and performance?
- What consistency guarantees do you get with other LWTs and non-LWTs?
- How does LWT timeout differ from normal write timeout?
- Use case: LWTs as a distributed lock and how it went wrong 5 times.
About the Speaker
Christopher Batey Consultant / Software Engineer, The Last Pickle
Christopher (@chbatey) is a part time consultant at The Last Pickle where he works with clients to help them succeed with Apache Cassandra as well as a freelance software engineer working in London. Likes: Scala, Haskell, Java, the JVM, Akka, distributed databases, XP, TDD, Pairing. Hates: Untested software, code ownership. You can checkout his blog at: http://www.batey.info
Jvm tuning for low latency application & CassandraQuentin Ambard
G1, CMS, Shenandoah, or Zing? Heap size at 8GB or 31GB? compressed pointers? Region size? What is the maximum break time? Throughput or Latency... What gain? MaxGCPauseMillis, G1HeapRegionSize, MaxTenuringThreshold, UnlockExperimentalVMOptions, ParallelGCThreads, InitiatingHeapOccupancyPercent, G1RSetUpdatingPauseTimePercent, which parameters have the most impact?
Garbage First Garbage Collector (G1 GC) - Migration to, Expectations and Adva...Monica Beckwith
Learn what you need to know to experience nirvana in the evaluation of G1 GC even if your are migrating from Parallel GC to G1, or CMS GC to G1 GC
You also get a walk through of some case study data
G1 GC
Delivered as plenary at USENIX LISA 2013. video here: https://www.youtube.com/watch?v=nZfNehCzGdw and https://www.usenix.org/conference/lisa13/technical-sessions/plenary/gregg . "How did we ever analyze performance before Flame Graphs?" This new visualization invented by Brendan can help you quickly understand application and kernel performance, especially CPU usage, where stacks (call graphs) can be sampled and then visualized as an interactive flame graph. Flame Graphs are now used for a growing variety of targets: for applications and kernels on Linux, SmartOS, Mac OS X, and Windows; for languages including C, C++, node.js, ruby, and Lua; and in WebKit Web Inspector. This talk will explain them and provide use cases and new visualizations for other event types, including I/O, memory usage, and latency.
G1 Garbage Collector: Details and TuningSimone Bordet
The G1 Garbage Collector is the low-pause replacement for CMS, available since JDK 7u4. This session will explore in details how the G1 garbage collector works (from region layout, to remembered sets, to refinement threads, etc.), what are its current weaknesses, what command line options you should enable when you use it, and advanced tuning examples extracted from real world applications.
LinuxCon 2015 Linux Kernel Networking WalkthroughThomas Graf
This presentation features a walk through the Linux kernel networking stack for users and developers. It will cover insights into both, existing essential networking features and recent developments and will show how to use them properly. Our starting point is the network card driver as it feeds a packet into the stack. We will follow the packet as it traverses through various subsystems such as packet filtering, routing, protocol stacks, and the socket layer. We will pause here and there to look into concepts such as networking namespaces, segmentation offloading, TCP small queues, and low latency polling and will discuss how to configure them.
Common Java wisdom is to use PreparedStatements and Batch DML in order to achieve top performance.
It turns out one cannot just blindly follow the best practices. In order to get high throughput, you need
to understand the specifics of the database in question, and the content of the data.
In the talk we will see how proper usage of PostgreSQL protocol enables high performance operation while fetching
and storing the data. We will see how trivial application and/or JDBC driver code changes can result
in dramatic performance improvements. We will examine how server-side prepared statements should be activated,
and discuss pitfalls of using server-prepared statements.
Scylla allows us to create highly performant and scalable systems. However, to achieve good results and prevent our Scylla cluster from being overloaded, we need to properly write our client application and configure the driver. Join this session to learn some practical tips that can help you make your applications faster and more available.
OSNoise Tracer: Who Is Stealing My CPU Time?ScyllaDB
In the context of high-performance computing (HPC), the Operating System Noise (osnoise) refers to the interference experienced by an application due to activities inside the operating system. In the context of Linux, NMIs, IRQs, softirqs, and any other system thread can cause noise to the application. Moreover, hardware-related jobs can also cause noise, for example, via SMIs.
HPC users and developers that care about every microsecond stolen by the OS need not only a precise way to measure the osnoise but mainly to figure out who is stealing cpu time so that they can pursue the perfect tune of the system. These users and developers are the inspiration of Linux's osnoise tracer.
The osnoise tracer runs an in-kernel loop measuring how much time is available. It does it with preemption, softirq and IRQs enabled, thus allowing all the sources of osnoise during its execution. The osnoise tracer takes note of the entry and exit point of any source of interferences. When the noise happens without any interference from the operating system level, the tracer can safely point to a hardware-related noise. In this way, osnoise can account for any source of interference. The osnoise tracer also adds new kernel tracepoints that auxiliaries the user to point to the culprits of the noise in a precise and intuitive way.
At the end of a period, the osnoise tracer prints the sum of all noise, the max single noise, the percentage of CPU available for the thread, and the counters for the noise sources, serving as a benchmark tool.
Video: https://www.youtube.com/watch?v=FJW8nGV4jxY and https://www.youtube.com/watch?v=zrr2nUln9Kk . Tutorial slides for O'Reilly Velocity SC 2015, by Brendan Gregg.
There are many performance tools nowadays for Linux, but how do they all fit together, and when do we use them? This tutorial explains methodologies for using these tools, and provides a tour of four tool types: observability, benchmarking, tuning, and static tuning. Many tools will be discussed, including top, iostat, tcpdump, sar, perf_events, ftrace, SystemTap, sysdig, and others, as well observability frameworks in the Linux kernel: PMCs, tracepoints, kprobes, and uprobes.
This tutorial is updated and extended on an earlier talk that summarizes the Linux performance tool landscape. The value of this tutorial is not just learning that these tools exist and what they do, but hearing when and how they are used by a performance engineer to solve real world problems — important context that is typically not included in the standard documentation.
TPCx-HS is the first vendor-neutral benchmark focused on big data systems – which have become a critical part of the enterprise IT ecosystem.
Watch the video presentation: http://wp.me/p3RLHQ-cLY
Learn more: http://www.tpc.org/tpcx-hs
How Netflix Tunes EC2 Instances for PerformanceBrendan Gregg
CMP325 talk for AWS re:Invent 2017, by Brendan Gregg. "
At Netflix we make the best use of AWS EC2 instance types and features to create a high performance cloud, achieving near bare metal speed for our workloads. This session will summarize the configuration, tuning, and activities for delivering the fastest possible EC2 instances, and will help other EC2 users improve performance, reduce latency outliers, and make better use of EC2 features. We'll show how we choose EC2 instance types, how we choose between EC2 Xen modes: HVM, PV, and PVHVM, and the importance of EC2 features such SR-IOV for bare-metal performance. SR-IOV is used by EC2 enhanced networking, and recently for the new i3 instance type for enhanced disk performance as well. We'll also cover kernel tuning and observability tools, from basic to advanced. Advanced performance analysis includes the use of Java and Node.js flame graphs, and the new EC2 Performance Monitoring Counter (PMC) feature released this year."
HOT Understanding this important update optimizationGrant McAlister
In this session we dive deep into HOT (Heap Only Tuple) update optimization. Utilizing this optimization can result in improved writes rates, less index bloat and reduced vacuum effort but to enable PostgreSQL to use this optimization may require changing your application design and database settings. We will examine how the number of indexes, frequency of updates, fillfactor and vacuum settings can influence when HOT will be utilized and what benefits you may be able to gain.
Indexing Strategies for Oracle Databases - Beyond the Create Index StatementSean Scott
There's more to indexing than the basic "create index" statement! We'll go under the covers and look at the different types of indexes available in both Enterprise and Standard Editions, including b-tree, bitmap, reverse-key, functional, composite and partitioned; describe how to select the most appropriate type of index for a particular situation; explore storage parameters and lesser-known configuration options available to fine-tune performance; discuss methods for gathering statistics, including whether to capture histograms or not; and cover techniques for managing and maintaining a healthy library of indexes. Scripts included!
1. How to choose the appropriate type of index for a particular implementation.
2. An understanding of indexing options and storage configurations available to improve index (and database) performance.
3. Techniques for managing and maintaining the health of indexes.
Describes in detail the security architecture of Apache Cassandra. We discuss encryption at rest, encryption on the wire, authentication and authorization and securing JMX and management tools
Jolokia - JMX on Capsaicin (Devoxx 2011)roland.huss
"Jolokia - JMX on Capsaicin" was given as a "Tools in Action" talks at Devoxx 2011. For the full presentation, please go to parleys.com which includes a full recording of the talk.
The Last Pickle: Hardening Apache Cassandra for Compliance (or Paranoia).DataStax Academy
Security is always at odds with usability, particularly in the context of operations and development. More so when dealing with a distributed system such as Apache Cassandra. In this presentation, we'll walk through the steps required to completely secure a Cassandra cluster to meet most regulatory and compliance guidelines.
Topics will include:
- Encrypting cross-DC traffic
- Different types of at-rest disk encryption options available (and how to tune them)
- Configuring SSL for inter-cluster communication
- Configuring SSL between clients and the API
- Configuring and managing client authentication
Attendees will leave this presentation with the knowledge required to harden Cassandra to meet most guidelines imposed by regulations and compliance.
Some vignettes and advice based on prior experience with Cassandra clusters in live environments. Includes some material from other operational slides.
Teads is #1 in Video Ads. Read how Teads handles up to ~1 million requests/s with Apache Cassandra. How do we tuned Cassandra servers and clients. What issues we faced during the last year. How do we provision our clusters. Which tools are used: Datadog for monitoring and alerting, Cassandra reaper, Rundeck, Sumologic, cassandra_snapshotter. Why do we need a fork.
Hardening cassandra for compliance or paranoiazznate
How to secure a cassandra cluster. Includes details on configuring SSL, setting up a certificate authority and creating certificates and trust chains for the JVM.
Cassandra Troubleshooting (for 2.0 and earlier)J.B. Langston
I’ll give a general lay of the land for troubleshooting Cassandra. Then I’ll take you on a deep dive through nodetool and system.log and give you a guided tour of the useful information they provide for troubleshooting. I’ll devote special attention to monitoring the various processes that Cassandra uses to do its work and how to effectively search for information about specific error messages online.
This is the old version of this presentation for Cassandra 2.0 and earlier. Check out the updated slide deck for Cassandra 2.1.
CQL performance with Apache Cassandra 3.0 (Aaron Morton, The Last Pickle) | C...DataStax
The 3.0 storage engine re-write is the biggest and most exciting change to ever happen in Apache Cassandra. The new storage engine can efficiently store and read data from disk using the same concepts present in the CQL 3 language. This has delivered large space savings, and creates new performance characteristics.
In this talk Aaron Morton, Co Founder at The Last Pickle and Apache Cassandra Committer, will discuss the 3.0 storage engine, it's layout and performance characteristics.
About the Speaker
Aaron Morton CEO, The Last Pickle
Aaron Morton is the Co Founder & CEO at The Last Pickle (thelastpickle.com). A professional services company that works with clients to deliver and improve Apache Cassandra based solutions. He's based in New Zealand, is an Apache Cassandra Committer and a DataStax MVP for Apache Cassandra.
Open Source Monitoring for Java with JMX and Graphite (GeeCON 2013)Cyrille Le Clerc
Fast feedback from monitoring is a key of Continuous Delivery. JMX is the right Java API to do so but it unfortunately stayed underused and underappreciated as it was difficult to connect to monitoring and graphing systems.
Throw in the sin bin the poor solutions based on log files and weakly secured web interfaces! A new generation of Open Source tooling makes it easy to graph java application metrics and integrate them to traditional monitoring systems like Nagios.
Following the logic of DevOps, we will look together how best to integrate the monitoring dimension in a project: from design to development, to QA and finally to production on both traditional deployment and in the Cloud.
Come and discover how the JmxTrans-Graphite ticket can make your life easier.
Building Data Pipelines with SMACK: Designing Storage Strategies for Scale an...DataStax
Learn how to build an effective storage layer for a variety of workloads. With changing trends in system and storage hardware, understanding design trade-offs can be a challenge. This webinar will focus on cutting through the noise and diving into the choices that matter when designing for scale and performance.
Video: https://youtu.be/uEL8vyVSIis
Cassandra Summit 2014: Performance Tuning Cassandra in AWSDataStax Academy
Presenters: Michael Nelson, Development Manager at FamilySearch
A recent research project at FamilySearch.org pushed Cassandra to very high scale and performance limits in AWS using a real application. Come see how we achieved 250K reads/sec with latencies under 5 milliseconds on a 400-core cluster holding 6 TB of data while maintaining transactional consistency for users. We'll cover tuning of Cassandra's caches, other server-side settings, client driver, AWS cluster placement and instance types, and the tradeoffs between regular & SSD storage.
Wayne State University & DataStax: World's best data modeling tool for Apache...DataStax Academy
Data modeling is one of the most important steps ensuring performance and scalability of Cassandra-powered applications. The existing Chebotko data modeling methodology lays out important data modeling principles, rules and patterns to design a conceptual, logical and physical data models. While this approach enables rigorous and sound schema design, it requires specialized training and experience. To dramatically reduce time, simplify and streamline the Cassandra database design process, we develop an online tool that automates the most complex, error-prone, and time-consuming data modeling tasks: conceptual-to-logical mapping, logical-to-physical mapping, and CQL generation.
In this talk, using real life examples from the IoT domain, we demonstrate how to design correct and efficient database schemas for Cassandra. First, we use our tool, called KDM, to design a conceptual data model and specify application access patterns. Second, we demonstrate how KDM generates a logical data model that is visualized using Chebotko diagram notation. Third, we explain how to configure a logical data model and automatically generate a physical data model. Fourth, we showcase how KDM generates a CQL script for instantiating a physical data model in Cassandra. Finally, we discuss best practices for Cassandra data modeling with KDM.
The KDM tool is available for free at kdm.dataview.org and is used by many in industry and academia.
Andrey Kashlev - Wayne State University
Andrey Kashlev is a PhD candidate in big data, working in the Department of Computer Science at Wayne State University. His research focuses on big data, including data modeling for NoSQL, big data workflows, and provenance management. He has published numerous research articles in peer-reviewed international journals and conferences, including IEEE Transactions on Services Computing, Data and Knowledge Engineering, International Journal of Computers and Their Applications, and the IEEE International Congress on Big Data.
Whether running load tests or migrating historic data, loading data directly into Cassandra can be very useful to bypass the system’s write path.
In this webinar, we will look at how data is stored on disk in sstables, how to generate these structures directly, and how to load this data rapidly into your cluster using sstableloader. We'll also review different use cases for when you should and shouldn't use this method.
Casandra is a open-source, distributed, highly scalable and fault-tolerant database. It is a best choice for managing structured, semi-structured or unstructured data at a large amount.
DataStax: Extreme Cassandra Optimization: The SequelDataStax Academy
Al has been using Cassandra since version 0.6 and has spent the last few months doing little else but tune Cassandra clusters. In this talk, Al will show how to tune Cassandra for efficient operation using multiple views into system metrics, including OS stats, GC logs, JMX, and cassandra-stress.
Performance tuning - A key to successful cassandra migrationRamkumar Nottath
In last few years, technology has seen a major drift in the dominance of traditional / RDMBS databases across different domains. Expeditious adoption of NoSQL databases especially Cassandra in the industry opens up a lot more discussions on what are the major challenges that are faced during implementation of Cassandra and how to mitigate it. Many a times we conclude that migration or POC (proof of concept) is not successful; however the real flaw might be in the data modeling, identifying the right hardware configurations, database parameters, right consistency level and so on. There's no one good model or configuration which fits all use cases and all applications. Performance tuning an application is truly an art and requires perseverance. This paper delve into different performance tuning considerations and anti-patterns that need to be considered during Cassandra migration / implementation to make sure we are able to reap the benefits of Cassandra, what makes it a ‘Visionary’ in 2014 Gartner’s Magic Quadrant for Operational Database Management Systems.
How Cassandra Deletes Data (Alain Rodriguez, The Last Pickle) | Cassandra Sum...DataStax
How does Cassandra delete data when the files on disk are immutable? How does it make sure deletes are distributed around the cluster? The answer is Tombstones, a ""soft delete"" marker that solves these problems and creates others by inserting more data when you ask for data to be deleted. Which can result in serious problems for some data models, and headaches for developers and operations teams. With the correct settings and workload however it can mean that Cassandra efficiently removes old data from disk.
In this talk Alain Rodriguez, Consultant at The Last Pickle, will explain why Cassandra uses tombstones, how they work, and when they are purged from disk. He will also discuss the best data models and configurations settings to ensure efficient purging, and what to do when it goes wrong.
About the Speaker
Alain Rodriguez Consultant, The Last Pickle
Alain has been working with Apache Cassandra since version 0.8. He was the first Engineer at teads.tv which had grown to 400+ employees by the time he left. During his time at Teads Alain managed and scaled Cassandra clusters across multiple AWS Regions, fully on his own, taking care of the data modeling as well as the troubleshooting and tuning. Alain frequently contributes to the Apache Cassandra users mailing list.
Chris Larsen (Yahoo!)
This year we'll talk about the joys of the HBase Fuzzy Row Filter, new TSDB filters, expression support, Graphite functions and running OpenTSDB on top of Google’s hosted Bigtable. AsyncHBase now includes per-RPC timeouts, append support, Kerberos auth, and a beta implementation in Go.
Amazon EC2 provides a broad selection of instance types to accommodate a diverse mix of workloads. In this session, we provide an overview of the Amazon EC2 instance platform, key platform features, and the concept of instance generations. We dive into the current generation design choices of the different instance families, including the General Purpose, Compute Optimized, Storage Optimized, Memory Optimized, and GPU instance families. We also detail best practices and share performance tips for getting the most out of your Amazon EC2 instances.
Talking about Neo4j after 1 year of using it production. This presentation covering db structure(internals), cypher queries, extensions development, db tuning & settings.
(DAT402) Amazon RDS PostgreSQL:Lessons Learned & New FeaturesAmazon Web Services
Learn the specifics of Amazon RDS for PostgreSQL’s capabilities and extensions that make it powerful. This session begins with a brief overview of the RDS PostgreSQL service, how it provides High Availability & Durability and will then deep dive into the new features that we have released since re:Invent 2014, including major version upgrade and newly added PostgreSQL extensions to RDS PostgreSQL. During the session, we will also discuss lessons learned running a large fleet of PostgreSQL instances, including specific recommendations. In addition we will present benchmarking results looking at differences between the 9.3, 9.4 and 9.5 releases.
The slides from Software Diagnostics Services seminar (30th of December 2013) about physical memory analysis on desktop and server Windows platforms (a revised version of the previous seminars on complete crash and hang memory dump analysis). Topics include: memory acquisition and its tricks; user vs. kernel vs. physical memory space; fibre bundle space; challenges of physical memory analysis; common WinDbg commands; memory analysis patterns and their classification; common mistakes; a hands-on WinDbg analysis example with logs; a guide to further study.
Tier1app CEO & Founder, Ram Lakshmanan, spoke at All Day Devops 2017 about Java GC Logs. In this presentation, you can learn how to enable Java GC logs, commonly used GC log formats, tricks, patterns and tools to analyze them effectively.
Seattle C* Meetup: Hardening cassandra for compliance or paranoiazznate
Details how to secure Apache Cassandra clusters. Covers client to server and server to server encryption, securing management and tooling, using authentication and authorization, as well as options for encryption at rest.
Start to finish overview of tools, tips and techniques for developing software for Apache Cassandra. Includes code and configuration examples, build systems and container support.
Successful Software Development with Apache Cassandrazznate
Adding a new technology to your development process can be challenging, and the distributed nature of Apache Cassandra can make it daunting. However, recent improvements in drivers, utilities and tooling have simplified the process making it easier than ever before to develop software with Apache Cassandra.
In this presentation, we cover essential knowledge for all developers wanting to efficiently create reliable Apache Cassandra based solutions. Topics include:
- Language and Driver selection
- Optimizing Driver configuration
- Productive Developer environments using ccm, Vagrant and DataStax DevCenter
- Creating appropriate test data
- Unit testing
- Automated integration testing
- Test optimization with profiles
New and existing users will come away from this presentation with the necessary knowledge to make their next Apache Cassandra project a success.
Vert.x is a new JVM based application framework with an event driven, asynchronous programming model. With APIs available in Java, JavaScript, Ruby, Python and Groovy, developers are given complete freedom to implement their application in the language of their choice.
Starting with the core Vert.x concepts, this presentation will walk attendees through the components of a simple vert.x based application. Through this process, attendees will gain an understanding of how Vert.x:
- provides for a way to use several different languages in the same application
- takes advantage of JVMs excellent multi-core capabilities
- uses a module-based framework for packaging and hot-deployment
- communicates with other processes via a distributed event bus
- exposes an asynchronous programming model with very simple concurrency
With this presentation, viewers should gain a deep-enough understanding of Vert.x to be able to evaluate the platform for their own projects.
Introduciton to Apache Cassandra for Java Developers (JavaOne)zznate
The database industry has been abuzz over the past year about NoSQL databases. Apache Cassandra, which has quickly emerged as a best-of-breed solution in this space, is used at many companies to achieve unprecedented scale while maintaining streamlined operations.
This presentation goes beyond the hype, buzzwords, and rehashed slides and actually presents the attendees with a hands-on, step-by-step tutorial on how to write a Java application on top of Apache Cassandra. It focuses on concepts such as idempotence, tunable consistency, and shared-nothing clusters to help attendees get started with Apache Cassandra quickly while avoiding common pitfalls.
Introduction to apache_cassandra_for_developezznate
A presentation for Data Day Austin on January 29th, 2011
Introduces how to effectively use Apache Cassandra for Java developers using the Hector Java client: http://github.com/rantav/hector
Hector v2: The Second Version of the Popular High-Level Java Client for Apach...zznate
This presentation will provide a preview of our new high-level API designed around community feedback and built on the solid foundation of Hector client internals currently in use by a number of production systems. A brief introduction to the existing Hector client will be included to accomadate new users.
GDG Cloud Southlake #33: Boule & Rebala: Effective AppSec in SDLC using Deplo...James Anderson
Effective Application Security in Software Delivery lifecycle using Deployment Firewall and DBOM
The modern software delivery process (or the CI/CD process) includes many tools, distributed teams, open-source code, and cloud platforms. Constant focus on speed to release software to market, along with the traditional slow and manual security checks has caused gaps in continuous security as an important piece in the software supply chain. Today organizations feel more susceptible to external and internal cyber threats due to the vast attack surface in their applications supply chain and the lack of end-to-end governance and risk management.
The software team must secure its software delivery process to avoid vulnerability and security breaches. This needs to be achieved with existing tool chains and without extensive rework of the delivery processes. This talk will present strategies and techniques for providing visibility into the true risk of the existing vulnerabilities, preventing the introduction of security issues in the software, resolving vulnerabilities in production environments quickly, and capturing the deployment bill of materials (DBOM).
Speakers:
Bob Boule
Robert Boule is a technology enthusiast with PASSION for technology and making things work along with a knack for helping others understand how things work. He comes with around 20 years of solution engineering experience in application security, software continuous delivery, and SaaS platforms. He is known for his dynamic presentations in CI/CD and application security integrated in software delivery lifecycle.
Gopinath Rebala
Gopinath Rebala is the CTO of OpsMx, where he has overall responsibility for the machine learning and data processing architectures for Secure Software Delivery. Gopi also has a strong connection with our customers, leading design and architecture for strategic implementations. Gopi is a frequent speaker and well-known leader in continuous delivery and integrating security into software delivery.
Key Trends Shaping the Future of Infrastructure.pdfCheryl Hung
Keynote at DIGIT West Expo, Glasgow on 29 May 2024.
Cheryl Hung, ochery.com
Sr Director, Infrastructure Ecosystem, Arm.
The key trends across hardware, cloud and open-source; exploring how these areas are likely to mature and develop over the short and long-term, and then considering how organisations can position themselves to adapt and thrive.
Neuro-symbolic is not enough, we need neuro-*semantic*Frank van Harmelen
Neuro-symbolic (NeSy) AI is on the rise. However, simply machine learning on just any symbolic structure is not sufficient to really harvest the gains of NeSy. These will only be gained when the symbolic structures have an actual semantics. I give an operational definition of semantics as “predictable inference”.
All of this illustrated with link prediction over knowledge graphs, but the argument is general.
Software Delivery At the Speed of AI: Inflectra Invests In AI-Powered QualityInflectra
In this insightful webinar, Inflectra explores how artificial intelligence (AI) is transforming software development and testing. Discover how AI-powered tools are revolutionizing every stage of the software development lifecycle (SDLC), from design and prototyping to testing, deployment, and monitoring.
Learn about:
• The Future of Testing: How AI is shifting testing towards verification, analysis, and higher-level skills, while reducing repetitive tasks.
• Test Automation: How AI-powered test case generation, optimization, and self-healing tests are making testing more efficient and effective.
• Visual Testing: Explore the emerging capabilities of AI in visual testing and how it's set to revolutionize UI verification.
• Inflectra's AI Solutions: See demonstrations of Inflectra's cutting-edge AI tools like the ChatGPT plugin and Azure Open AI platform, designed to streamline your testing process.
Whether you're a developer, tester, or QA professional, this webinar will give you valuable insights into how AI is shaping the future of software delivery.
Slack (or Teams) Automation for Bonterra Impact Management (fka Social Soluti...Jeffrey Haguewood
Sidekick Solutions uses Bonterra Impact Management (fka Social Solutions Apricot) and automation solutions to integrate data for business workflows.
We believe integration and automation are essential to user experience and the promise of efficient work through technology. Automation is the critical ingredient to realizing that full vision. We develop integration products and services for Bonterra Case Management software to support the deployment of automations for a variety of use cases.
This video focuses on the notifications, alerts, and approval requests using Slack for Bonterra Impact Management. The solutions covered in this webinar can also be deployed for Microsoft Teams.
Interested in deploying notification automations for Bonterra Impact Management? Contact us at sales@sidekicksolutionsllc.com to discuss next steps.
Let's dive deeper into the world of ODC! Ricardo Alves (OutSystems) will join us to tell all about the new Data Fabric. After that, Sezen de Bruijn (OutSystems) will get into the details on how to best design a sturdy architecture within ODC.
DevOps and Testing slides at DASA ConnectKari Kakkonen
My and Rik Marselis slides at 30.5.2024 DASA Connect conference. We discuss about what is testing, then what is agile testing and finally what is Testing in DevOps. Finally we had lovely workshop with the participants trying to find out different ways to think about quality and testing in different parts of the DevOps infinity loop.
Dev Dives: Train smarter, not harder – active learning and UiPath LLMs for do...UiPathCommunity
💥 Speed, accuracy, and scaling – discover the superpowers of GenAI in action with UiPath Document Understanding and Communications Mining™:
See how to accelerate model training and optimize model performance with active learning
Learn about the latest enhancements to out-of-the-box document processing – with little to no training required
Get an exclusive demo of the new family of UiPath LLMs – GenAI models specialized for processing different types of documents and messages
This is a hands-on session specifically designed for automation developers and AI enthusiasts seeking to enhance their knowledge in leveraging the latest intelligent document processing capabilities offered by UiPath.
Speakers:
👨🏫 Andras Palfi, Senior Product Manager, UiPath
👩🏫 Lenka Dulovicova, Product Program Manager, UiPath
Transcript: Selling digital books in 2024: Insights from industry leaders - T...BookNet Canada
The publishing industry has been selling digital audiobooks and ebooks for over a decade and has found its groove. What’s changed? What has stayed the same? Where do we go from here? Join a group of leading sales peers from across the industry for a conversation about the lessons learned since the popularization of digital books, best practices, digital book supply chain management, and more.
Link to video recording: https://bnctechforum.ca/sessions/selling-digital-books-in-2024-insights-from-industry-leaders/
Presented by BookNet Canada on May 28, 2024, with support from the Department of Canadian Heritage.
UiPath Test Automation using UiPath Test Suite series, part 3DianaGray10
Welcome to UiPath Test Automation using UiPath Test Suite series part 3. In this session, we will cover desktop automation along with UI automation.
Topics covered:
UI automation Introduction,
UI automation Sample
Desktop automation flow
Pradeep Chinnala, Senior Consultant Automation Developer @WonderBotz and UiPath MVP
Deepak Rai, Automation Practice Lead, Boundaryless Group and UiPath MVP
Connector Corner: Automate dynamic content and events by pushing a buttonDianaGray10
Here is something new! In our next Connector Corner webinar, we will demonstrate how you can use a single workflow to:
Create a campaign using Mailchimp with merge tags/fields
Send an interactive Slack channel message (using buttons)
Have the message received by managers and peers along with a test email for review
But there’s more:
In a second workflow supporting the same use case, you’ll see:
Your campaign sent to target colleagues for approval
If the “Approve” button is clicked, a Jira/Zendesk ticket is created for the marketing design team
But—if the “Reject” button is pushed, colleagues will be alerted via Slack message
Join us to learn more about this new, human-in-the-loop capability, brought to you by Integration Service connectors.
And...
Speakers:
Akshay Agnihotri, Product Manager
Charlie Greenberg, Host
9. output of nodetool help
(87 commands)
usage: nodetool [(-u <username> | --username <username>)]
[(-pw <password> | --password <password>)] [(-h <host> | --host <host>)]
[(-p <port> | --port <port>)]
[(-pwf <passwordFilePath> | --password-file <passwordFilePath>)] <command>
[<args>]
The most commonly used nodetool commands are:
assassinate Forcefully remove a dead node without re-replicating any data. Use as a last resort if you cannot removenode
bootstrap Monitor/manage node's bootstrap process
cleanup Triggers the immediate cleanup of keys no longer belonging to a node. By default, clean all keyspaces
clearsnapshot Remove the snapshot with the given name from the given keyspaces. If no snapshotName is specified we will remove all snapshots
compact Force a (major) compaction on one or more tables
compactionhistory Print history of compaction
compactionstats Print statistics on compactions
decommission Decommission the *node I am connecting to*
describecluster Print the name, snitch, partitioner and schema version of a cluster
describering Shows the token ranges info of a given keyspace
disableautocompaction Disable autocompaction for the given keyspace and table
disablebackup Disable incremental backup
disablebinary Disable native transport (binary protocol)
disablegossip Disable gossip (effectively marking the node down)
disablehandoff Disable storing hinted handoffs
disablehintsfordc Disable hints for a data center
disablethrift Disable thrift server
drain Drain the node (stop accepting writes and flush all tables)
enableautocompaction Enable autocompaction for the given keyspace and table
enablebackup Enable incremental backup
enablebinary Reenable native transport (binary protocol)
enablegossip Reenable gossip
enablehandoff Reenable future hints storing on the current node
enablehintsfordc Enable hints for a data center that was previsouly disabled
enablethrift Reenable thrift server
failuredetector Shows the failure detector information for the cluster
flush Flush one or more tables
gcstats Print GC Statistics
getcompactionthreshold Print min and max compaction thresholds for a given table
getcompactionthroughput Print the MB/s throughput cap for compaction in the system
getendpoints Print the end points that owns the key
getinterdcstreamthroughput Print the Mb/s throughput cap for inter-datacenter streaming in the system
getlogginglevels Get the runtime logging levels
getsstables Print the sstable filenames that own the key
getstreamthroughput Print the Mb/s throughput cap for streaming in the system
gettraceprobability Print the current trace probability value
gossipinfo Shows the gossip information for the cluster
help Display help information
info Print node information (uptime, load, ...)
invalidatecountercache Invalidate the counter cache
invalidatekeycache Invalidate the key cache
invalidaterowcache Invalidate the row cache
join Join the ring
listsnapshots Lists all the snapshots along with the size on disk and true size.
move Move node on the token ring to a new token
netstats Print network information on provided host (connecting node by default)
pausehandoff Pause hints delivery process
proxyhistograms Print statistic histograms for network operations
rangekeysample Shows the sampled keys held across all keyspaces
rebuild Rebuild data by streaming from other nodes (similarly to bootstrap)
rebuild_index A full rebuild of native secondary indexes for a given table
refresh Load newly placed SSTables to the system without restart
refreshsizeestimates Refresh system.size_estimates
reloadtriggers Reload trigger classes
removenode Show status of current node removal, force completion of pending removal or remove provided ID
repair Repair one or more tables
replaybatchlog Kick off batchlog replay and wait for finish
resetlocalschema Reset node's local schema and resync
resumehandoff Resume hints delivery process
ring Print information about the token ring
scrub Scrub (rebuild sstables for) one or more tables
setcachecapacity Set global key, row, and counter cache capacities (in MB units)
setcachekeystosave Set number of keys saved by each cache for faster post-restart warmup. 0 to disable
setcompactionthreshold Set min and max compaction thresholds for a given table
setcompactionthroughput Set the MB/s throughput cap for compaction in the system, or 0 to disable throttling
sethintedhandoffthrottlekb Set hinted handoff throttle in kb per second, per delivery thread.
setinterdcstreamthroughput Set the Mb/s throughput cap for inter-datacenter streaming in the system, or 0 to disable throttling
setlogginglevel Set the log level threshold for a given class. If both class and level are empty/null, it will reset to the initial configuration
setstreamthroughput Set the Mb/s throughput cap for streaming in the system, or 0 to disable throttling
settraceprobability Sets the probability for tracing any given request to value. 0 disables, 1 enables for all requests, 0 is the default
snapshot Take a snapshot of specified keyspaces or a snapshot of the specified table
status Print cluster information (state, load, IDs, ...)
statusbackup Status of incremental backup
statusbinary Status of native transport (binary protocol)
statusgossip Status of gossip
statushandoff Status of storing future hints on the current node
statusthrift Status of thrift server
stop Stop compaction
stopdaemon Stop cassandra daemon
tablehistograms Print statistic histograms for a given table
tablestats Print statistics on tables
toppartitions Sample and print the most active partitions for a given column family
tpstats Print usage statistics of thread pools
truncatehints Truncate all hints on the local node, or truncate hints for the endpoint(s) specified.
upgradesstables Rewrite sstables (for the requested tables) that are not on the current version (thus upgrading them to said current version)
verify Verify (check data checksum for) one or more tables
version Print cassandra version
See 'nodetool help <command>' for more information on a specific command.
10. nodetool commands: info
ID : fed6dd09-667c-4cc5-b66a-85a1cbce1b58
Gossip active : true
Thrift active : false
Native Transport active: true
Load : 219.97 KB
Generation No : 1473125362
Uptime (seconds) : 28802
Heap Memory (MB) : 86.96 / 495.00
Off Heap Memory (MB) : 0.00
Data Center : datacenter1
Rack : rack1
Exceptions : 0
Key Cache : entries 27, size 2.15 KB, capacity 24 MB, 274 hits, 313 requests, 0.875 recent hit rate, 14400 save period in seconds
Row Cache : entries 0, size 0 bytes, capacity 0 bytes, 0 hits, 0 requests, NaN recent hit rate, 0 save period in seconds
Counter Cache : entries 0, size 0 bytes, capacity 12 MB, 0 hits, 0 requests, NaN recent hit rate, 7200 save period in seconds
Token : -9223372036854775808
11. nodetool commands: info
ID : fed6dd09-667c-4cc5-b66a-85a1cbce1b58
Gossip active : true
Thrift active : false
Native Transport active: true
Load : 219.97 KB
Generation No : 1473125362
Uptime (seconds) : 28802
Heap Memory (MB) : 86.96 / 495.00
Off Heap Memory (MB) : 0.00
Data Center : datacenter1
Rack : rack1
Exceptions : 0
Key Cache : entries 27, size 2.15 KB, capacity 24 MB, 274 hits, 313 requests, 0.875 recent hit rate, 14400 save period in seconds
Row Cache : entries 0, size 0 bytes, capacity 0 bytes, 0 hits, 0 requests, NaN recent hit rate, 0 save period in seconds
Counter Cache : entries 0, size 0 bytes, capacity 12 MB, 0 hits, 0 requests, NaN recent hit rate, 7200 save period in seconds
Token : -9223372036854775808
12. nodetool commands: info
ID : fed6dd09-667c-4cc5-b66a-85a1cbce1b58
Gossip active : true
Thrift active : false
Native Transport active: true
Load : 219.97 KB
Generation No : 1473125362
Uptime (seconds) : 28802
Heap Memory (MB) : 86.96 / 495.00
Off Heap Memory (MB) : 0.00
Data Center : datacenter1
Rack : rack1
Exceptions : 0
Key Cache : entries 27, size 2.15 KB, capacity 24 MB, 274 hits, 313 requests, 0.875 recent hit rate, 14400 save period
Row Cache : entries 0, size 0 bytes, capacity 0 bytes, 0 hits, 0 requests, NaN recent hit rate, 0 save period in seconds
Counter Cache : entries 0, size 0 bytes, capacity 12 MB, 0 hits, 0 requests, NaN recent hit rate, 7200 save period in seconds
Token : -9223372036854775808
13. nodetool commands: info
ID : fed6dd09-667c-4cc5-b66a-85a1cbce1b58
Gossip active : true
Thrift active : false
Native Transport active: true
Load : 219.97 KB
Generation No : 1473125362
Uptime (seconds) : 28802
Heap Memory (MB) : 86.96 / 495.00
Off Heap Memory (MB) : 0.00
Data Center : datacenter1
Rack : rack1
Exceptions : 0
Key Cache : entries 27, size 2.15 KB, capacity 24 MB, 274 hits, 313 requests, 0.875 recent hit rate, 14400 save period
Row Cache : entries 0, size 0 bytes, capacity 0 bytes, 0 hits, 0 requests, NaN recent hit rate, 0 save period in seconds
Counter Cache : entries 0, size 0 bytes, capacity 12 MB, 0 hits, 0 requests, NaN recent hit rate, 7200 save period in seconds
Token : -9223372036854775808
tip: nodetool setcachecapacity <key> <row> <counter>
14. $ nodetool compactionstats -H
pending tasks: 2101
id type keyspace table completed total progress
d14fc600-6e3f-11e6-a01c-8bcdc0e93c44 Compaction ads ad_events 742.58 MB 4.1 TB 0.02%
Active compaction remaining time : 37h18m47s
nodetool commands: compactionstats
15. $ nodetool compactionstats -H
pending tasks: 2101
id type keyspace table completed total progress
d14fc600-6e3f-11e6-a01c-8bcdc0e93c44 Compaction ads ad_events 742.58 MB 4.1 TB 0.02%
Active compaction remaining time : 37h18m47s
nodetool commands: compactionstats
16. nodetool commands: compactionstats
$ nodetool compactionstats -H
pending tasks: 2101
id type keyspace table completed total progress
d14fc600-6e3f-11e6-a01c-8bcdc0e93c44 Compaction ads ad_events 742.58 MB 4.1 TB 0.02%
Active compaction remaining time : 37h18m47s
17. nodetool commands: tablestats
Keyspace: jmx_adventure
Read Count: 19
Read Latency: 0.3552105263157895 ms.
Write Count: 3
Write Latency: 0.17766666666666667 ms.
Pending Flushes: 0
Table: account_event
SSTable count: 1
Space used (live): 5326
Space used (total): 5326
Space used by snapshots (total): 0
Off heap memory used (total): 51
SSTable Compression Ratio: 0.6517241379310345
Number of keys (estimate): 3
Memtable cell count: 0
Memtable data size: 0
Memtable off heap memory used: 0
Memtable switch count: 1
Local read count: 19
Local read latency: 0.386 ms
Local write count: 3
Local write latency: 0.207 ms
Pending flushes: 0
Bloom filter false positives: 0
Bloom filter false ratio: 0.00000
Bloom filter space used: 16
Bloom filter off heap memory used: 8
Index summary off heap memory used: 27
Compression metadata off heap memory used: 16
Compacted partition minimum bytes: 51
Compacted partition maximum bytes: 149
Compacted partition mean bytes: 104
Average live cells per slice (last five minutes): 2.263157894736842
Maximum live cells per slice (last five minutes): 3
Average tombstones per slice (last five minutes): 1.0
Maximum tombstones per slice (last five minutes): 1
18. nodetool commands: tablestats
Keyspace: jmx_adventure
Read Count: 19
Read Latency: 0.3552105263157895 ms.
Write Count: 3
Write Latency: 0.17766666666666667 ms.
Pending Flushes: 0
Table: account_event
SSTable count: 1
Space used (live): 5326
Space used (total): 5326
Space used by snapshots (total): 0
Off heap memory used (total): 51
SSTable Compression Ratio: 0.6517241379310345
Number of keys (estimate): 3
Memtable cell count: 0
Memtable data size: 0
Memtable off heap memory used: 0
Memtable switch count: 1
Local read count: 19
Local read latency: 0.386 ms
Local write count: 3
Local write latency: 0.207 ms
Pending flushes: 0
Bloom filter false positives: 0
Bloom filter false ratio: 0.00000
Bloom filter space used: 16
Bloom filter off heap memory used: 8
Index summary off heap memory used: 27
Compression metadata off heap memory used: 16
Compacted partition minimum bytes: 51
Compacted partition maximum bytes: 149
Compacted partition mean bytes: 104
Average live cells per slice (last five minutes): 2.263157894736842
Maximum live cells per slice (last five minutes): 3
Average tombstones per slice (last five minutes): 1.0
Maximum tombstones per slice (last five minutes): 1
tombstones per read
partition size
read and write latency
memtable usage
index summary usage
19. nodetool commands: tablestats
Keyspace: jmx_adventure
Read Count: 19
Read Latency: 0.3552105263157895 ms.
Write Count: 3
Write Latency: 0.17766666666666667 ms.
Pending Flushes: 0
Table: account_event
SSTable count: 1
Space used (live): 5326
Space used (total): 5326
Space used by snapshots (total): 0
Off heap memory used (total): 51
SSTable Compression Ratio: 0.6517241379310345
Number of keys (estimate): 3
Memtable cell count: 2
Memtable data size: 122
Memtable off heap memory used: 96
Memtable switch count: 1
Local read count: 19
Local read latency: 0.386 ms
Local write count: 3
Local write latency: 0.207 ms
Pending flushes: 0
Bloom filter false positives: 0
Bloom filter false ratio: 0.00000
Bloom filter space used: 16
Bloom filter off heap memory used: 8
Index summary off heap memory used: 27
Compression metadata off heap memory used: 16
Compacted partition minimum bytes: 51
Compacted partition maximum bytes: 149
Compacted partition mean bytes: 104
Average live cells per slice (last five minutes): 2.263157894736842
Maximum live cells per slice (last five minutes): 3
Average tombstones per slice (last five minutes): 1.0
Maximum tombstones per slice (last five minutes): 1
tombstones per read
partition size
read and write latency
memtable usage
index summary usage
20. nodetool commands: tablestats
Keyspace: jmx_adventure
Read Count: 19
Read Latency: 0.3552105263157895 ms.
Write Count: 3
Write Latency: 0.17766666666666667 ms.
Pending Flushes: 0
Table: account_event
SSTable count: 1
Space used (live): 5326
Space used (total): 5326
Space used by snapshots (total): 0
Off heap memory used (total): 51
SSTable Compression Ratio: 0.6517241379310345
Number of keys (estimate): 3
Memtable cell count: 0
Memtable data size: 0
Memtable off heap memory used: 0
Memtable switch count: 1
Local read count: 19
Local read latency: 0.386 ms
Local write count: 3
Local write latency: 0.207 ms
Pending flushes: 0
Bloom filter false positives: 0
Bloom filter false ratio: 0.00000
Bloom filter space used: 16
Bloom filter off heap memory used: 8
Index summary off heap memory used: 27
Compression metadata off heap memory used: 16
Compacted partition minimum bytes: 51
Compacted partition maximum bytes: 149
Compacted partition mean bytes: 104
Average live cells per slice (last five minutes): 2.263157894736842
Maximum live cells per slice (last five minutes): 3
Average tombstones per slice (last five minutes): 1.0
Maximum tombstones per slice (last five minutes): 1
tombstones per read
partition size
read and write latency
memtable usage
index summary usage
21. nodetool commands: tablestats
Keyspace: jmx_adventure
Read Count: 19
Read Latency: 0.3552105263157895 ms.
Write Count: 3
Write Latency: 0.17766666666666667 ms.
Pending Flushes: 0
Table: account_event
SSTable count: 1
Space used (live): 5326
Space used (total): 5326
Space used by snapshots (total): 0
Off heap memory used (total): 51
SSTable Compression Ratio: 0.6517241379310345
Number of keys (estimate): 3
Memtable cell count: 0
Memtable data size: 0
Memtable off heap memory used: 0
Memtable switch count: 1
Local read count: 19
Local read latency: 0.386 ms
Local write count: 3
Local write latency: 0.207 ms
Pending flushes: 0
Bloom filter false positives: 0
Bloom filter false ratio: 0.00000
Bloom filter space used: 16
Bloom filter off heap memory used: 8
Index summary off heap memory used: 27
Compression metadata off heap memory used: 16
Compacted partition minimum bytes: 51
Compacted partition maximum bytes: 149
Compacted partition mean bytes: 104
Average live cells per slice (last five minutes): 2.263157894736842
Maximum live cells per slice (last five minutes): 3
Average tombstones per slice (last five minutes): 1.0
Maximum tombstones per slice (last five minutes): 1
tombstones per read
partition size
read and write latency
memtable usage
index summary usage
22. nodetool commands: tablestats
Keyspace: jmx_adventure
Read Count: 19
Read Latency: 0.3552105263157895 ms.
Write Count: 3
Write Latency: 0.17766666666666667 ms.
Pending Flushes: 0
Table: account_event
SSTable count: 1
Space used (live): 5326
Space used (total): 5326
Space used by snapshots (total): 0
Off heap memory used (total): 51
SSTable Compression Ratio: 0.6517241379310345
Number of keys (estimate): 3
Memtable cell count: 0
Memtable data size: 0
Memtable off heap memory used: 0
Memtable switch count: 1
Local read count: 19
Local read latency: 0.386 ms
Local write count: 3
Local write latency: 0.207 ms
Pending flushes: 0
Bloom filter false positives: 0
Bloom filter false ratio: 0.00000
Bloom filter space used: 16
Bloom filter off heap memory used: 8
Index summary off heap memory used: 27
Compression metadata off heap memory used: 16
Compacted partition minimum bytes: 51
Compacted partition maximum bytes: 149
Compacted partition mean bytes: 104
Average live cells per slice (last five minutes): 2.263
Maximum live cells per slice (last five minutes): 3
Average tombstones per slice (last five minutes): 1.0
Maximum tombstones per slice (last five minutes): 1
tombstones per read
partition size
read and write latency
memtable usage
index summary usage
27. JMX on the HTTP
when it does work, it looks like this (2.2.7 and below):
28. JMX on the HTTP
when it does work, it looks like this:
ewww gross.
29. JMX on the HTTP (with JSON!)
via Jolokia
https://jolokia.org/
30. JMX on the HTTP (with JSON!)
via Jolokia
https://jolokia.org/
JSON: it's ok.
31. JMX on the HTTP (with JSON!)
via Jolokia
http://search.maven.org/remotecontent?filepath=org/jolokia/jolokia-jvm/1.3.4/jolokia-jvm-1.3.4-
agent.jar
1. download: jolokia-jvm-1.3.4-agent.jar
2. place in: $CASSANDRA_HOME/lib
3. in cassandra-env.sh, add: JVM_OPTS="$JVM_OPTS -
javaagent:$CASSANDRA_HOME/lib/jolokia-
jvm-1.3.4-agent.jar"
32. JMX on the command line
jmxsh
jmxterm
http://wiki.cyclopsgroup.org/jmxterm/download.html
https://github.com/davr/jmxsh
33. jmxsh
jmxterm
JMX on the command line
http://wiki.cyclopsgroup.org/jmxterm/download.html
https://github.com/davr/jmxsh
Almost identical!
34. jmxsh
jmxterm
JMX on the command line
http://wiki.cyclopsgroup.org/jmxterm/download.html
https://github.com/davr/jmxsh
Almost identical!
Not updated in years!
35. JMX on the command line
$ java -jar $HOME/services/jmxterm-1.0-alpha-4-uber.jar -l 127.0.0.1:7200
Welcome to JMX terminal. Type "help" for available commands.
$>bean org.apache.cassandra.net:type=MessagingService
#bean is set to org.apache.cassandra.net:type=MessagingService
$>get TimeoutsPerHost
#mbean = org.apache.cassandra.net:type=MessagingService:
TimeoutsPerHost = {
127.0.0.1 = 0;
127.0.0.3 = 0;
};
36. JMX on the command line
$ java -jar $HOME/services/jmxterm-1.0-alpha-4-uber.jar -l 127.0.0.1:7200
Welcome to JMX terminal. Type "help" for available commands.
$>bean org.apache.cassandra.net:type=MessagingService
#bean is set to org.apache.cassandra.net:type=MessagingService
$>get TimeoutsPerHost
#mbean = org.apache.cassandra.net:type=MessagingService:
TimeoutsPerHost = {
127.0.0.1 = 0;
127.0.0.3 = 0;
};
37. JMX on the command line
$ java -jar $HOME/services/jmxterm-1.0-alpha-4-uber.jar -l 127.0.0.1:7200
Welcome to JMX terminal. Type "help" for available commands.
$>bean org.apache.cassandra.net:type=MessagingService
#bean is set to org.apache.cassandra.net:type=MessagingService
$>get TimeoutsPerHost
#mbean = org.apache.cassandra.net:type=MessagingService:
TimeoutsPerHost = {
127.0.0.1 = 0;
127.0.0.3 = 0;
};
38. JMX on the command line
$ java -jar $HOME/services/jmxterm-1.0-alpha-4-uber.jar -l 127.0.0.1:7200
Welcome to JMX terminal. Type "help" for available commands.
$>bean org.apache.cassandra.net:type=MessagingService
#bean is set to org.apache.cassandra.net:type=MessagingService
$>get TimeoutsPerHost
#mbean = org.apache.cassandra.net:type=MessagingService:
TimeoutsPerHost = {
127.0.0.1 = 0;
127.0.0.3 = 0;
};
39. JMX on the command line
$ echo "set -b org.apache.cassandra.db:type=CompactionManager
MaximumCompactorThreads 6" |
java -jar jmxterm-1.0-alpha-4-uber.jar -l 172.17.41.232:7199
&&
echo "set -b org.apache.cassandra.db:type=CompactionManager
CoreCompactorThreads 6" |
java -jar jmxterm-1.0-alpha-4-uber.jar -l 172.17.41.232:7199
setting compaction threads in one shot
40. JMX on the command line
$ echo "set -b org.apache.cassandra.db:type=CompactionManager
MaximumCompactorThreads 6" |
java -jar jmxterm-1.0-alpha-4-uber.jar -l 172.17.41.232:7199
&&
echo "set -b org.apache.cassandra.db:type=CompactionManager
CoreCompactorThreads 6" |
java -jar jmxterm-1.0-alpha-4-uber.jar -l 172.17.41.232:7199
just echo and 'pipe'
setting compaction threads in one shot
41. $>bean org.apache.cassandra.db:type=BatchlogManager
#bean is set to org.apache.cassandra.db:type=BatchlogManager
$>info
#mbean = org.apache.cassandra.db:type=BatchlogManager
#class name = org.apache.cassandra.batchlog.BatchlogManager
# attributes
%0 - TotalBatchesReplayed (long, r)
# operations
%0 - int countAllBatches()
%1 - void forceBatchlogReplay()
#there's no notifications
$>get TotalBatchesReplayed
#mbean = org.apache.cassandra.db:type=BatchlogManager:
TotalBatchesReplayed = 0;
$>run countAllBatches
#calling operation countAllBatches of mbean org.apache.cassandra.db:type=BatchlogManager
#operation returns:
0
JMX on the command line: general syntax
42. $>bean org.apache.cassandra.db:type=BatchlogManager
#bean is set to org.apache.cassandra.db:type=BatchlogManager
$>info
#mbean = org.apache.cassandra.db:type=BatchlogManager
#class name = org.apache.cassandra.batchlog.BatchlogManager
# attributes
%0 - TotalBatchesReplayed (long, r)
# operations
%0 - int countAllBatches()
%1 - void forceBatchlogReplay()
#there's no notifications
$>get TotalBatchesReplayed
#mbean = org.apache.cassandra.db:type=BatchlogManager:
TotalBatchesReplayed = 0;
$>run countAllBatches
#calling operation countAllBatches of mbean org.apache.cassandra.db:type=BatchlogManager
#operation returns:
0
JMX on the command line: general syntax
Set the bean
43. $>bean org.apache.cassandra.db:type=BatchlogManager
#bean is set to org.apache.cassandra.db:type=BatchlogManager
$>info
#mbean = org.apache.cassandra.db:type=BatchlogManager
#class name = org.apache.cassandra.batchlog.BatchlogManager
# attributes
%0 - TotalBatchesReplayed (long, r)
# operations
%0 - int countAllBatches()
%1 - void forceBatchlogReplay()
#there's no notifications
$>get TotalBatchesReplayed
#mbean = org.apache.cassandra.db:type=BatchlogManager:
TotalBatchesReplayed = 0;
$>run countAllBatches
#calling operation countAllBatches of mbean org.apache.cassandra.db:type=BatchlogManager
#operation returns:
0
'info' for what is available
JMX on the command line: general syntax
44. $>bean org.apache.cassandra.db:type=BatchlogManager
#bean is set to org.apache.cassandra.db:type=BatchlogManager
$>info
#mbean = org.apache.cassandra.db:type=BatchlogManager
#class name = org.apache.cassandra.batchlog.BatchlogManager
# attributes
%0 - TotalBatchesReplayed (long, r)
# operations
%0 - int countAllBatches()
%1 - void forceBatchlogReplay()
#there's no notifications
$>get TotalBatchesReplayed
#mbean = org.apache.cassandra.db:type=BatchlogManager:
TotalBatchesReplayed = 0;
$>run countAllBatches
#calling operation countAllBatches of mbean org.apache.cassandra.db:type=BatchlogManager
#operation returns:
0
'get' an attribute
JMX on the command line: general syntax
45. $>bean org.apache.cassandra.db:type=BatchlogManager
#bean is set to org.apache.cassandra.db:type=BatchlogManager
$>info
#mbean = org.apache.cassandra.db:type=BatchlogManager
#class name = org.apache.cassandra.batchlog.BatchlogManager
# attributes
%0 - TotalBatchesReplayed (long, r)
# operations
%0 - int countAllBatches()
%1 - void forceBatchlogReplay()
#there's no notifications
$>get TotalBatchesReplayed
#mbean = org.apache.cassandra.db:type=BatchlogManager:
TotalBatchesReplayed = 0;
$>run countAllBatches
#calling operation countAllBatches of mbean org.apache.cassandra.db:type=BatchlogManager
#operation returns:
0
'run' an operation
JMX on the command line: general syntax
61. Commitlog efficiency: waiting on commit
If this is high, you need to tune
Time spent waiting for sync. This will climb if
sync is lagging sync interval
63. Tombstone impact and compaction
SSTable max local deletion time: 2147483647
Compression ratio: 0.5167785234899329
Estimated droppable tombstones: 0.3175
SSTable Level: 0
Repaired at: 0
Estimated tombstone drop times:
1471577046: 2
1471577146: 2
la-8-big-Data.db
64. Tombstone impact and compaction
SSTable max local deletion time: 2147483647
Compression ratio: 0.5167785234899329
Estimated droppable tombstones: 0.3175
SSTable Level: 0
Repaired at: 0
Estimated tombstone drop times:
1471577046: 2
1471577146: 2
la-8-big-Data.db
Go see Alain's other talk
65. Tombstone impact and compaction
SSTable max local deletion time: 2147483647
Compression ratio: 0.5167785234899329
Estimated droppable tombstones: 0.3175
SSTable Level: 0
Repaired at: 0
Estimated tombstone drop times:
1471577046: 2
1471577146: 2
la-8-big-Data.db
Go see Alain's other talk
Or just read his blog:
http://thelastpickle.com/blog/2016/07/27/about-deletes-and-tombstones.html
71. Turn it off via StorageService#updateSnitch:
GossipingPropertyFileSnitch, false, 0, 0, 0
DynamicSnitch: disabling
72. Turn it off via StorageService#updateSnitch:
GossipingPropertyFileSnitch, false, 0, 0, 0
DynamicSnitch: disabling
false
73. Turn it off via StorageService#updateSnitch:
GossipingPropertyFileSnitch, false, 0, 0, 0
DynamicSnitch: disabling
I have no idea what will happen
if you change the snitch
81. CompactionManager: stop compaction
type of compaction, most commonly:
COMPACTION, VALIDATION, ANTI_COMPACTION, INDEX_SUMMARY
https://github.com/apache/cassandra/blob/cassandra-3.0/src/java/org/apache/cassandra/db/compaction/OperationType.java
120. Why do I need to secure JMX?
StorageService.truncate("your_keyspace", "your_table")
121. Why do I need to secure JMX?
StorageService.truncate("your_keyspace", "your_table")
122. Why do I need to secure JMX?
StorageService.truncate("your_keyspace", "your_table")
Now with internet access!!
123. Why do I need to secure JMX?
StorageService.truncate("your_keyspace", "your_table")
Now with internet access!!
Works as Advertised!
124. Why do I need to secure JMX?
StorageService.removeNode("coworker_IPADR")
125. Why do I need to secure JMX?
StorageService.removeNode("coworker_IPADR")
Fun for the whole
development team!
126. Securing JMX
SSL setup is like node to node and client to server
http://docs.oracle.com/javase/8/docs/technotes/guides/management/agent.html
127. Securing JMX
JMX Authentication is straightforward
and well documented
$JAVA_HOME/jre/lib/management/jmxremote.access
$JAVA_HOME/jre/lib/management/
jmxremote.password.template
http://docs.oracle.com/javase/8/docs/technotes/guides/management/agent.html