Downloaded 74 times

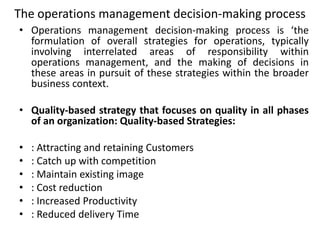
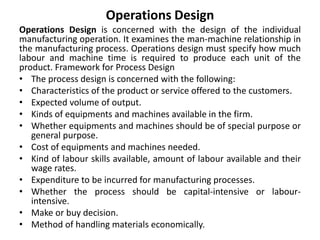
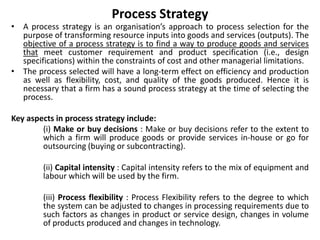
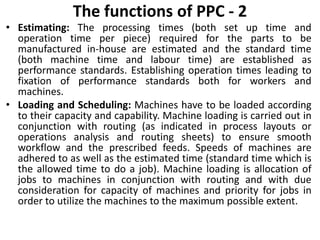
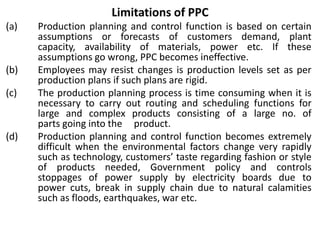
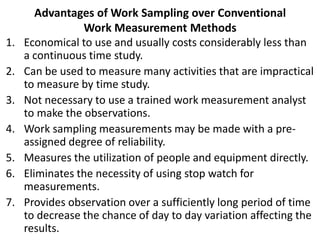
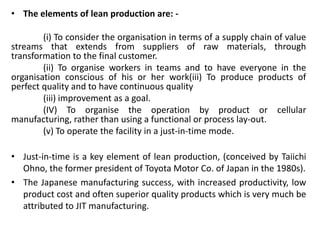
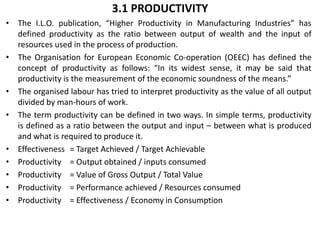
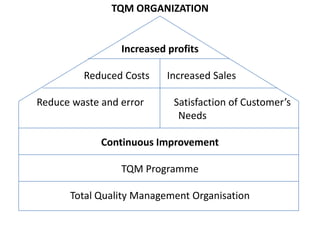
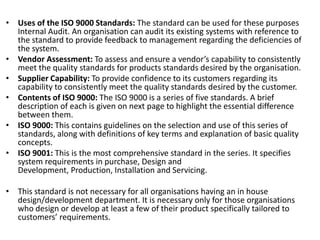
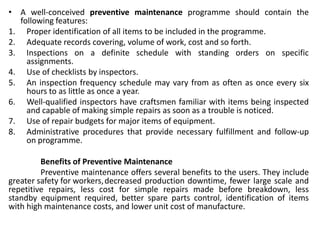
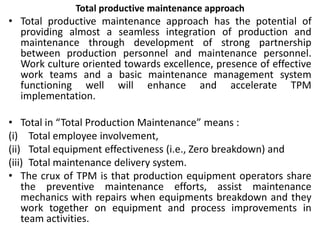
![• Economic Batch Quantity (EBQ) or Economic Run Length (ERL): Two types of costs associated with lot
manufacture are: (a) Set-up costs i.e., costs/unit which decrease with batch size. (b) Inventory carrying cost
which increases with batch size.
• Economic Batch Qty. (EBQ) or Economic Run Length (ERL) =
2 x Annual demand x Set-up cost
Under root of -------------------------------------------
Unit cost x Inventory carrying cost (%)
• If inventory carrying cost is expressed as carrying cost per unit per year for an item instead of as a
percentage of the value of its inventory, then, Carrying cost per unit per year Cc = C x l (Rupees) (i.e., unit
cost x carrying cost as %age)
• 2 x A x S
• The EBQ formula can be rewritten as EBQ = UNDER ROOT OF ----------
• Cc
• Economic Batch Quantity 2 x Annual Cost x Setup cost
= Under Root of --------------------------------------------------------------
Unit cost Inventory carrying cost per unit per year (Rs)
• Considering the case where production and consumption of an item takes place simultaneously
• Let A = Annual demand for an item & d = demand or consumption rate (unit/time period (say weekly)
• p = production rate (units/time period (say weekly)] & S = set up cost per set up
• C = cost per unit of item produced & I = Inventory carrying cost per year per unit as a % ge of value of
inventory
• Economic batch quantity (Non-instantaneous supply)
• Economic Batch Quantity 2 x A x S
= Under Root of ---------------------------------------
C x I x (1 – d / p)](https://image.slidesharecdn.com/operationmanagement-icwainter-140508040238-phpapp02/85/Operation-management-icwa-inter-104-320.jpg)

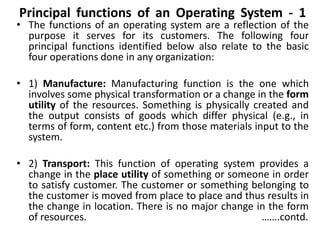
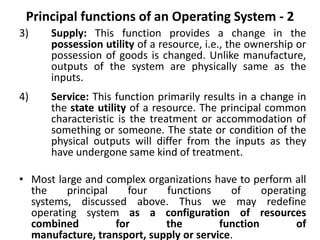
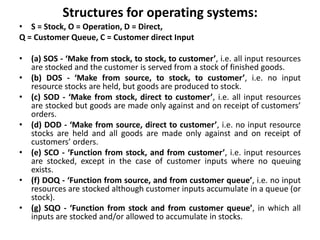
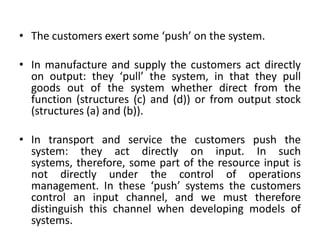
This document provides an overview of operations management concepts from an expert in the field. It defines key terms like operating systems, resources, functions, and structures. It discusses product life cycles, process planning, and types of processes. It also outlines the roles and responsibilities of operations management in areas like inventory, quality control, maintenance, and scheduling. Finally, it notes that operations management is concerned with designing systems for manufacturing, transport, supply, or service delivery.


![Unit_1[2] POM.pptx](https://cdn.slidesharecdn.com/ss_thumbnails/unit12pom-231012142201-685a0833-thumbnail.jpg?width=640&height=640&fit=bounds)


