Download to read offline
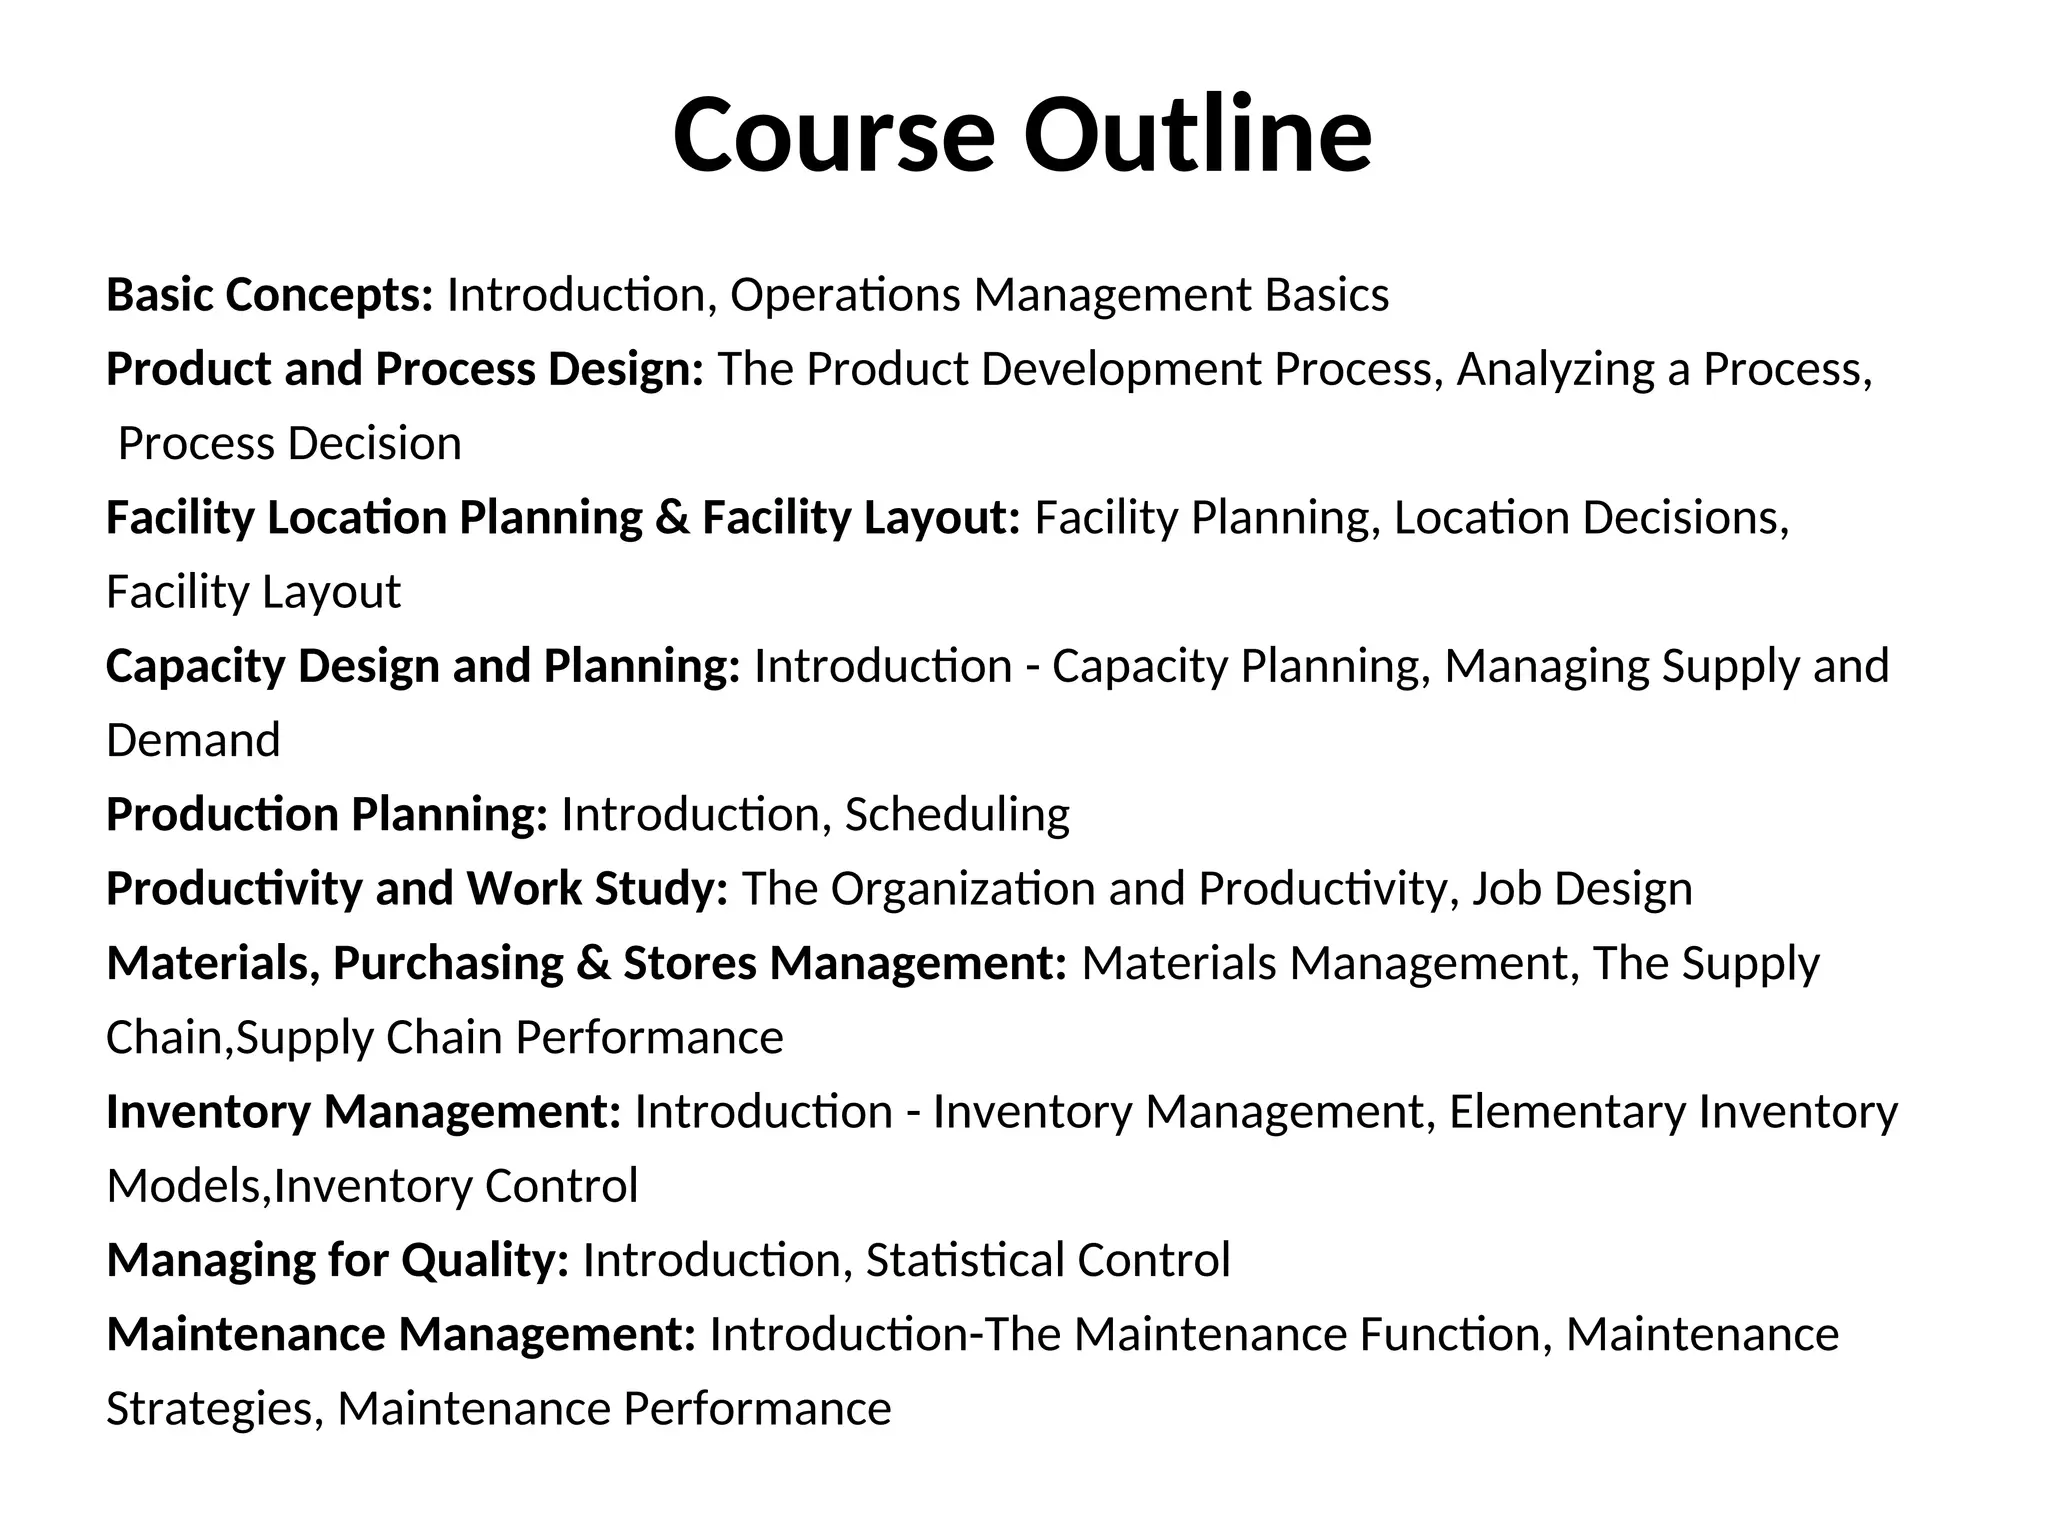
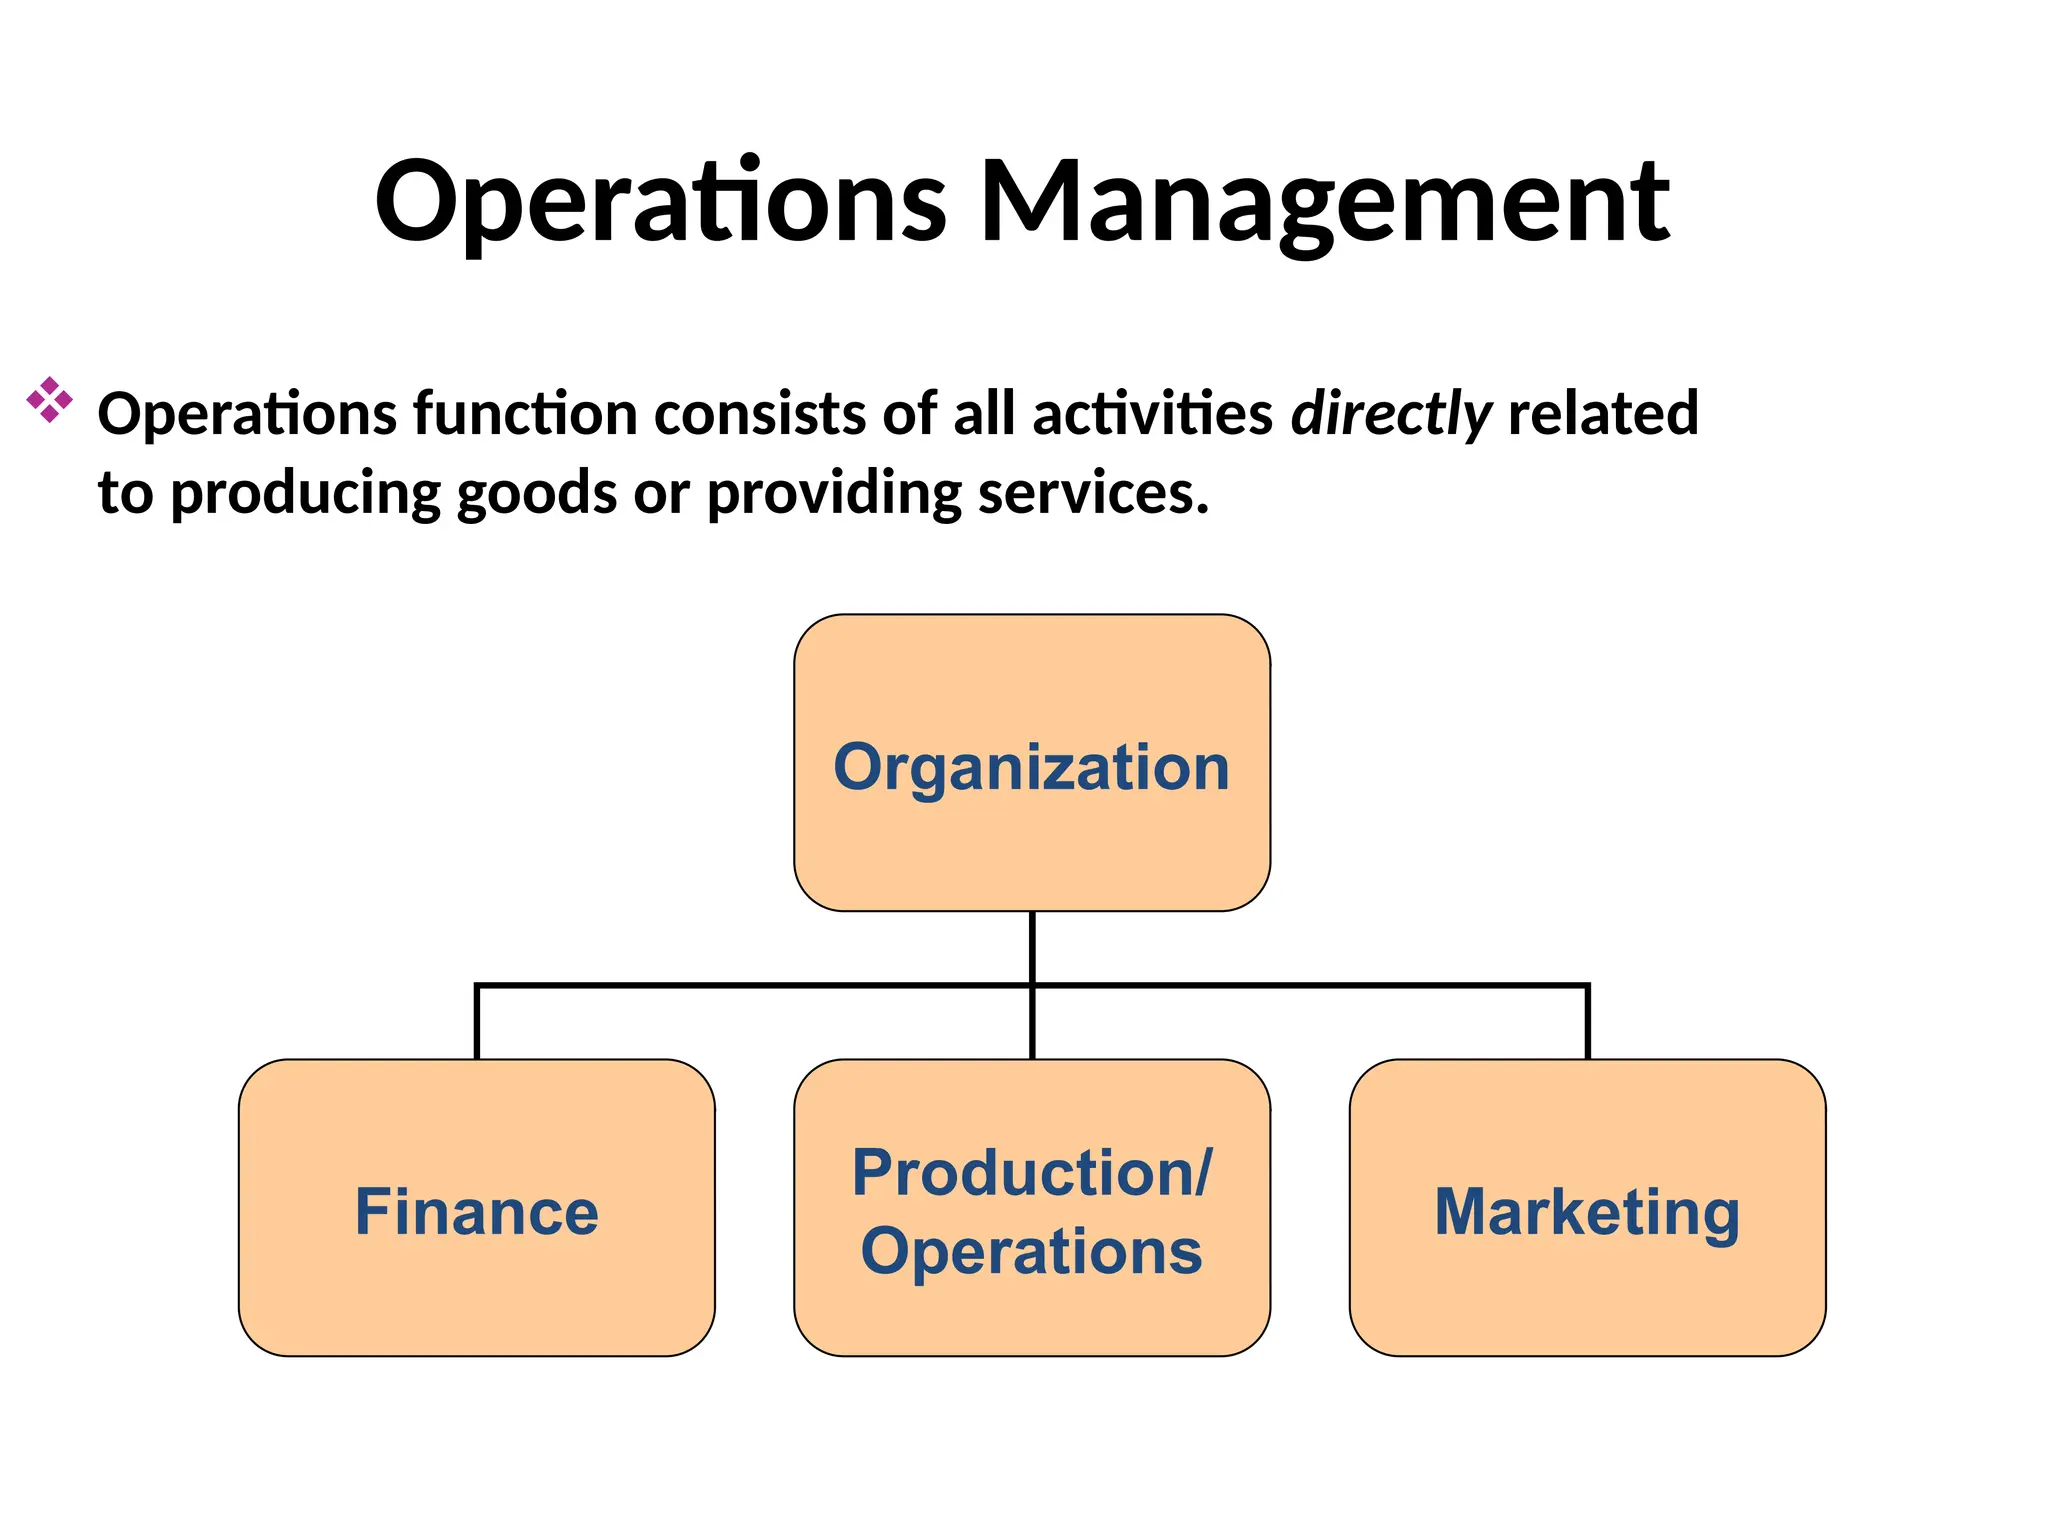
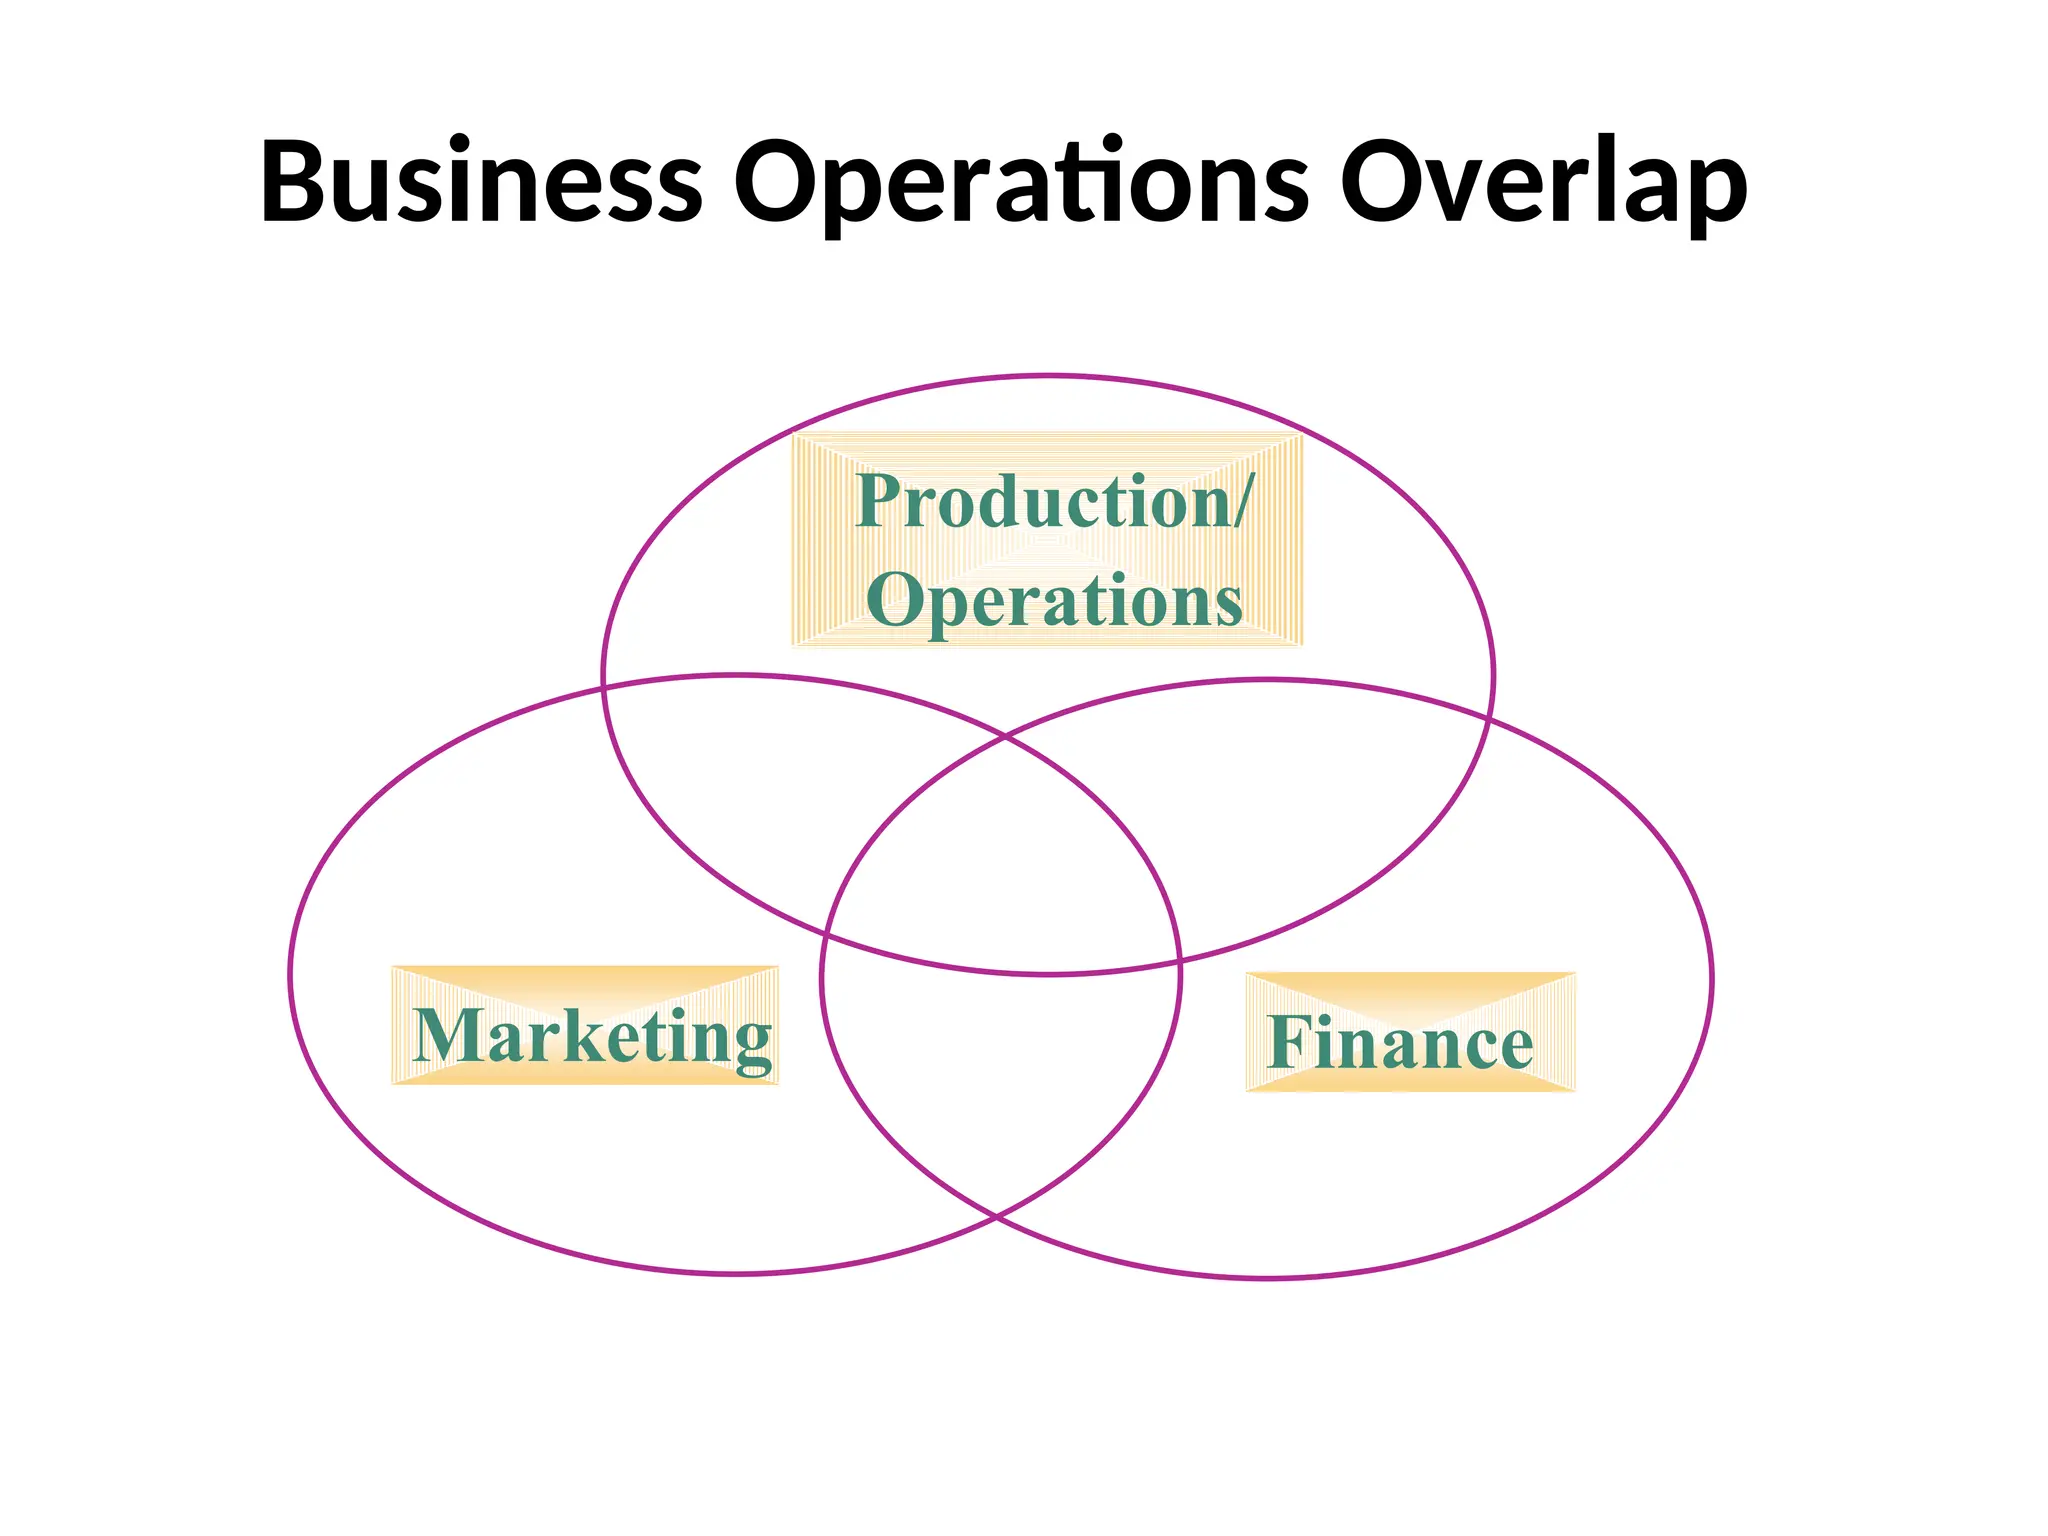
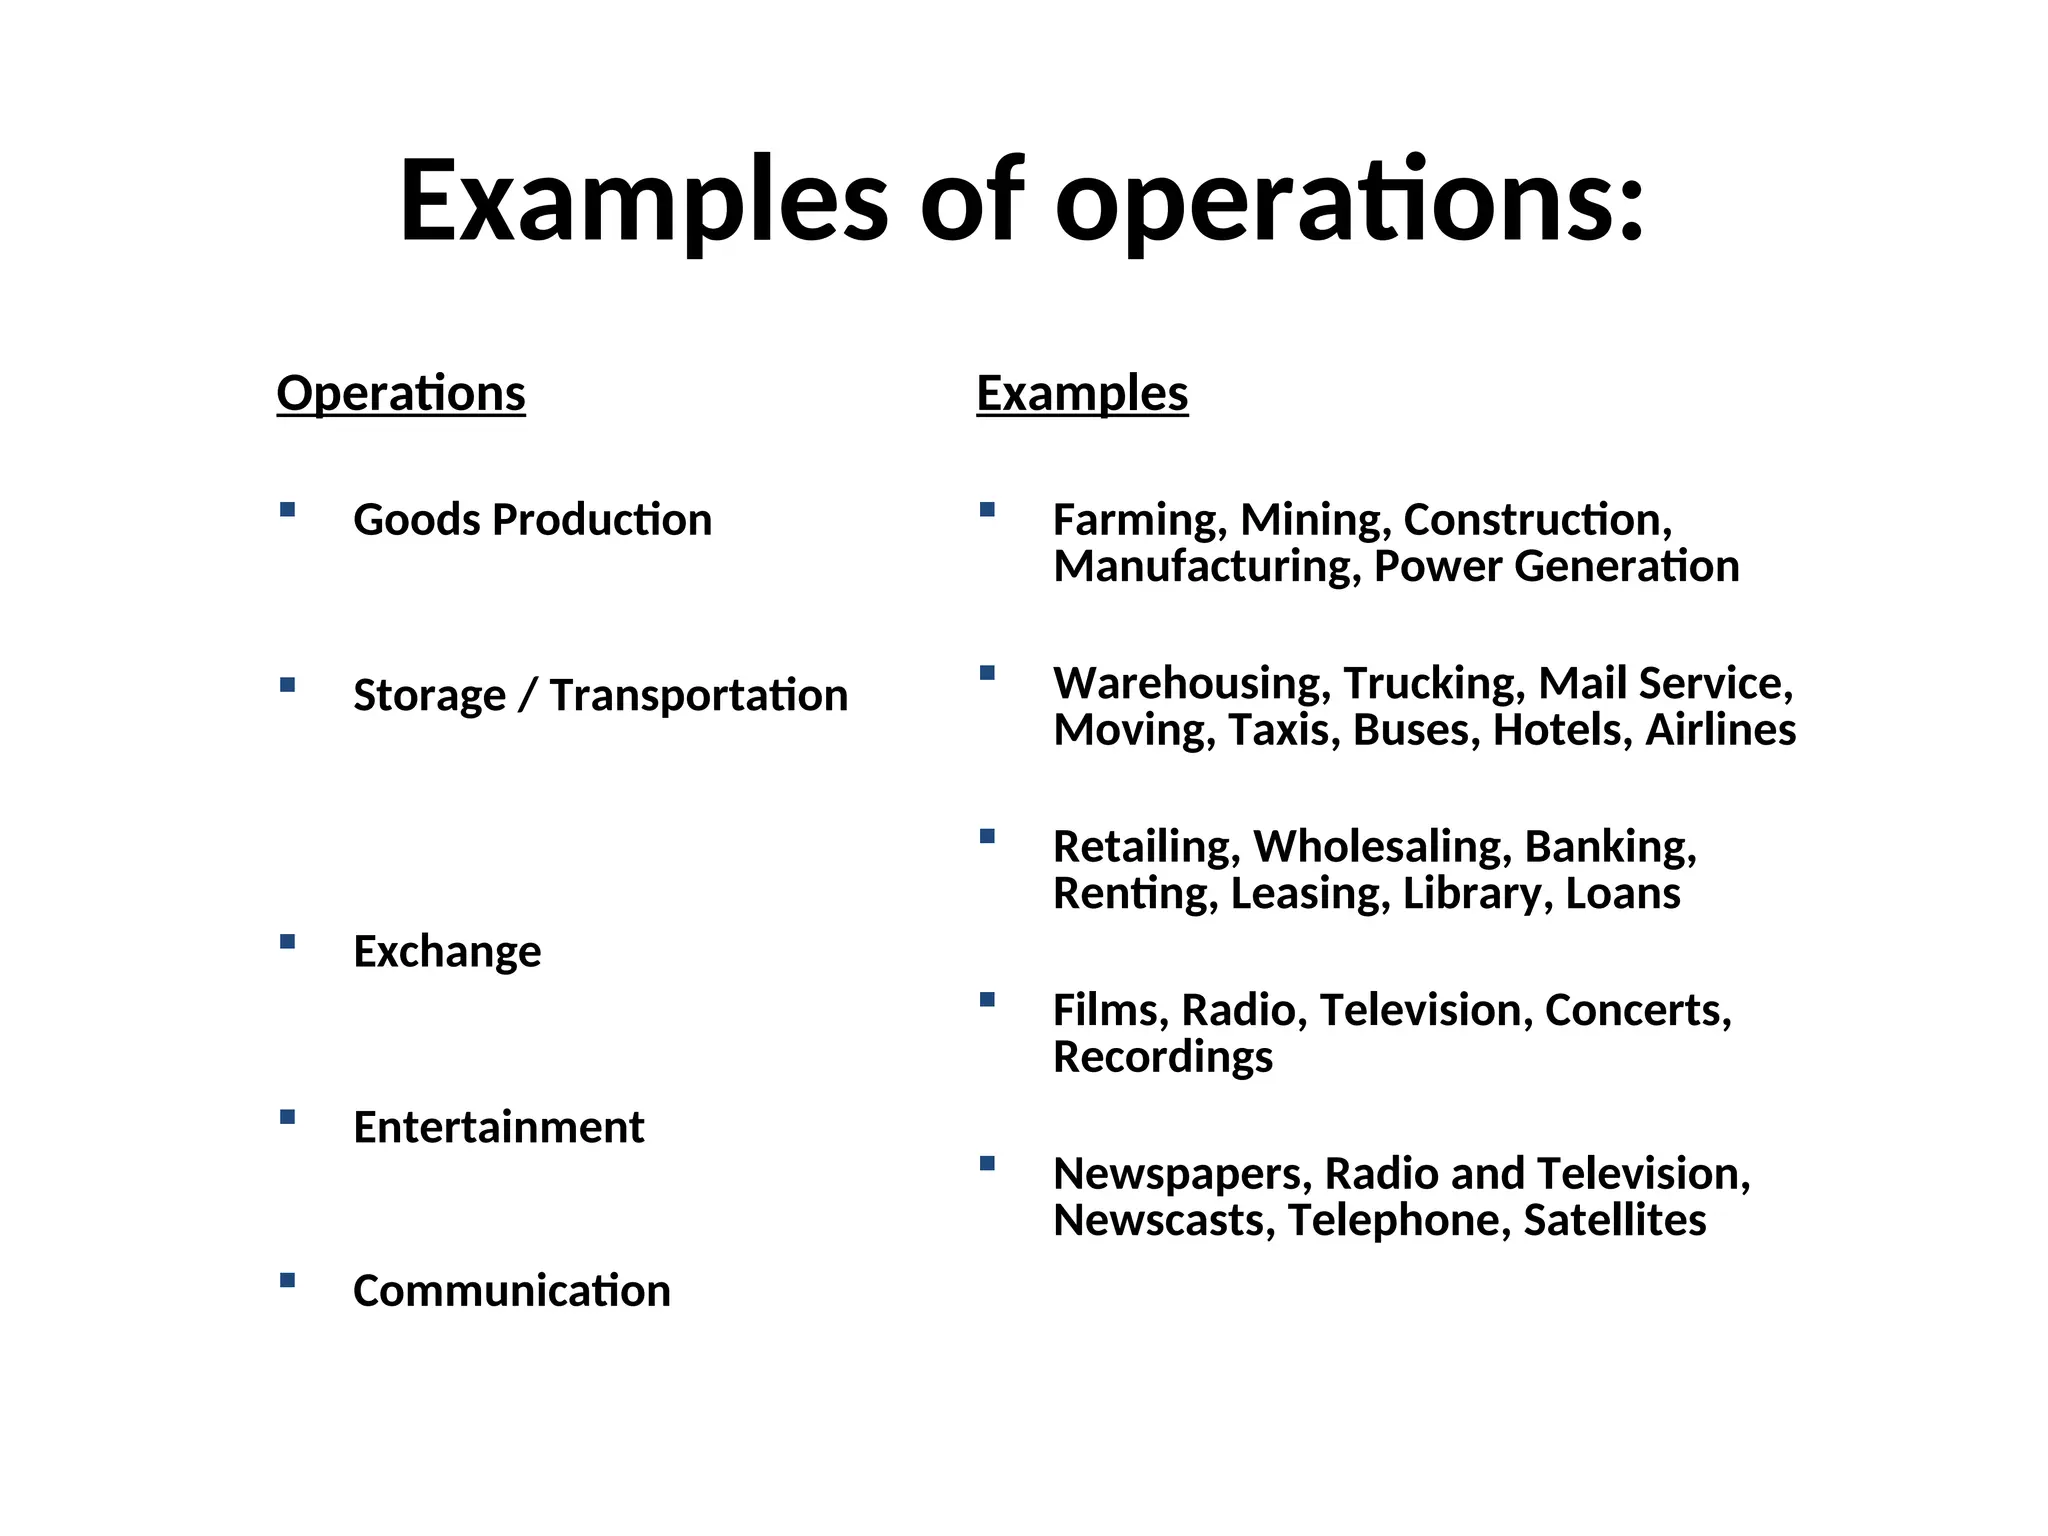
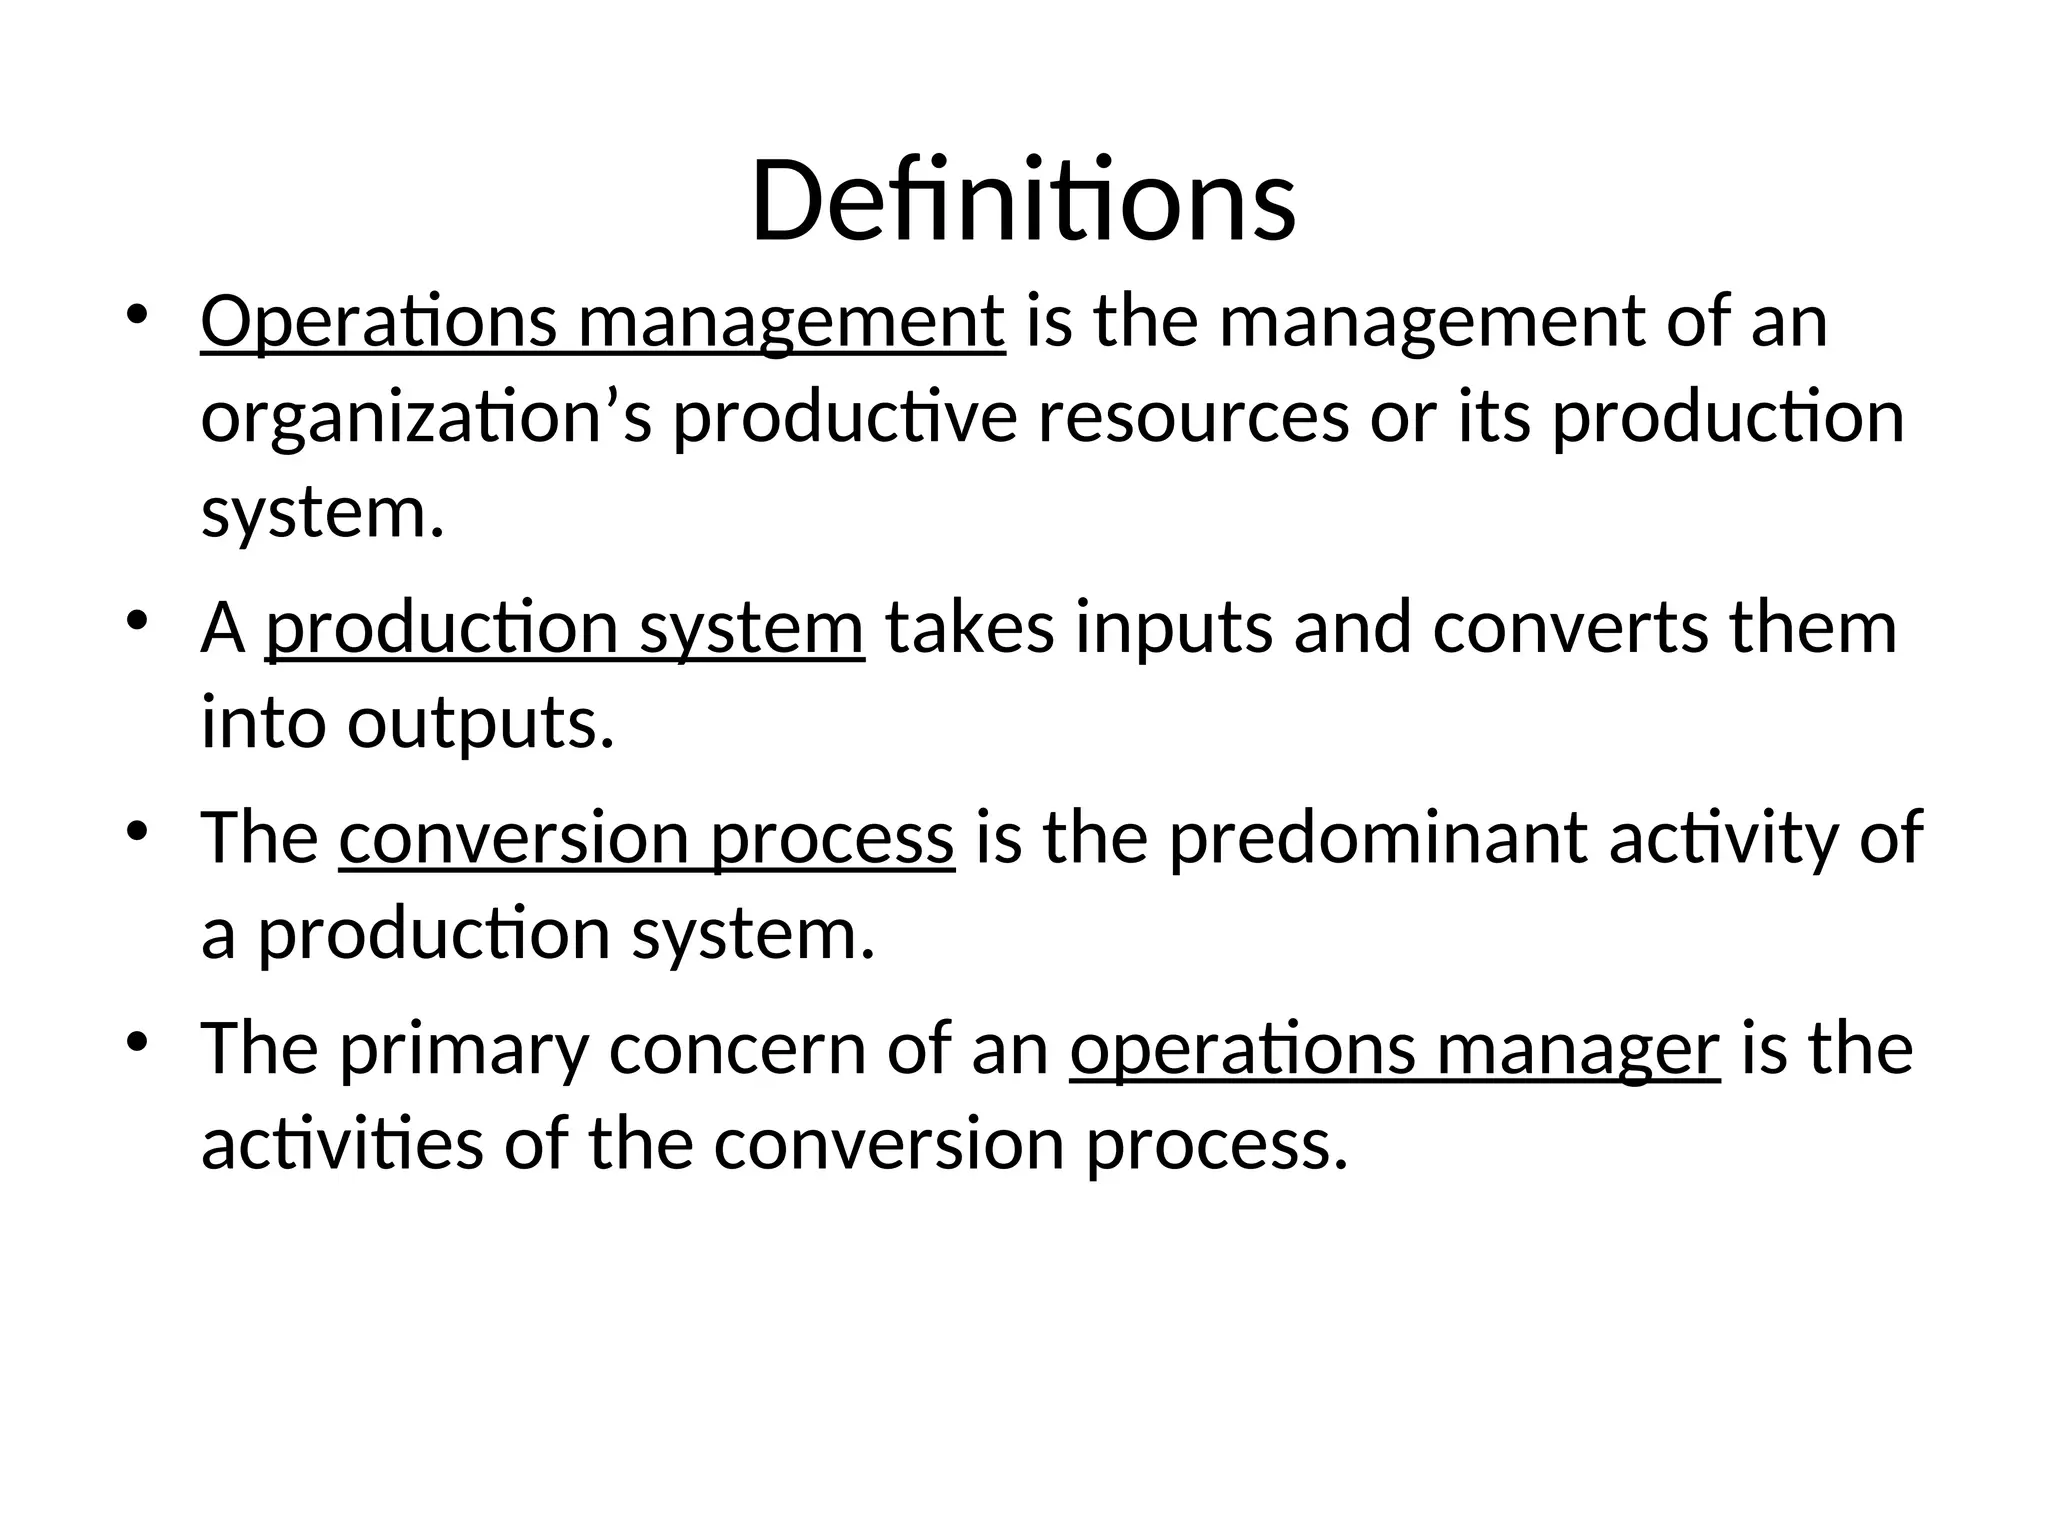
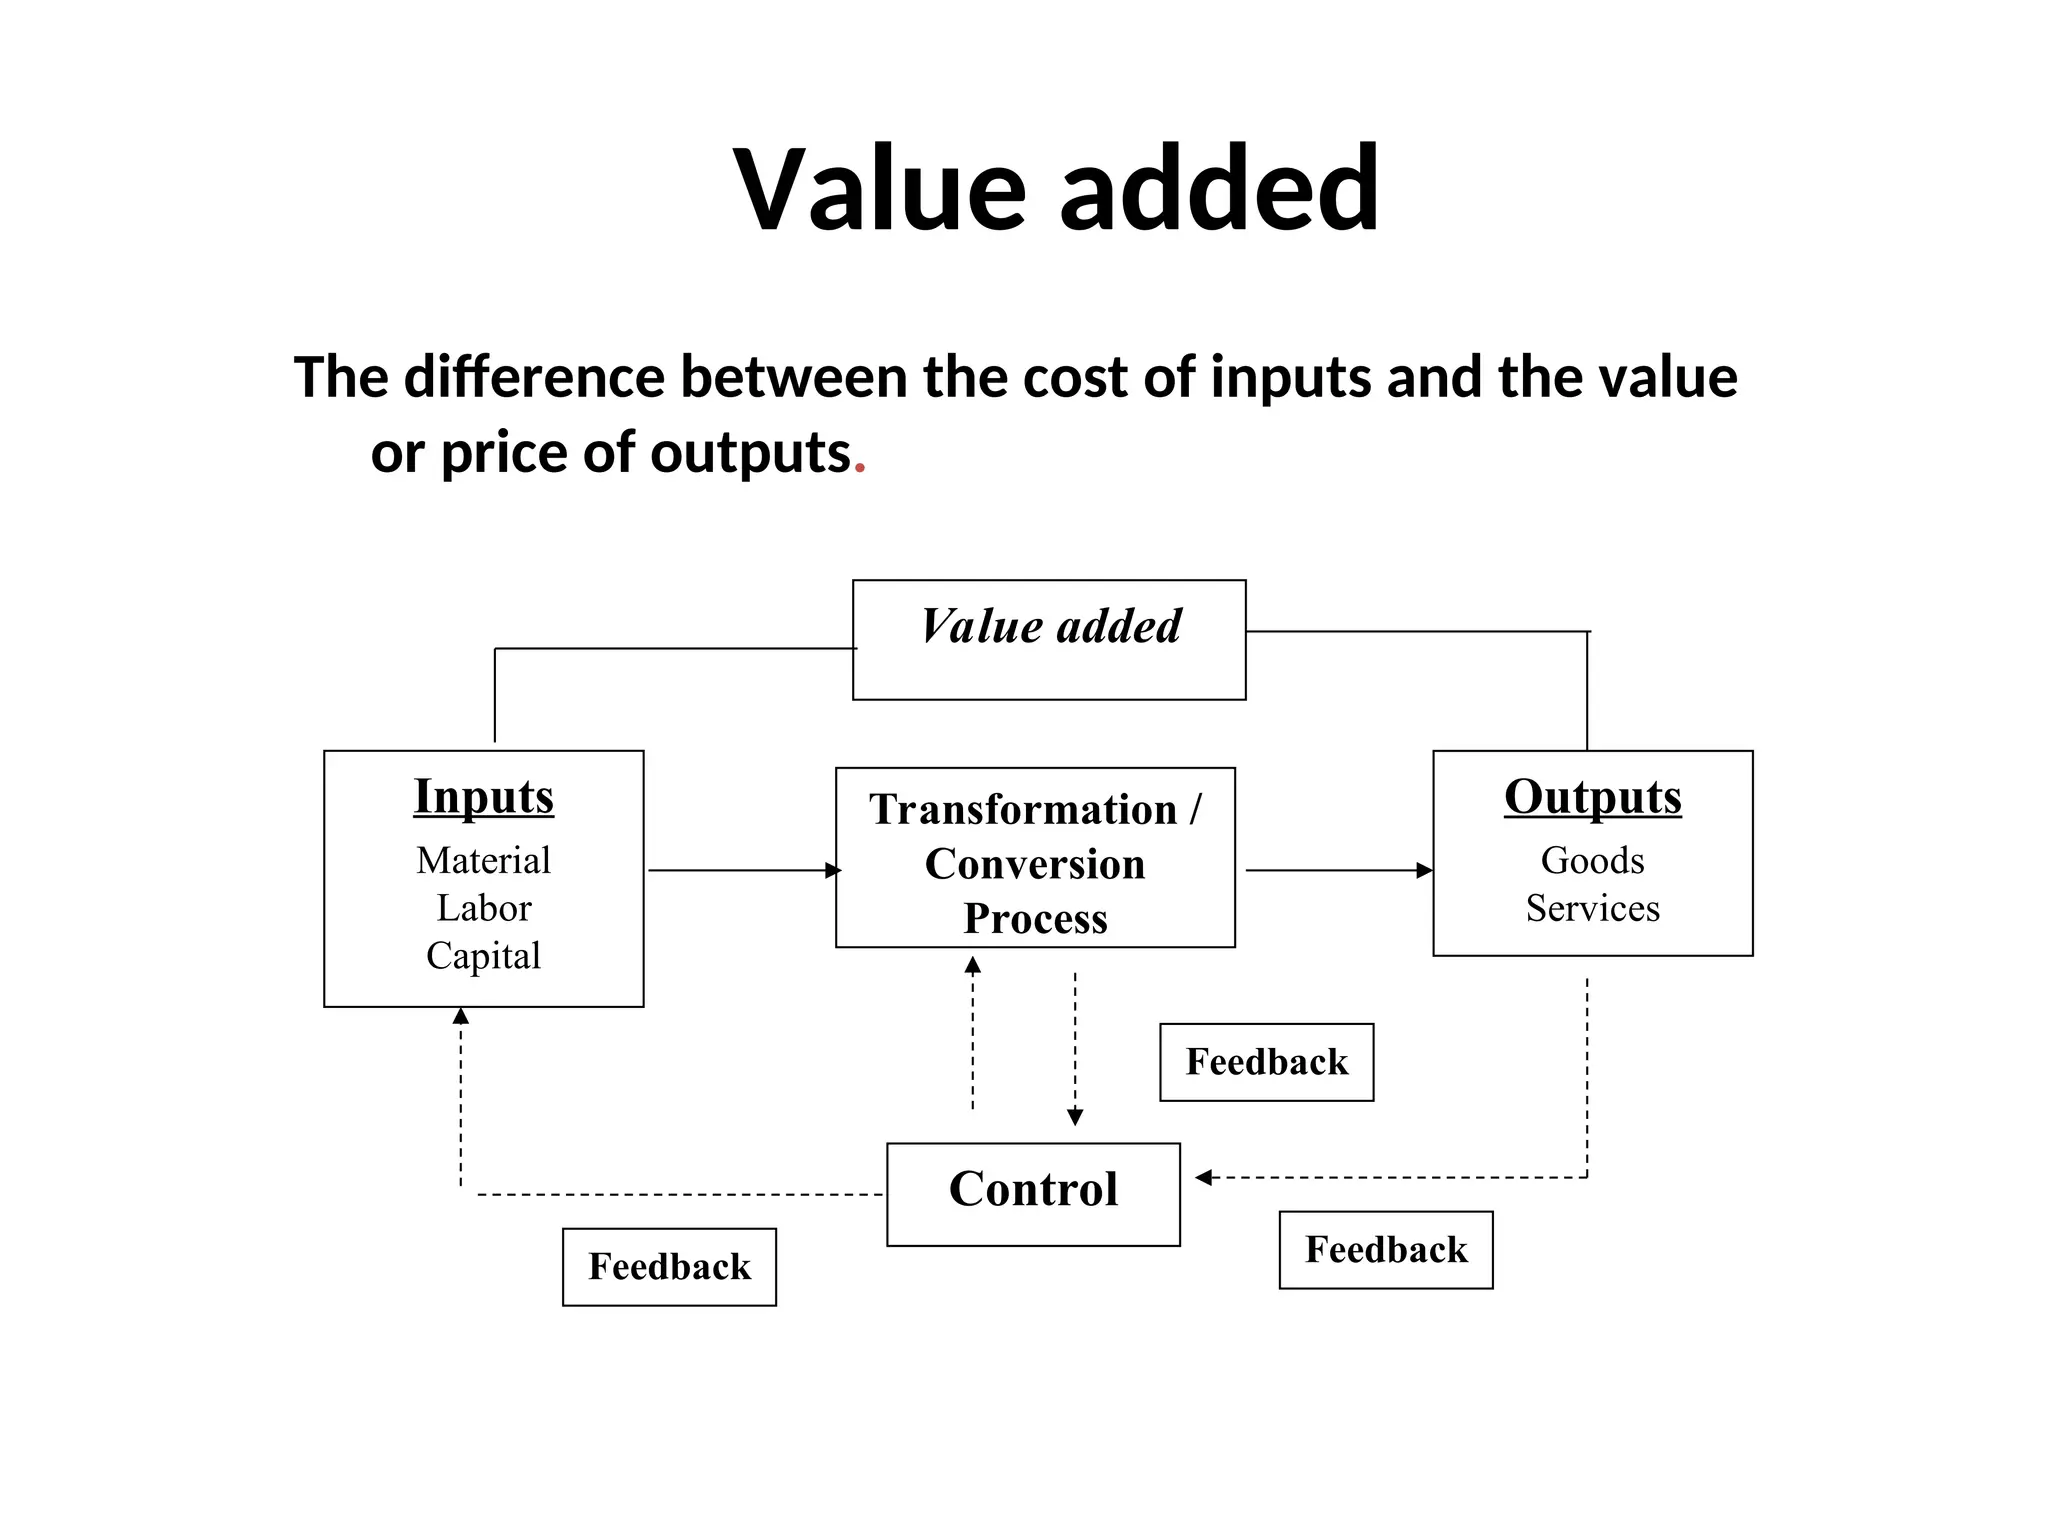
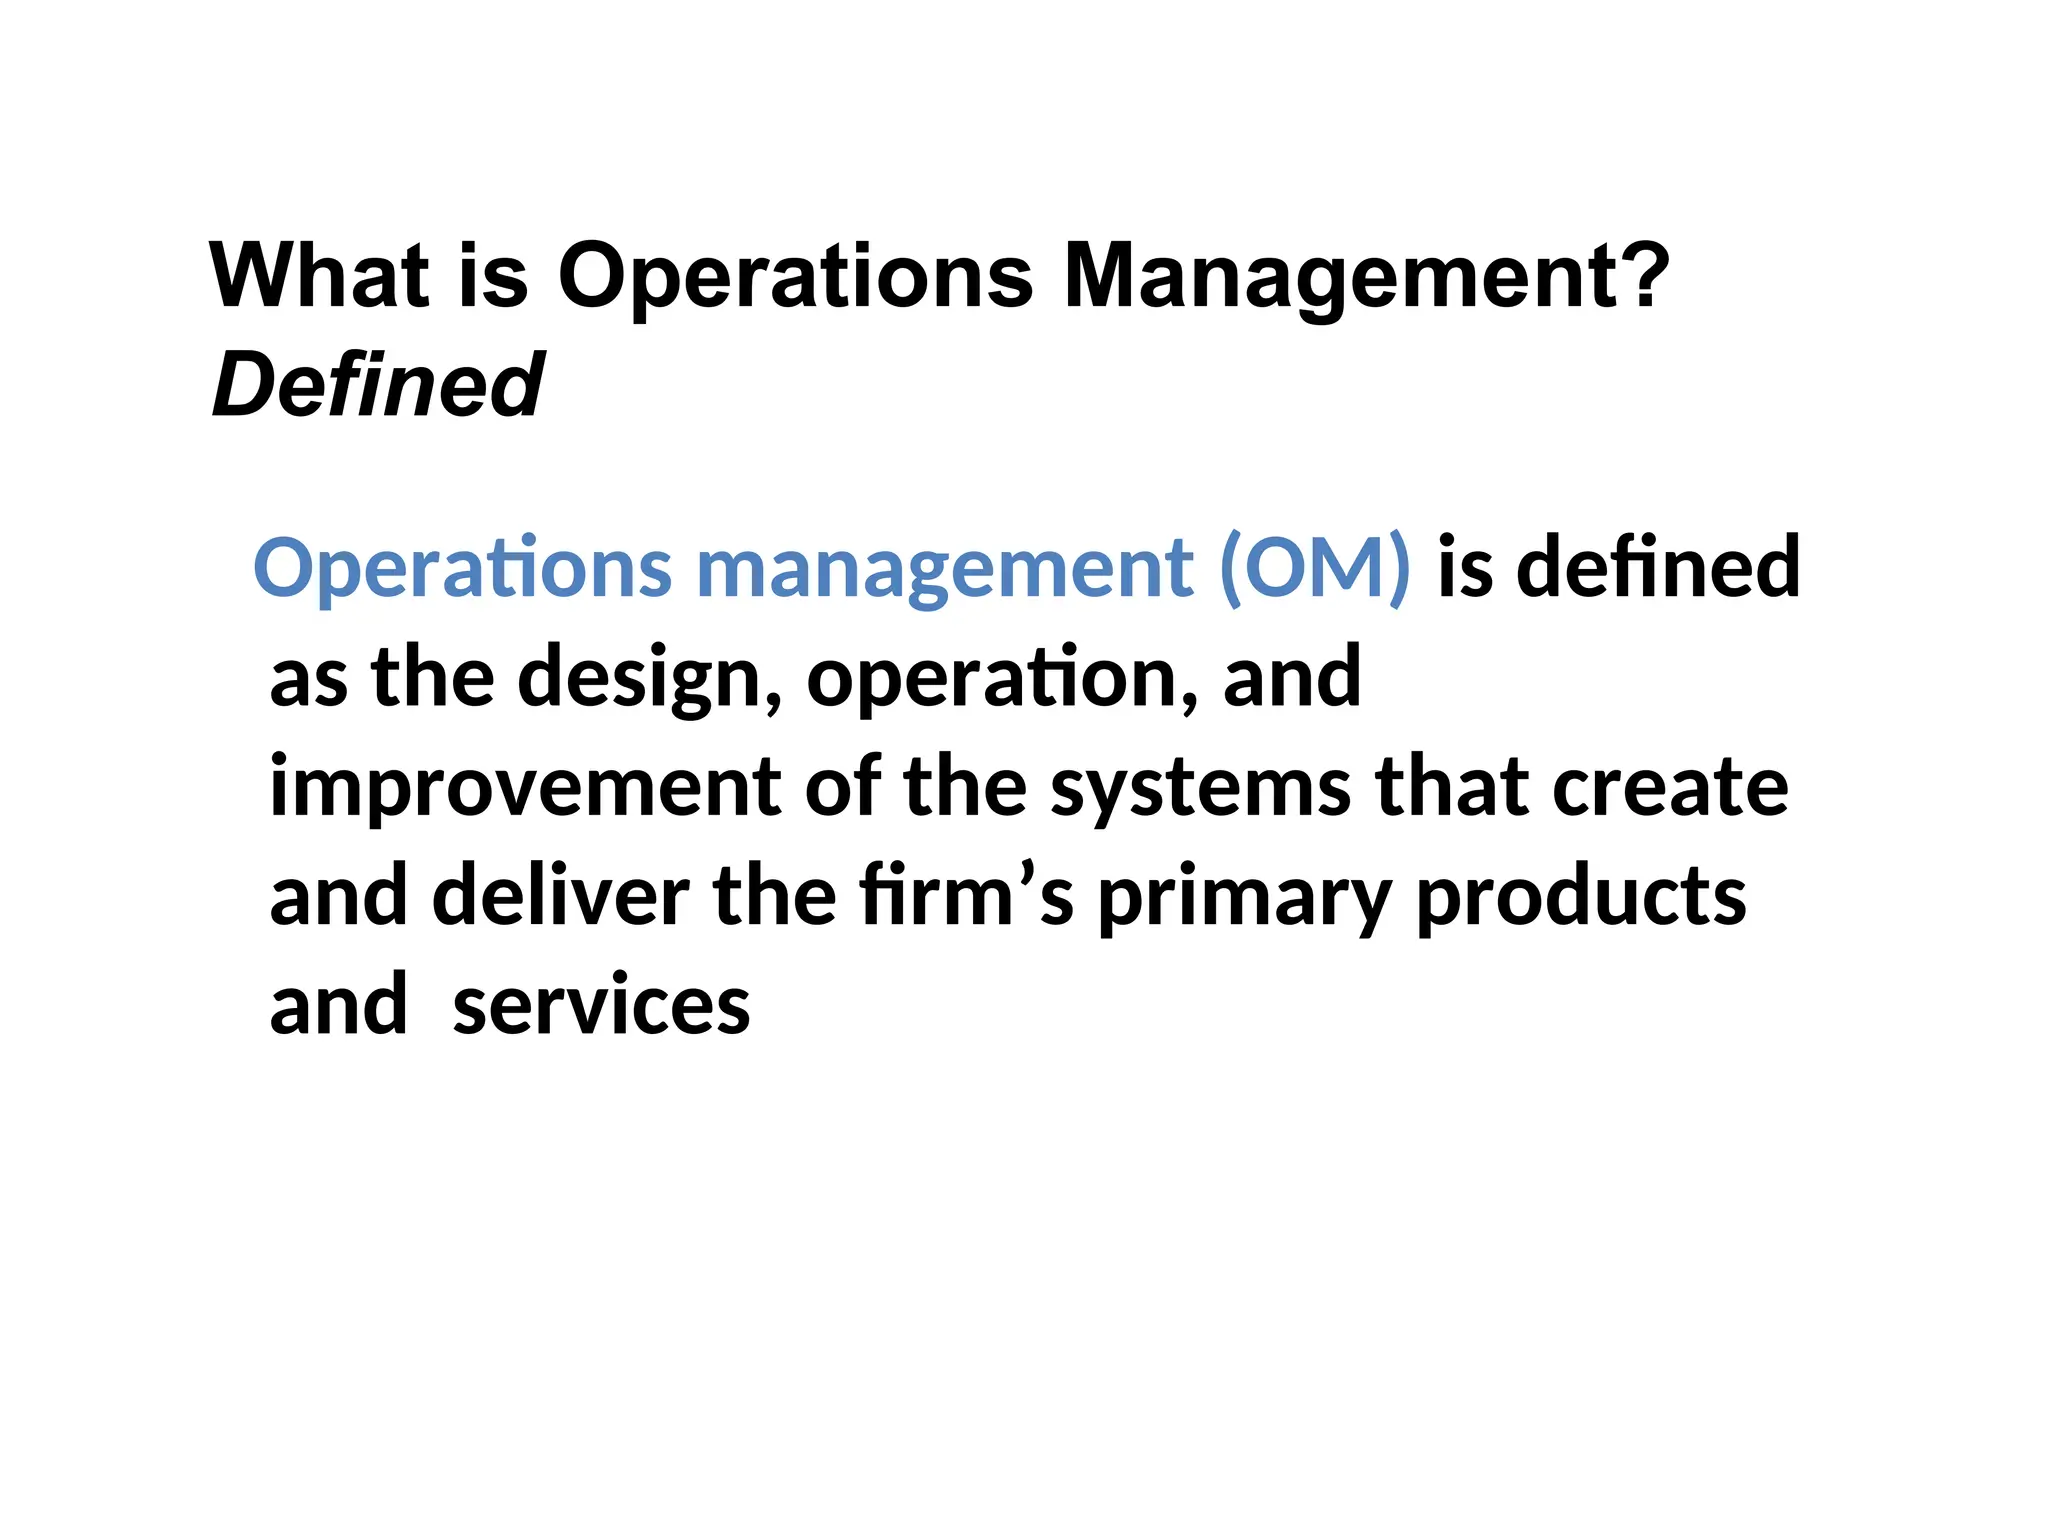
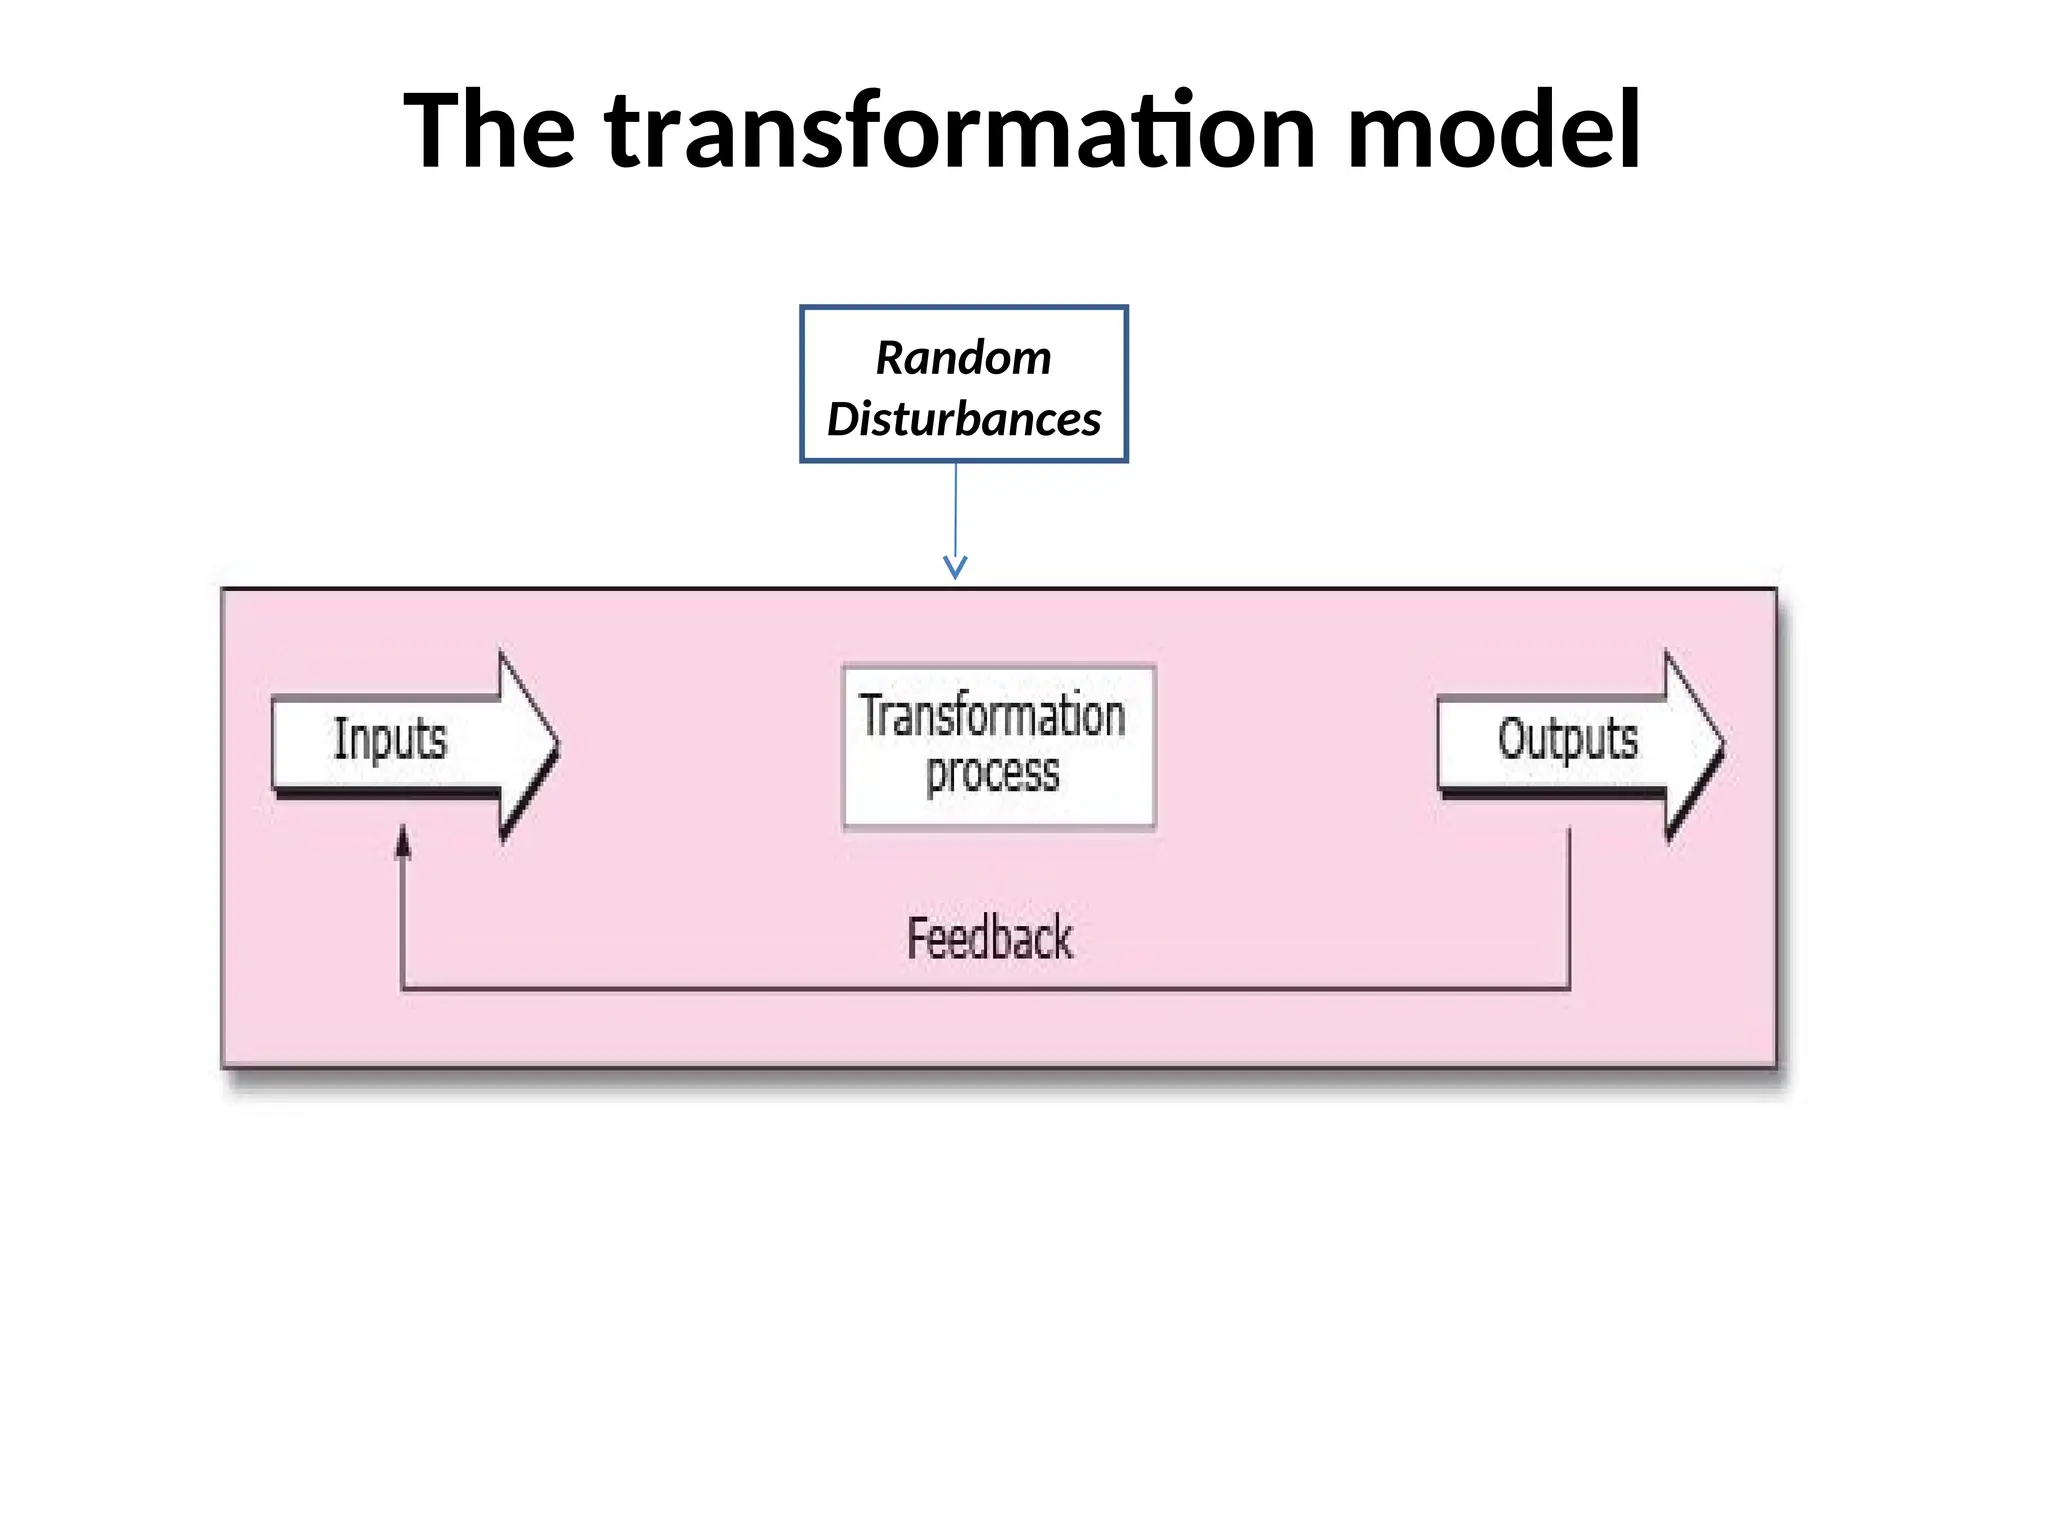

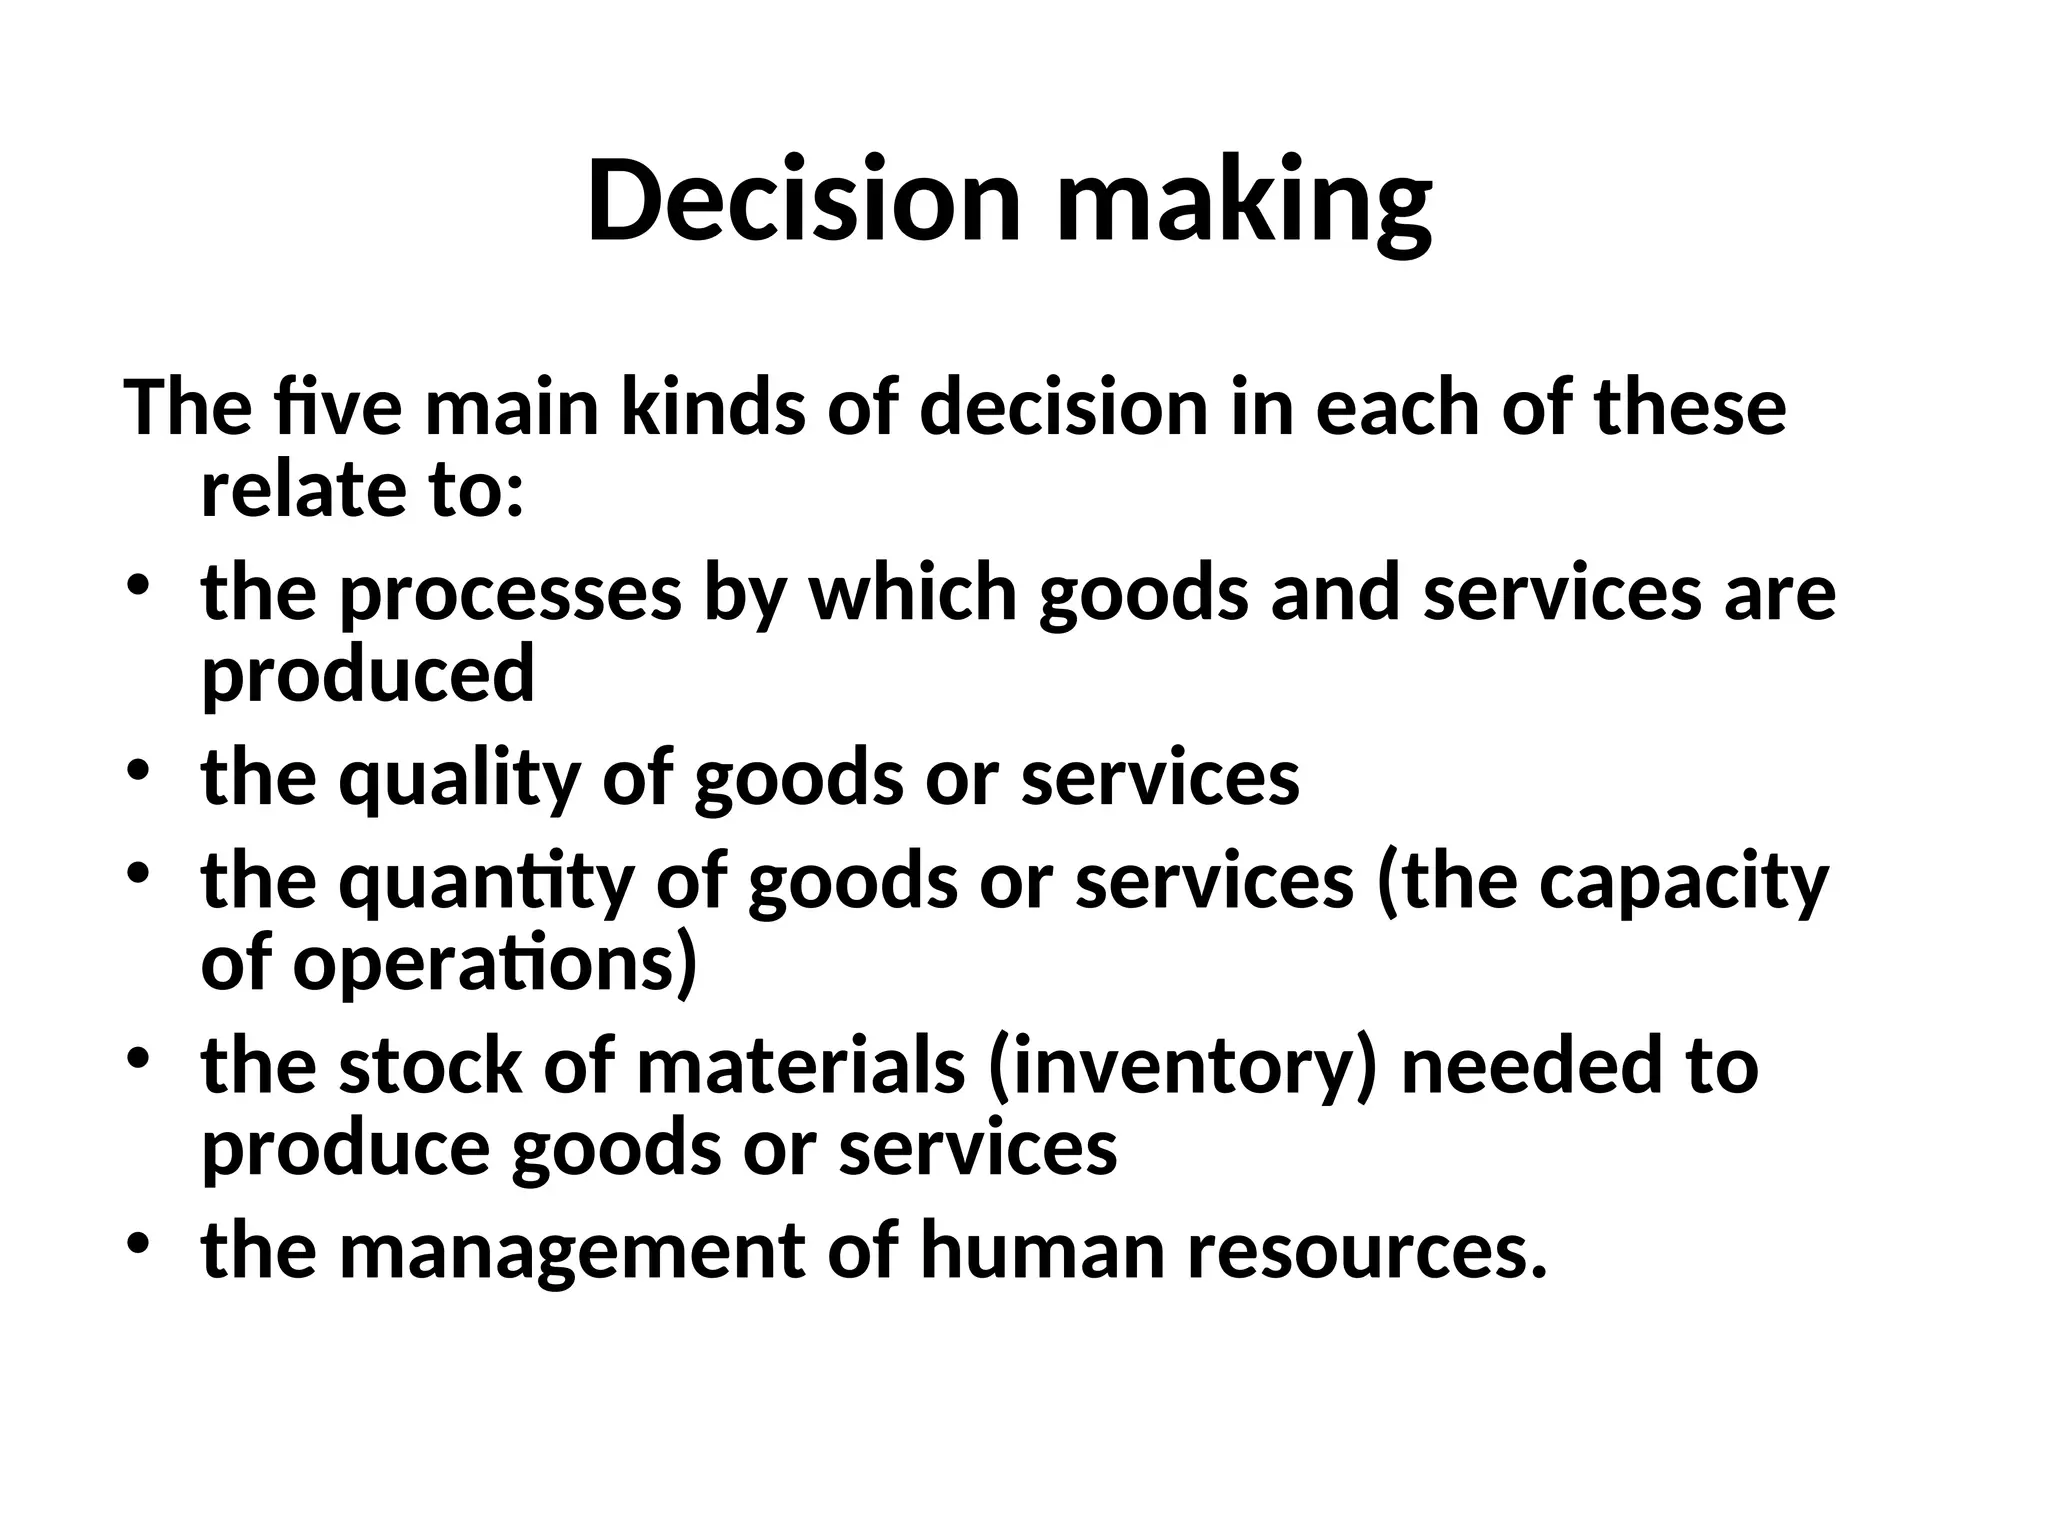

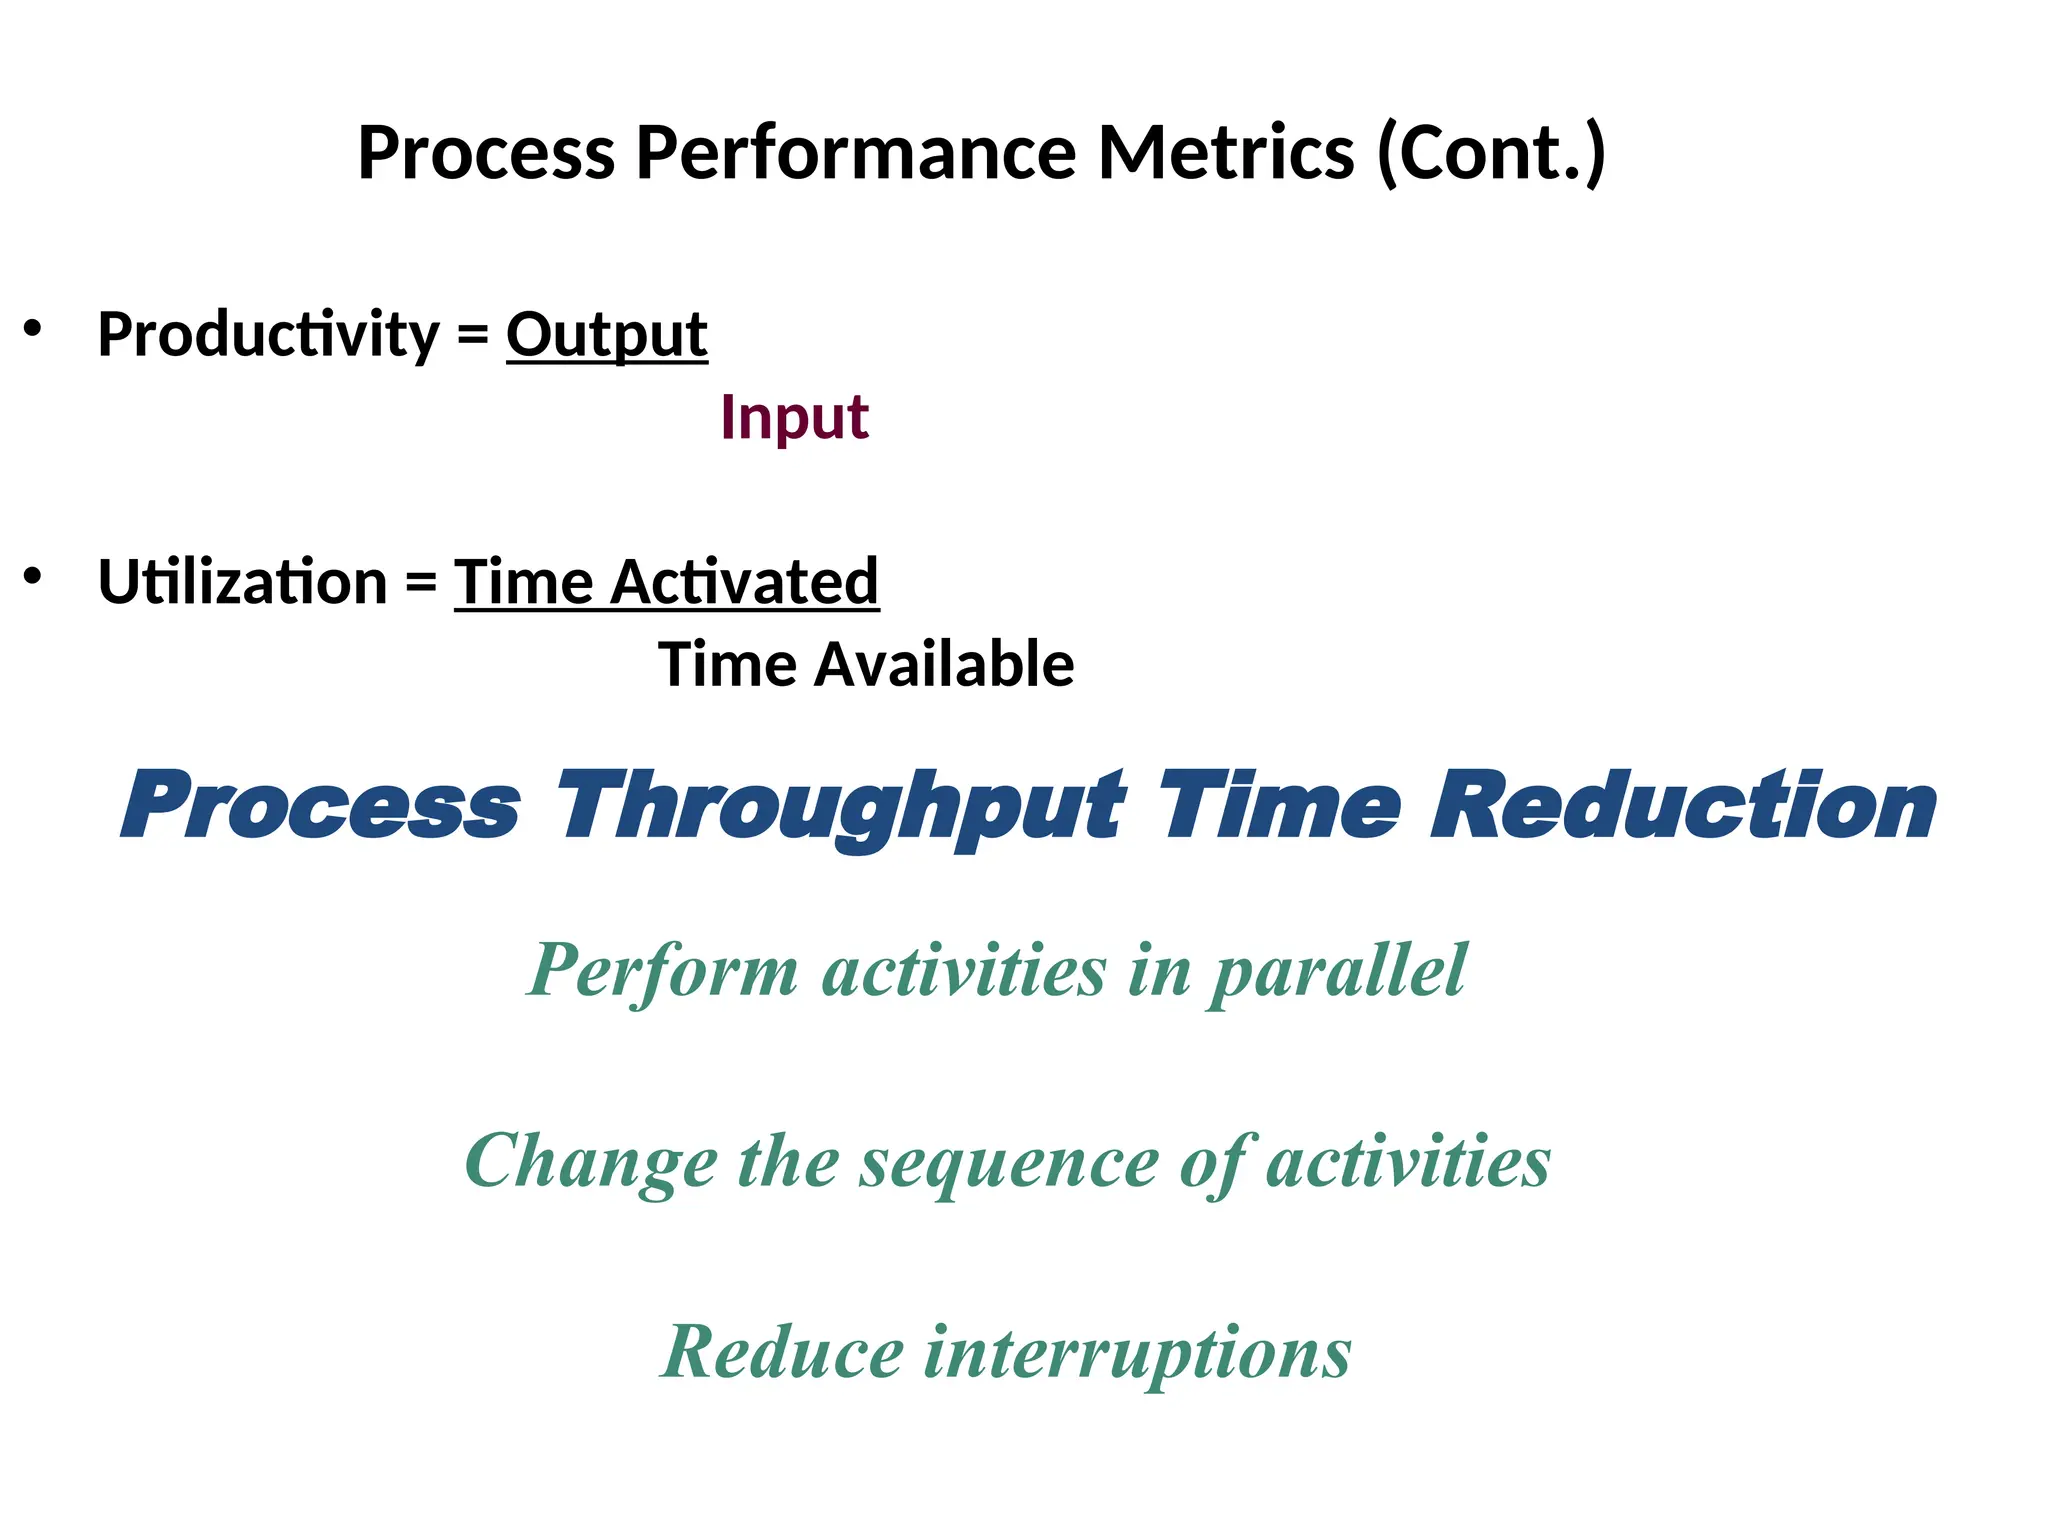
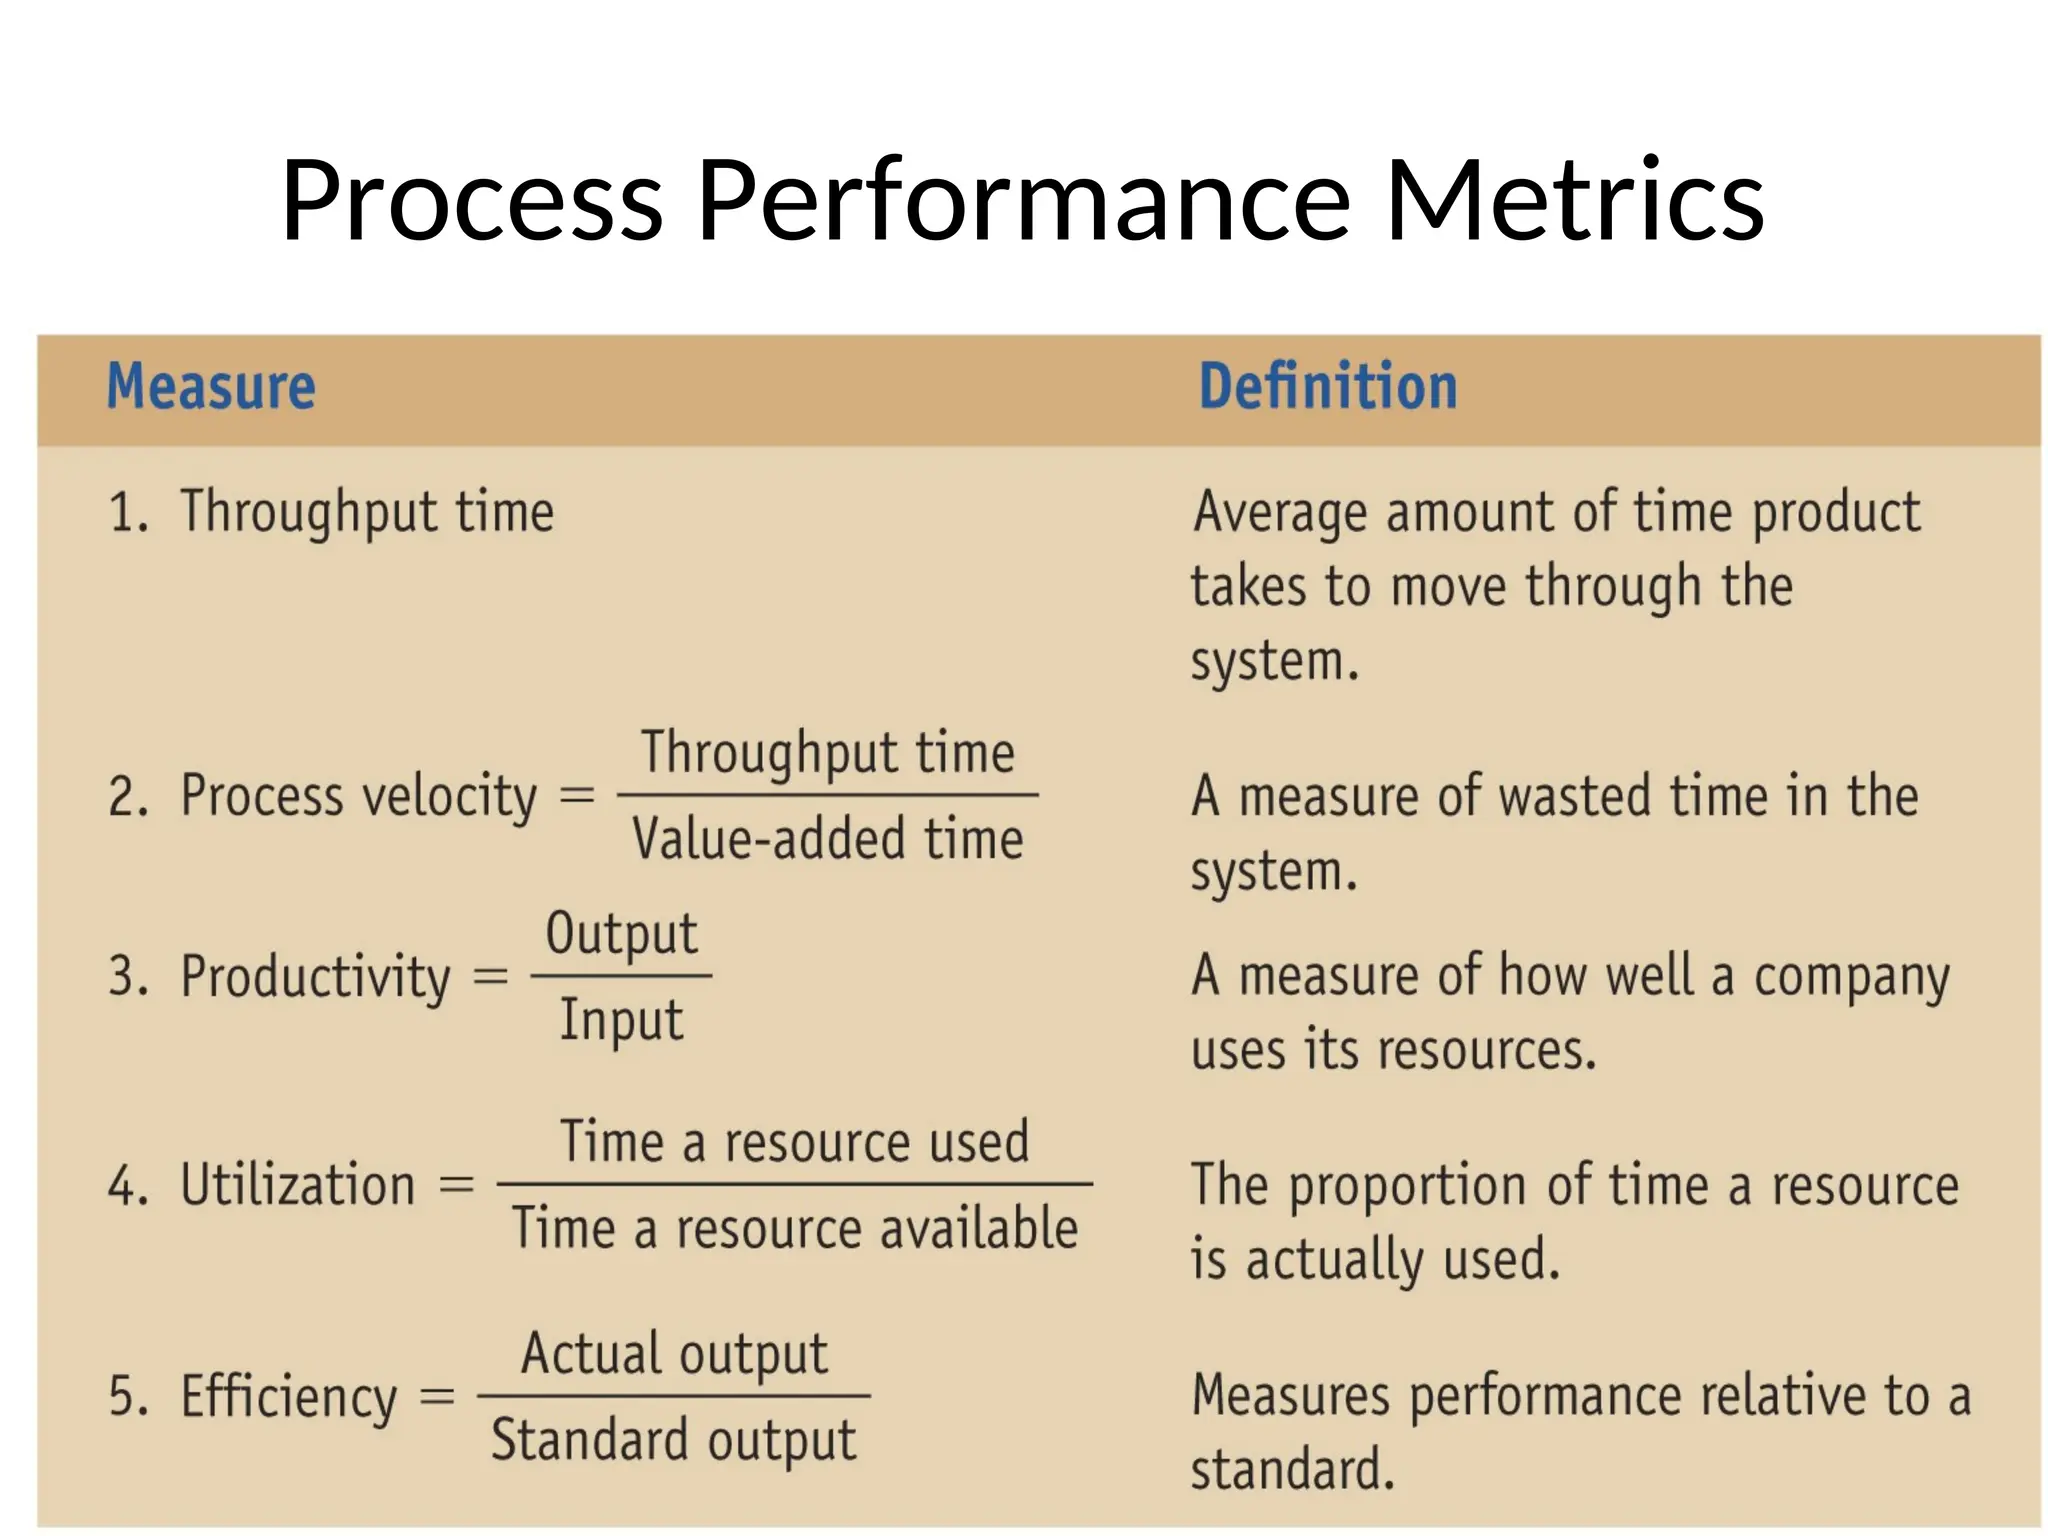

The document outlines the principles of operations management, covering topics such as product and process design, facility planning, capacity planning, production scheduling, materials management, quality management, and inventory control. It defines operations management as the design, operation, and improvement of systems that create and deliver products and services, and discusses historical phases from craft manufacturing to modern approaches like lean production and mass customization. Additionally, it describes the significance of feedback in the transformation process, decision-making in operations, and the role of an operations manager in aligning resources to meet organizational goals.


![4-globalisation-economic-powerpoint-1226575730856277-9[1].ppt](https://cdn.slidesharecdn.com/ss_thumbnails/4-globalisation-economic-powerpoint-1226575730856277-91-250329040731-963da4f5-thumbnail.jpg?width=640&height=640&fit=bounds)


![APQP-PPAP[1].ppt for engineering products](https://cdn.slidesharecdn.com/ss_thumbnails/apqp-ppap1-240406033953-f86cdc8f-thumbnail.jpg?width=640&height=640&fit=bounds)


