Downloaded 1,342 times


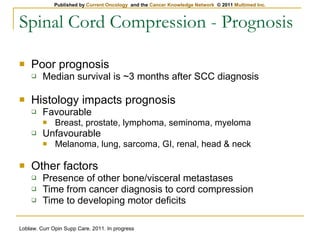


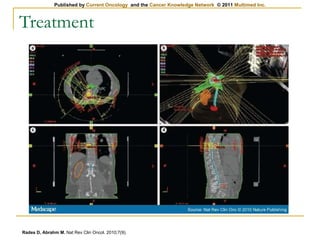


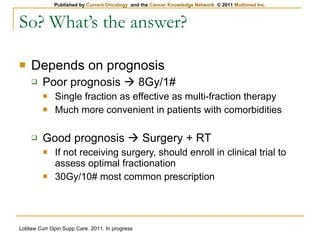


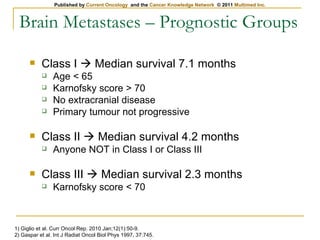


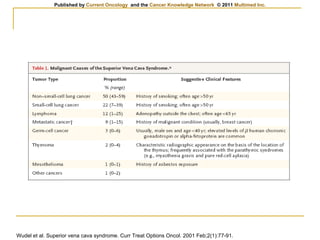
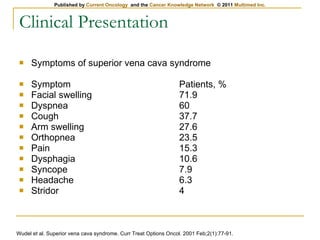


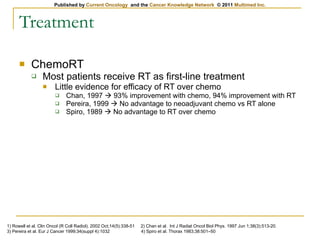


The document provides an overview of oncologic emergencies including spinal cord compression, brain metastases, superior vena cava obstruction, febrile neutropenia, and hypercalcemia. For spinal cord compression, it discusses signs/symptoms, workup with MRI, treatment with corticosteroids and radiotherapy, and prognosis. It notes surgery plus radiotherapy is better than radiotherapy alone based on the Patchell 2005 study. For brain metastases, it outlines presentation, workup with imaging, treatment with steroids, radiotherapy, and stereotactic radiosurgery based on studies showing better outcomes than whole brain radiotherapy alone.


