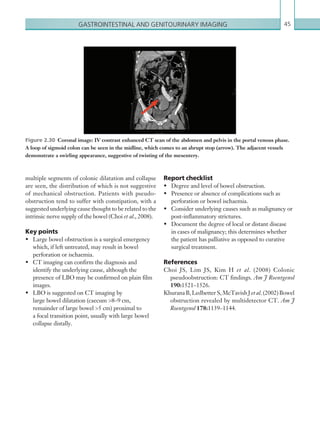
This document provides an overview of the book "On Call Radiology" which presents case discussions on common clinical emergencies and their corresponding imaging findings encountered on-call. The book combines a case-based discussion format with practical advice on imaging decision making in the acute setting and guidance on radiology report writing. It discusses various conditions organized by body system including thoracic, gastrointestinal, genitourinary, neurological and trauma imaging. Each case includes a clinical history, imaging examples, diagnosis and basic management discussion.


![CRC Press
Taylor & Francis Group
6000 Broken Sound Parkway NW, Suite 300
Boca Raton, FL 33487-2742
© 2016 by Taylor & Francis Group, LLC
CRC Press is an imprint of Taylor & Francis Group, an Informa business
No claim to original U.S. Government works
Version Date: 20150514
International Standard Book Number-13: 978-1-4822-2168-8 (eBook - PDF)
This book contains information obtained from authentic and highly regarded sources. While all reasonable efforts have
been made to publish reliable data and information, neither the author[s] nor the publisher can accept any legal respon-
sibility or liability for any errors or omissions that may be made. The publishers wish to make clear that any views or
opinions expressed in this book by individual editors, authors or contributors are personal to them and do not neces-
sarily reflect the views/opinions of the publishers. The information or guidance contained in this book is intended for
use by medical, scientific or health-care professionals and is provided strictly as a supplement to the medical or other
professional’s own judgement, their knowledge of the patient’s medical history, relevant manufacturer’s instructions and
the appropriate best practice guidelines. Because of the rapid advances in medical science, any information or advice on
dosages, procedures or diagnoses should be independently verified. The reader is strongly urged to consult the relevant
national drug formulary and the drug companies’ and device or material manufacturers’ printed instructions, and their
websites, before administering or utilizing any of the drugs, devices or materials mentioned in this book. This book
does not indicate whether a particular treatment is appropriate or suitable for a particular individual. Ultimately it is
the sole responsibility of the medical professional to make his or her own professional judgements, so as to advise and
treat patients appropriately. The authors and publishers have also attempted to trace the copyright holders of all mate-
rial reproduced in this publication and apologize to copyright holders if permission to publish in this form has not been
obtained. If any copyright material has not been acknowledged please write and let us know so we may rectify in any
future reprint.
Except as permitted under U.S. Copyright Law, no part of this book may be reprinted, reproduced, transmitted, or uti-
lized in any form by any electronic, mechanical, or other means, now known or hereafter invented, including photocopy-
ing, microfilming, and recording, or in any information storage or retrieval system, without written permission from the
publishers.
For permission to photocopy or use material electronically from this work, please access www.copyright.com (http://
www.copyright.com/) or contact the Copyright Clearance Center, Inc. (CCC), 222 Rosewood Drive, Danvers, MA 01923,
978-750-8400. CCC is a not-for-profit organization that provides licenses and registration for a variety of users. For
organizations that have been granted a photocopy license by the CCC, a separate system of payment has been arranged.
Trademark Notice: Product or corporate names may be trademarks or registered trademarks, and are used only for
identification and explanation without intent to infringe.
Visit the Taylor & Francis Web site at
http://www.taylorandfrancis.com
and the CRC Press Web site at
http://www.crcpress.com](https://image.slidesharecdn.com/oncallradiology-180422160240/85/On-call-radiology-6-320.jpg)


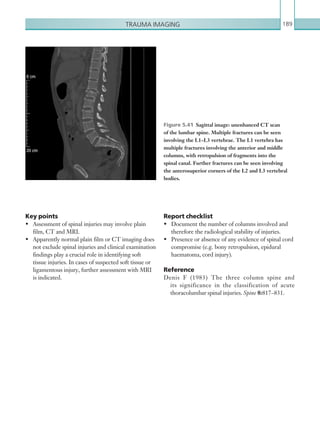
![Chapter 286
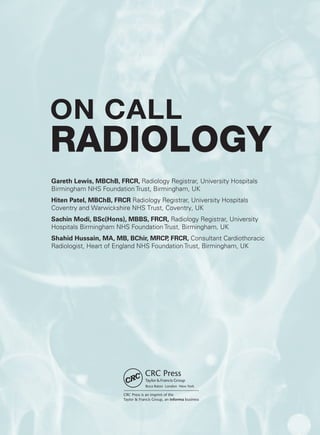
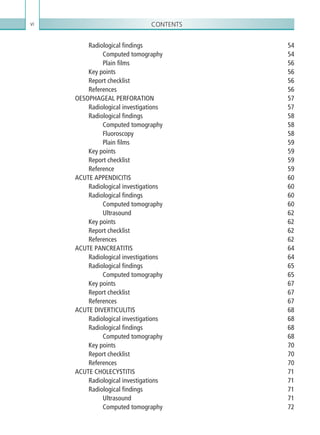
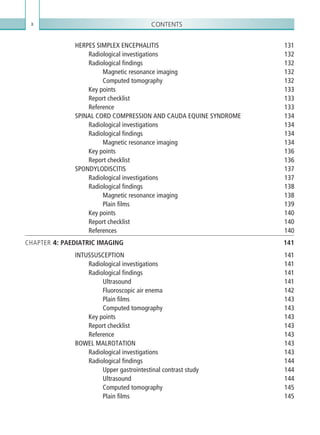
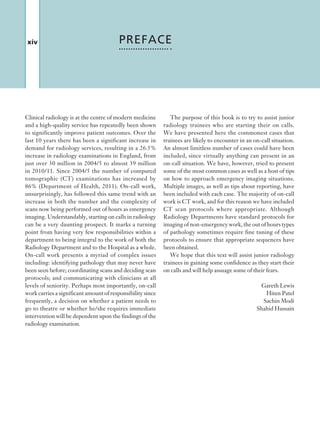
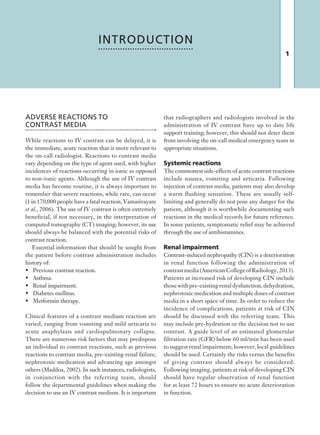
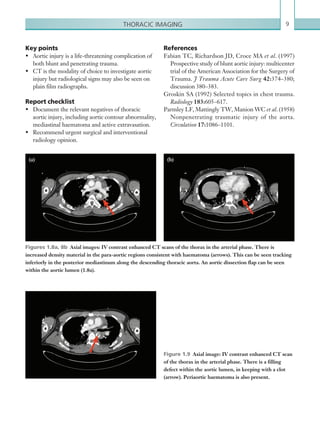
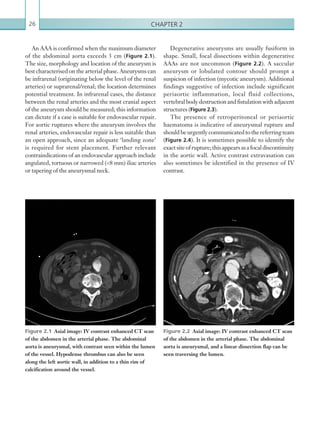
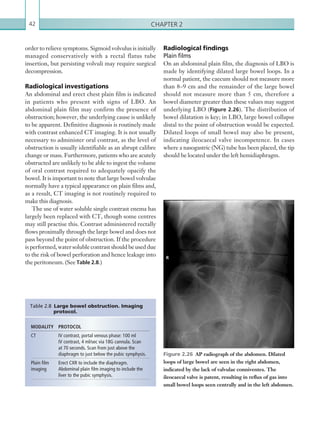
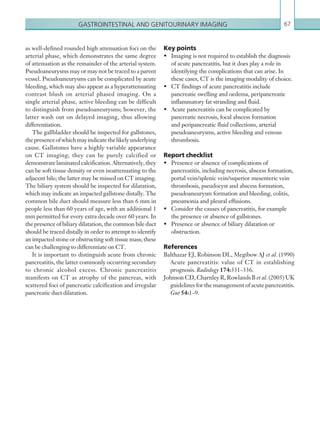
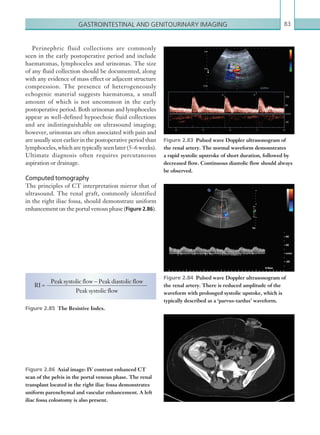
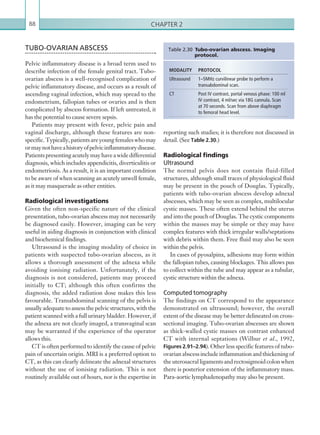
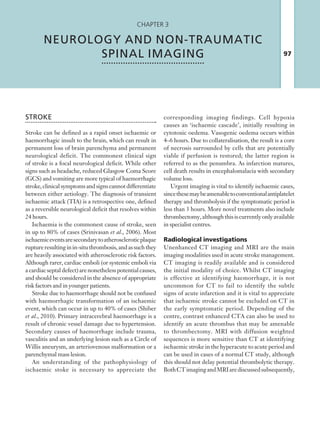
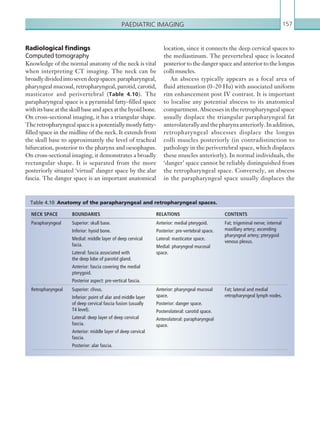
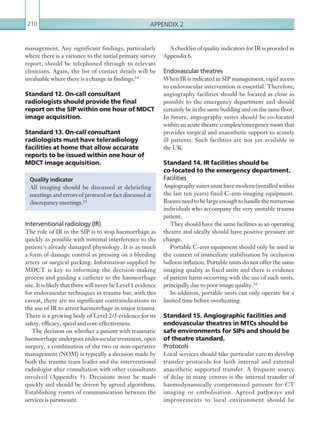
narrowing. Similarly, an increase in the peak systolic
velocity may also be observed. Severely stenotic arteries
mayeventuallythromboseandshownoflow.Pulse-wave
Doppler classically shows a ‘parvus-tardus’ waveform in
stenosed vessels (i.e. increased peak systolic acceleration
time [0.08 sec] with a slow deceleration) (Figure 2.89).
The RI is a measure of the resistance to blood flow
and can also be a useful tool in the assessment of the
post-transplantliver(see Figure 2.85,p.83).NormalRI
values range between 0.5 and 0.8. In the postoperative
period, RI values may be elevated for several days, but
they should generally reduce to normal limits. Elevated
RI values may be a sign of organ rejection or venous
outflow obstruction.
Portal vein abnormalities are relatively rare. The
commonest complications include portal vein stenosis
and thrombosis. The normal portal vein is anechoic
with thin, regular walls and uniform calibre. Acute
thrombus within the portal vein may present as
echogenic material within the lumen of the vessel with
reduced or no flow on colour Doppler.
Complications involving the IVC are uncommon
but include thrombosis and IVC stenosis at the
anastomotic site. Clinical features are those of Budd–
Chiarisyndromeandincludehepatomegaly,ascitesand
pleural effusions, which may be seen on ultrasound.
Biliary complications are relatively common
following transplant and include leaks and stricture
non-specific, but may be seen as a heterogeneous
echotexture. In cases of rejection, there are often no
correlatingfeatureswithDopplerstudies.Liverinfarcts
occurmostcommonlyintheearlypostoperativeperiod,
and present as focal, wedge-shaped areas of decreased
echogenicity. Abnormal Doppler waveforms may be
recorded in cases of infarction.
Hepatic artery complications account for the largest
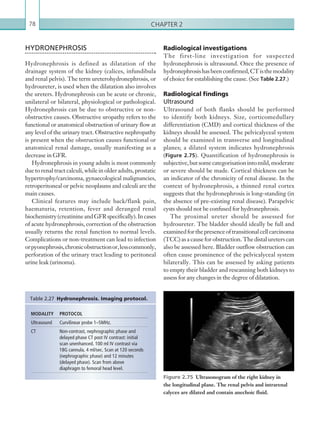
proportion of vascular complications, which include
thrombosis and stenosis. Hepatic artery thrombosis is
a surgical emergency due to the high risk of ischaemia
and infarction to the transplant. In addition to this,
the bile ducts receive their blood supply solely from
the hepatic artery, and so thrombosis of the vessel may
lead to biliary duct ischaemia and stricture formation.
An appreciation of the normal hepatic artery flow and
waveform is useful in order to identify abnormalities.
The normal hepatic artery demonstrates a pulsatile
waveformwitharapidsystolicupstrokeandcontinuous
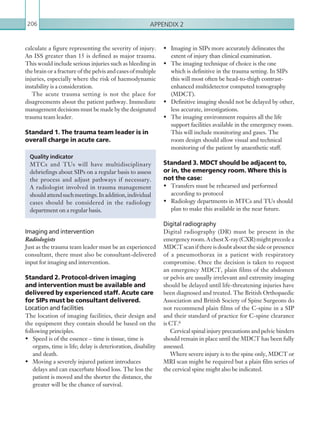
diastolic blood flow (Figure 2.88).
Absent flow within the hepatic artery with colour
and pulse-wave Doppler imaging allows for correct
diagnosisofhepaticarterythrombosisinthemajorityof
cases. Assessment should be made of the extrahepatic,
intrahepatic and right and left branches of the artery.
Hepatic artery stenosis tends to occur at the site of
the anastomosis. Colour flow may demonstrate post-
stenotic turbulent flow depending on the degree of
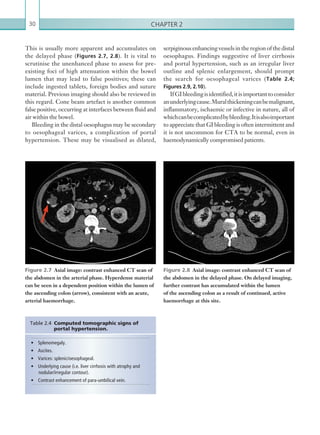
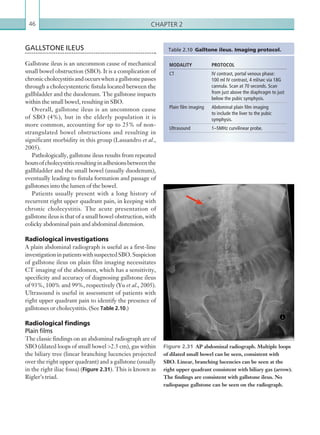
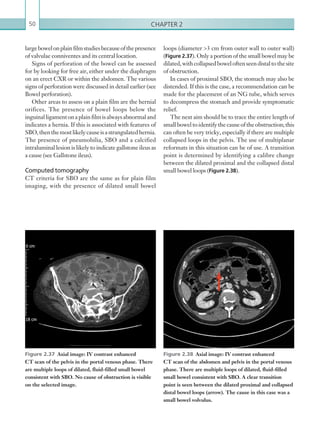
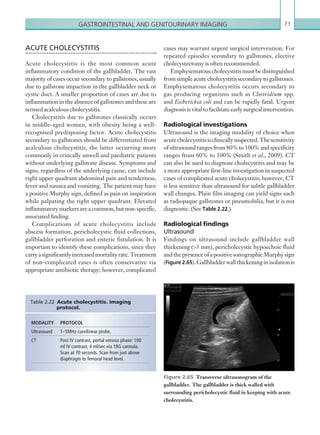
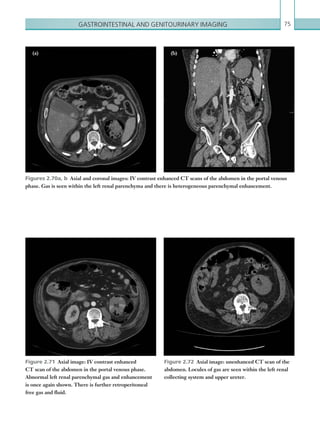
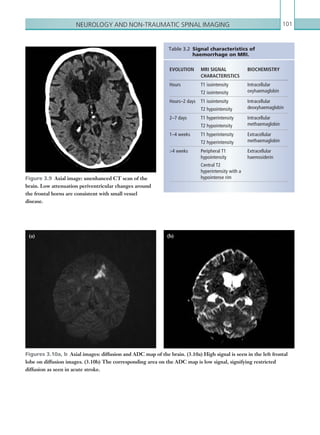
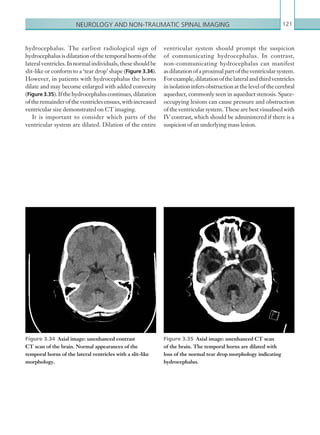
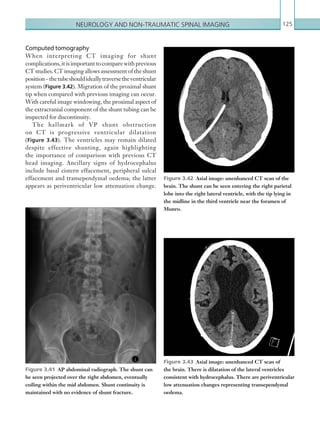
Figure 2.88 Doppler ultrasonogram of the hepatic
artery. The waveform demonstrates a sharp systolic
upstroke and short deceleration time with continuous
diastolic flow. Measurements have been made
documenting the peak systolic and end diastolic values
with the calculated Resistive Index of 0.63.
Figure 2.89 Doppler ultrasonogram of a stenotic
hepatic artery. The deceleration time of the waveform is
prolonged resulting in a ‘parvus-tardus’ waveform.
K22247_C002.indd 86 16/05/15 3:07 AM](https://image.slidesharecdn.com/oncallradiology-180422160240/85/On-call-radiology-108-320.jpg)

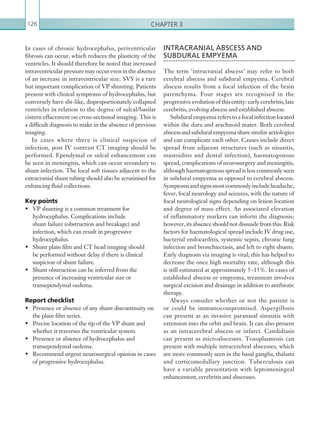


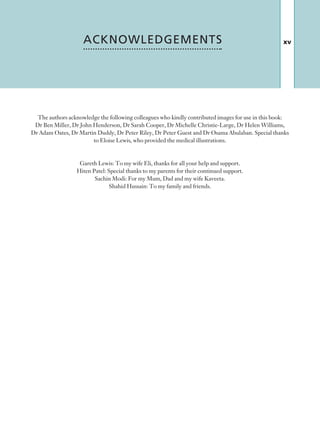
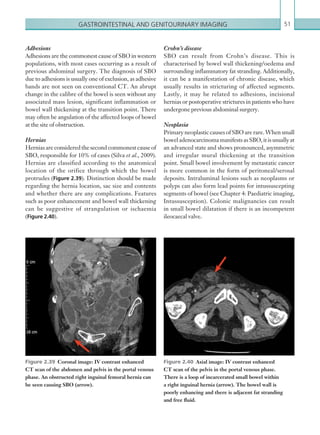
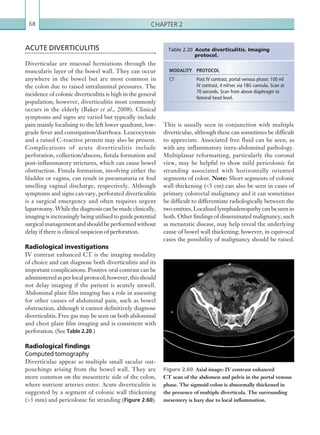
![203
Appendix 1
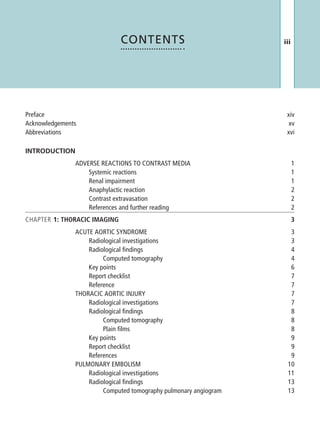
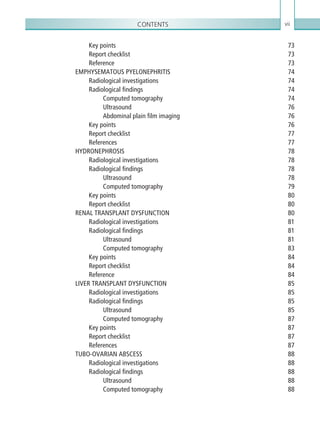
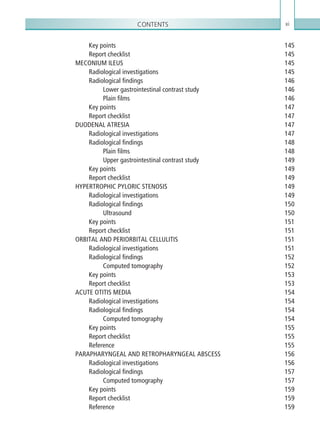
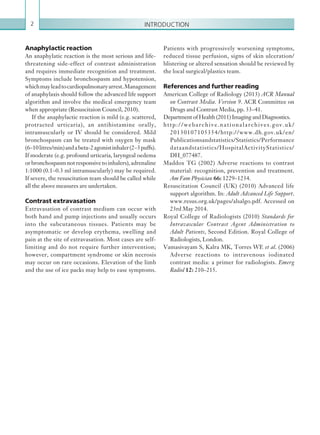
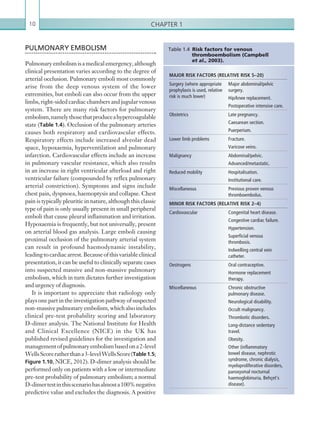
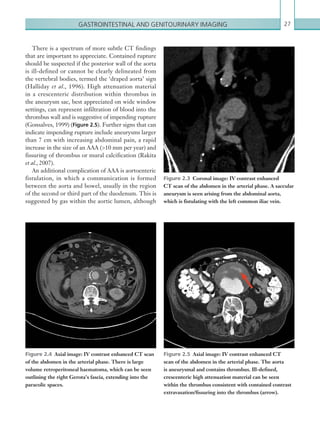
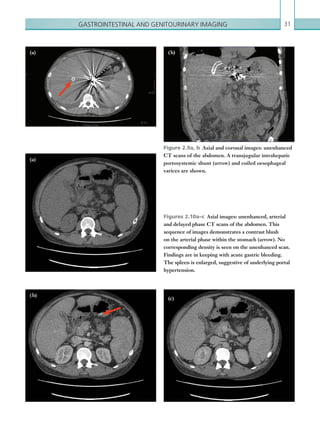
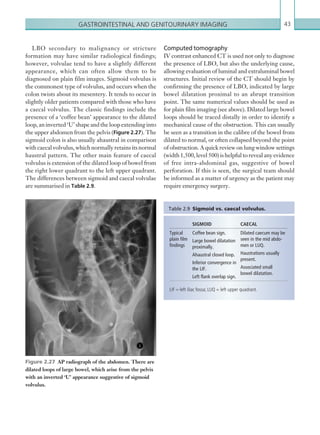
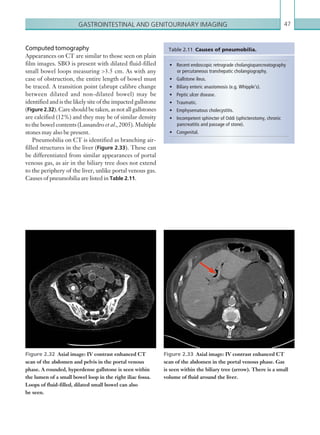
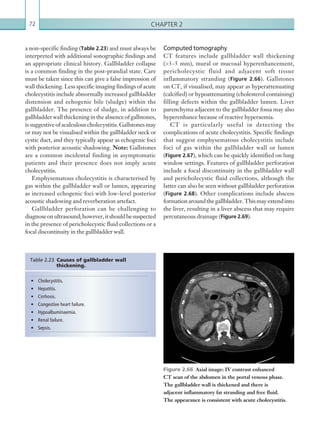
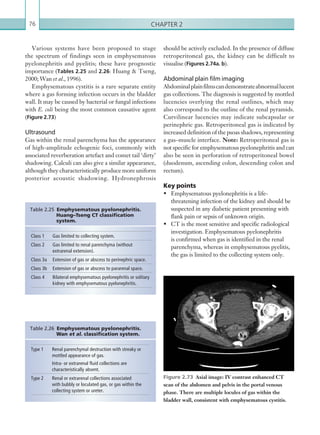
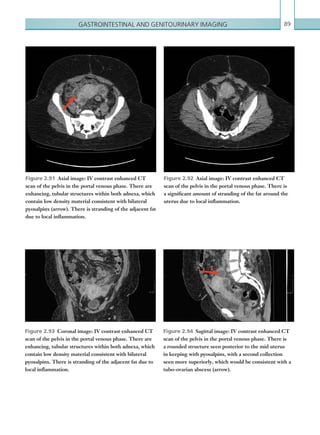
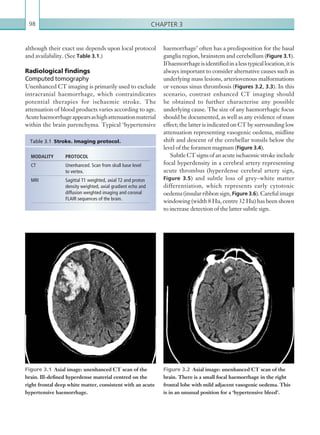
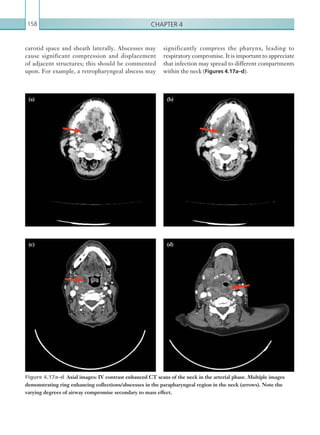
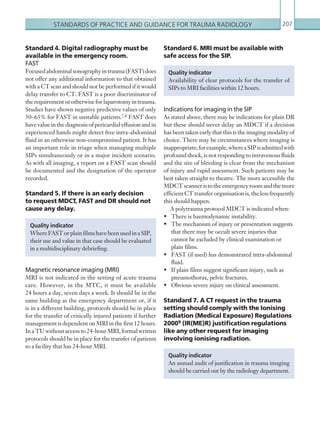
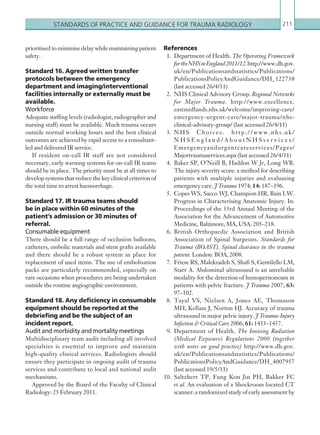
CRITERIA FOR PERFORMING A CT
HEAD SCAN
[1] For adults who have sustained a head injury and have any of the following risk factors, perform a
CT head scan within 1 hour of the risk factor being identified:
• GCS less than 13 on initial assessment in the emergency department.
• GCS less than 15 at 2 hours after the injury on assessment in the emergency department.
• Suspected open or depressed skull fracture.
• Any sign of basal skull fracture (haemotympanum, ‘panda’ eyes, cerebrospinal fluid leakage from the
ear or nose, Battle’s sign).
• Post-traumatic seizure.
• Focal neurological deficit.
• More than 1 episode of vomiting.
• A provisional written radiology report should be made available within 1 hour of the scan being
performed.
[2] For children who have sustained a head injury and have any of the following risk factors, perform
a CT head scan within 1 hour of the risk factor being identified:
• Suspicion of non-accidental injury.
• Post-traumatic seizure but no history of epilepsy.
• On initial emergency department assessment, GCS less than 14, or for children under 1 year GCS
(paediatric) less than 15.
• At 2 hours after the injury, GCS less than 15.
• Suspected open or depressed skull fracture or tense fontanelle.
• Any sign of basal skull fracture (haemotympanum, ‘panda’ eyes, cerebrospinal fluid leakage from
the ear or nose, Battle’s sign).
• Focal neurological deficit.
• For children under 1 year, presence of bruise, swelling or laceration of more than 5 cm on the head.
• A provisional written radiology report should be made available within 1 hour of the scan being
performed.
[3] For children who have sustained a head injury and have more than one of the following risk factors
(and none of those listed under [2] above), perform a CT head scan within 1 hour of the risk factors
being identified:
• Loss of consciousness lasting more than 5 minutes (witnessed).
• Abnormal drowsiness.
• Three or more discrete episodes of vomiting.
• Dangerous mechanism of injury (high-speed road traffic accident either as pedestrian, cyclist or vehicle
occupant, fall from a height of greater than 3 metres, high-speed injury from a projectile or other
object).
K22247_Appendix I.indd 203 16/05/15 3:15 AM](https://image.slidesharecdn.com/oncallradiology-180422160240/85/On-call-radiology-225-320.jpg)
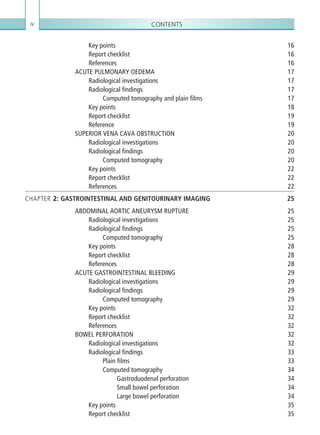
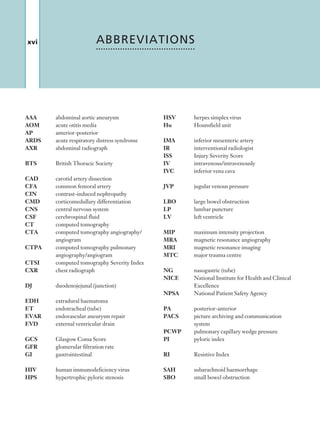
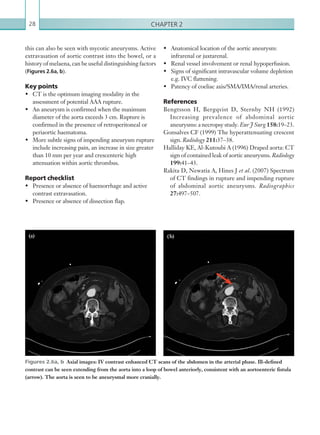
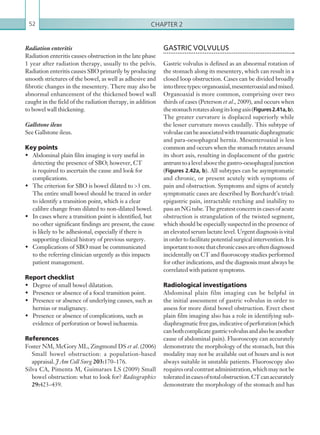
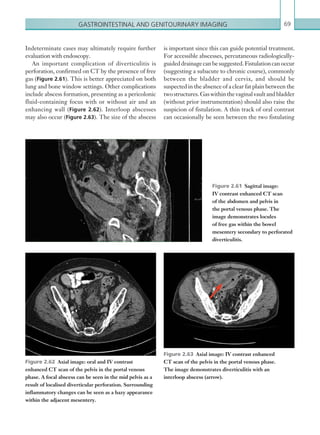
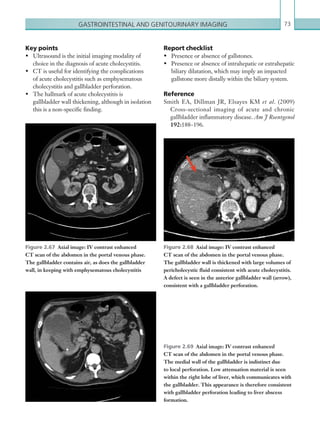
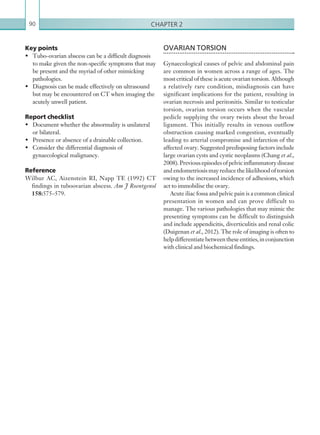
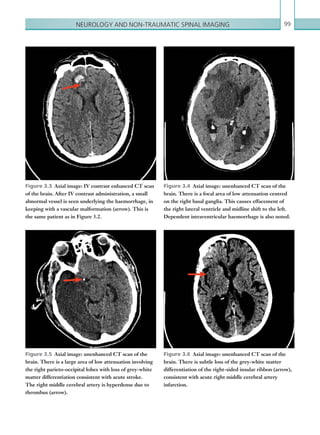
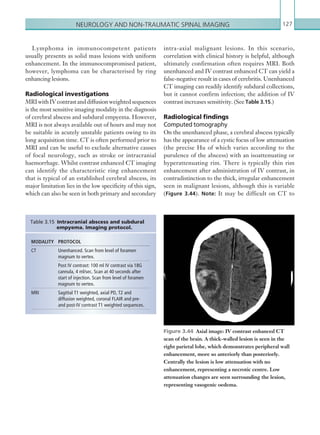
![Appendix 1204
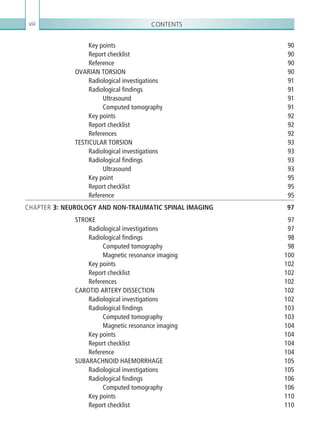
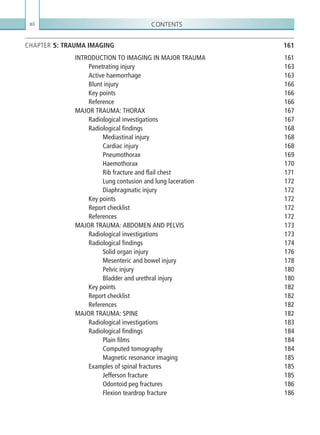
• Amnesia (antegrade or retrograde) lasting more than 5 minutes.
• A provisional written radiology report should be made available within 1 hour of the scan being
performed.
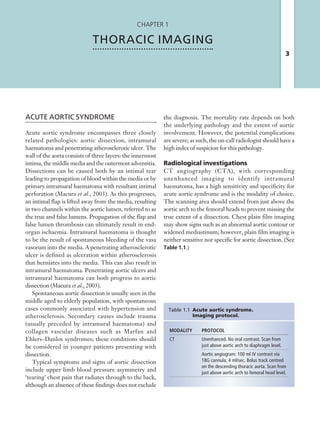
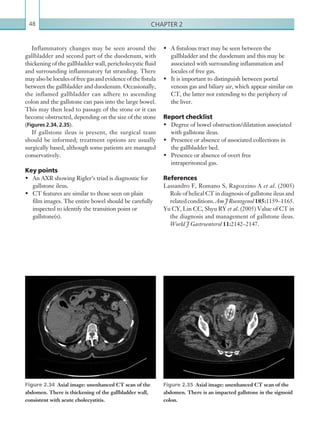
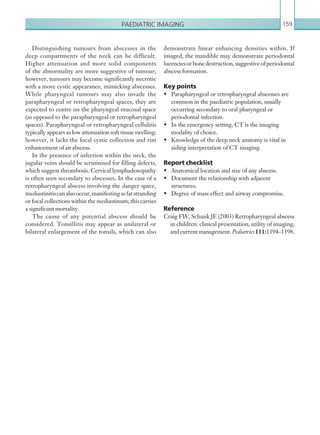
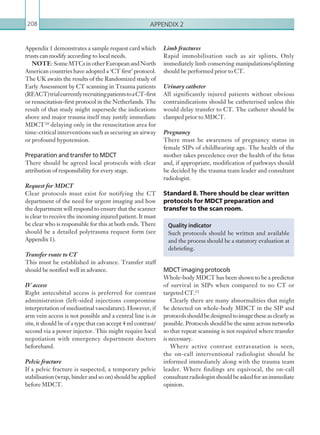
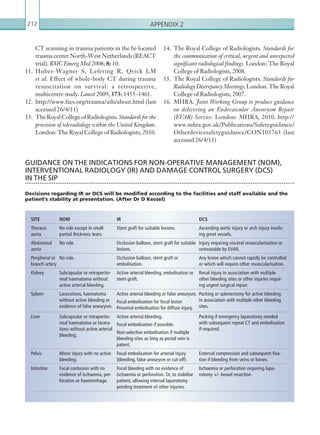
[4] Children who have sustained a head injury and have only 1 of the risk factors listed under [3]
above (and none of those listed under [2] above) should be observed for a minimum of 4 hours after
the head injury. If during observation any of the risk factors below are identified, perform a CT head
scan within 1 hour:
• GCS less than 15.
• Further vomiting.
• A further episode of abnormal drowsiness.
• A provisional written radiology report should be made available within 1 hour of the scan being
performed. If none of these risk factors occur during observation, use clinical judgement to determine
whether a longer period of observation is needed.
GCS = Glasgow Coma Score
From National Institute for Health and Care Excellence (2014) CG 176 Head injury. Triage, assessment,
investigation and early management of head injury in children, young people and adults. Manchester: NICE.
Available from www.nice.org.uk/CG176. With permission.
K22247_Appendix I.indd 204 16/05/15 3:15 AM](https://image.slidesharecdn.com/oncallradiology-180422160240/85/On-call-radiology-226-320.jpg)


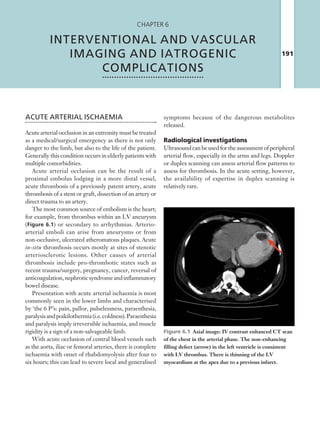
![Patient care [autosaved]](https://cdn.slidesharecdn.com/ss_thumbnails/patientcareautosaved-150405120334-conversion-gate01-thumbnail.jpg?width=640&height=640&fit=bounds)


![Hypothalamus short notes on location, function and disorders by Dr. Neha [PT]...](https://cdn.slidesharecdn.com/ss_thumbnails/hypothalamusbydr-260124142231-2b48143d-thumbnail.jpg?width=640&height=640&fit=bounds)


