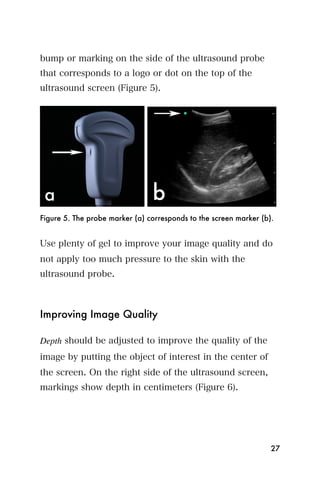
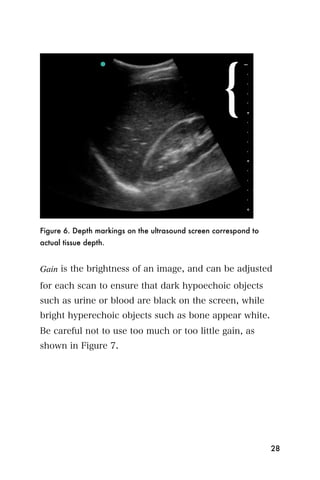
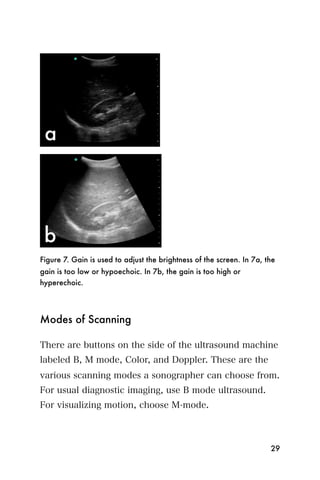
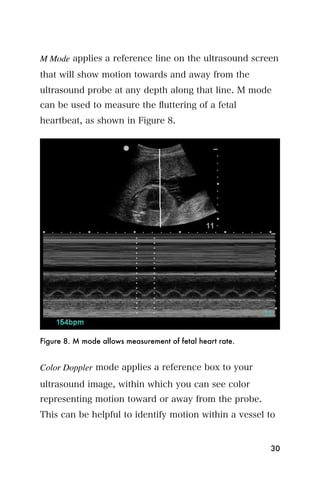
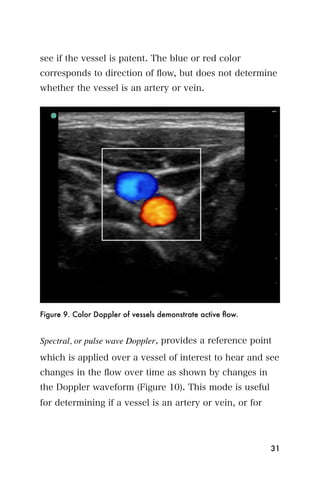
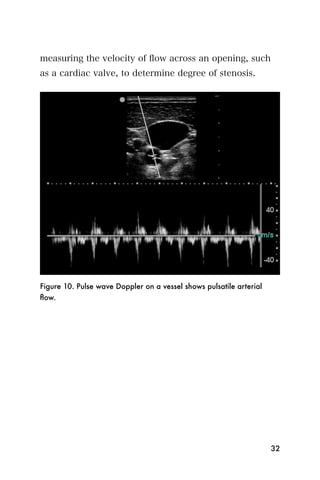
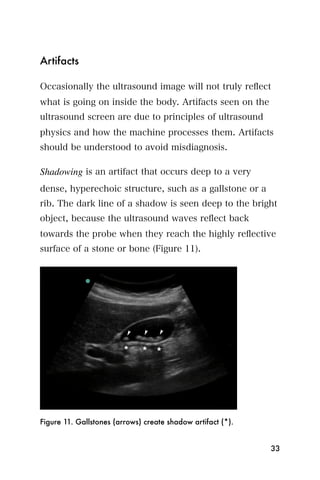
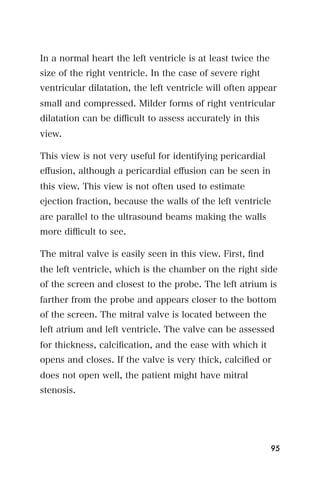
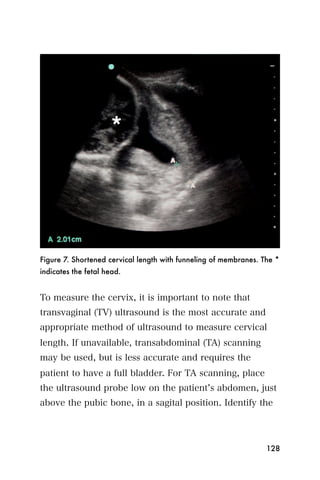
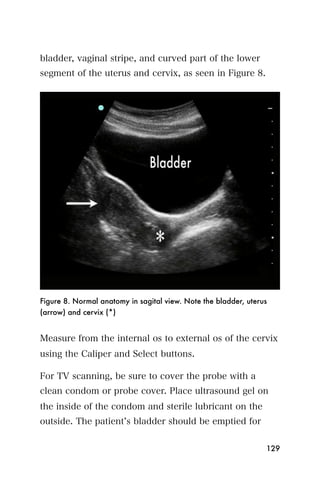
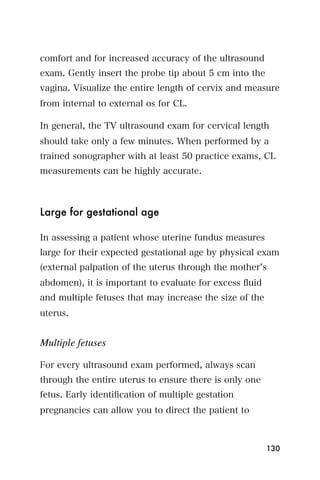
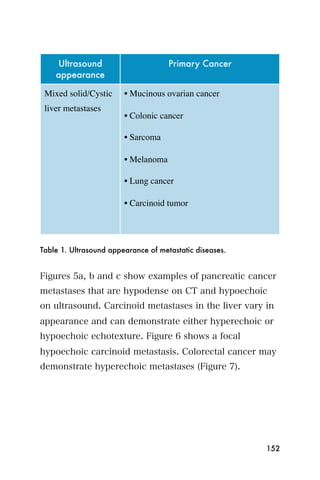
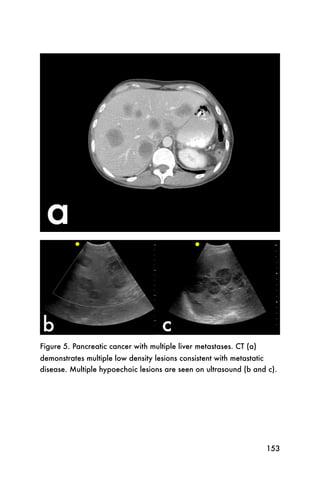
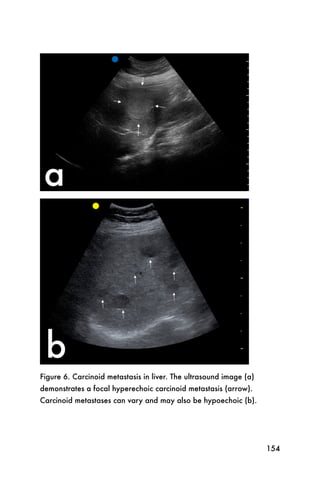
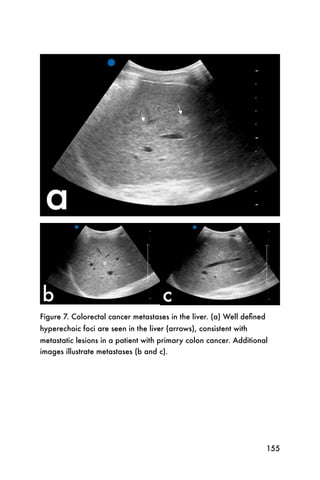
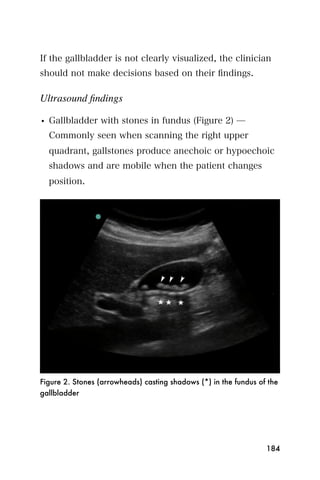
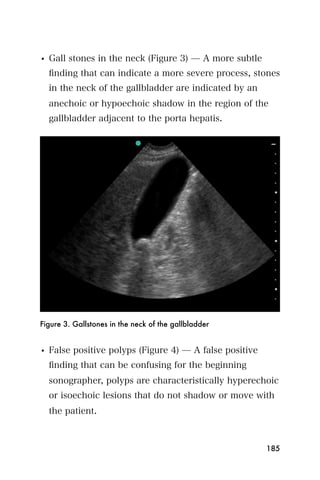
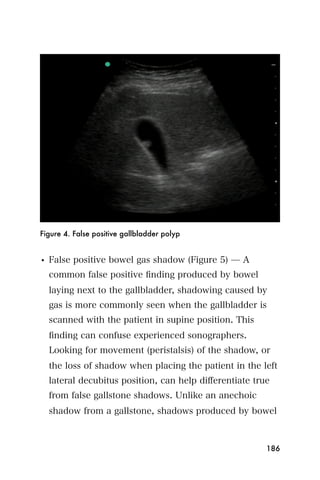
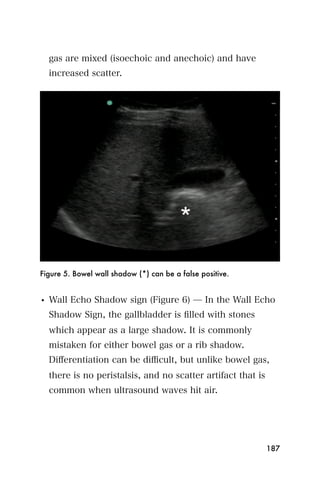
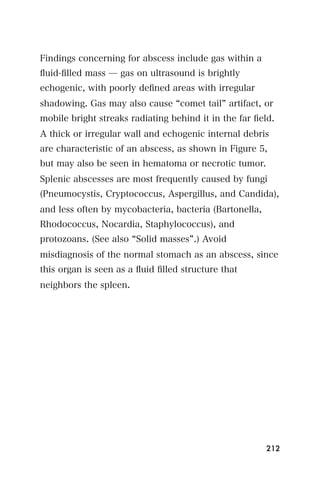
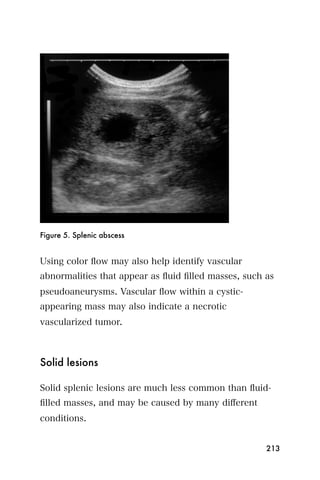
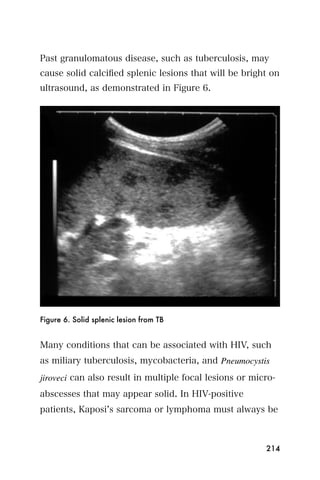
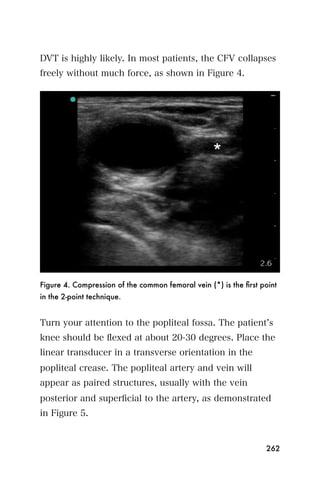
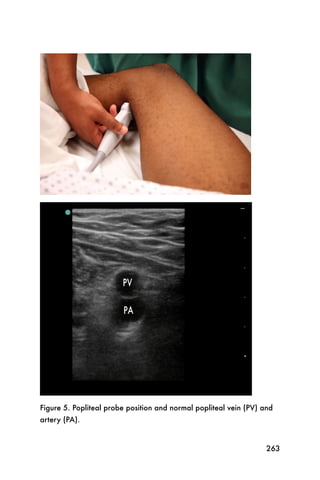
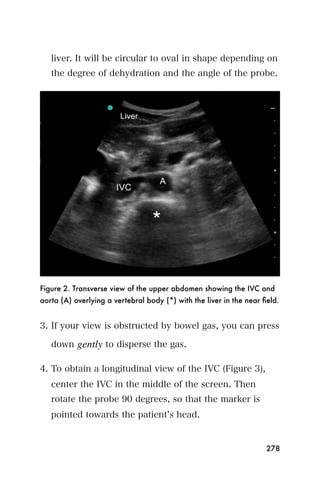
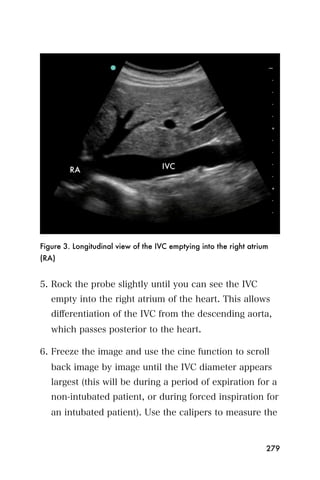
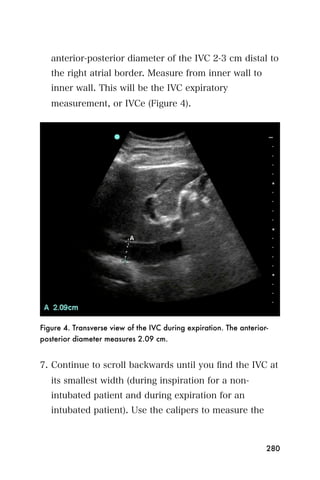
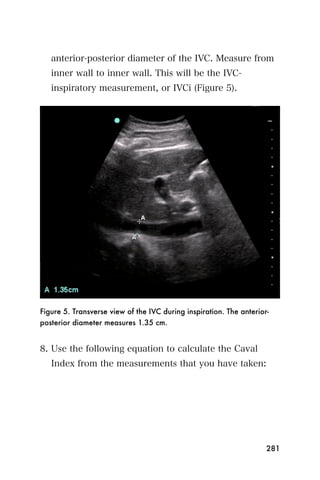
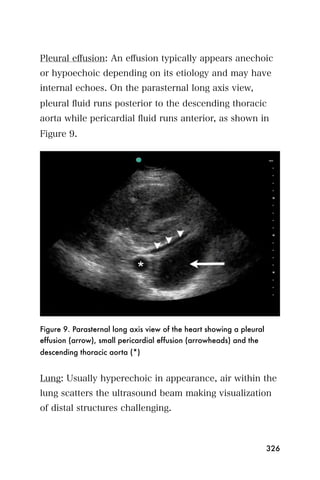
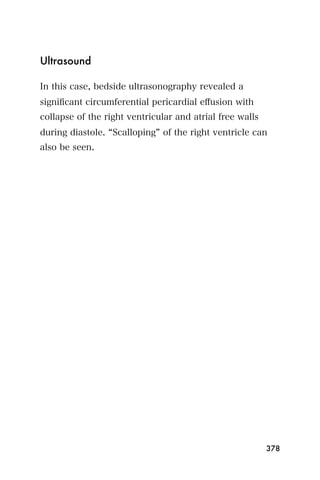
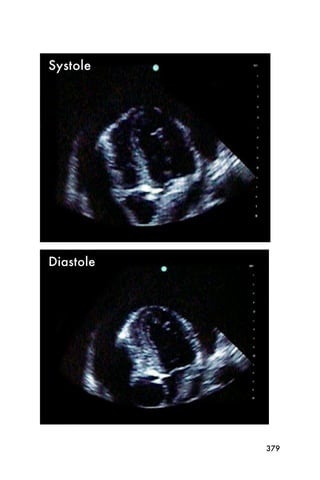
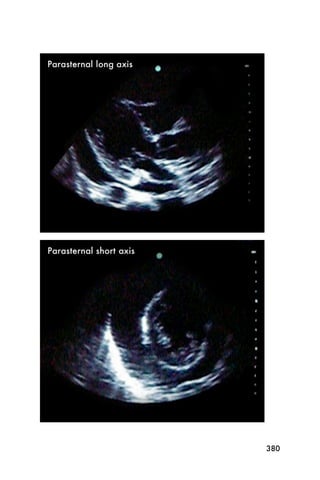
Downloaded 3,475 times


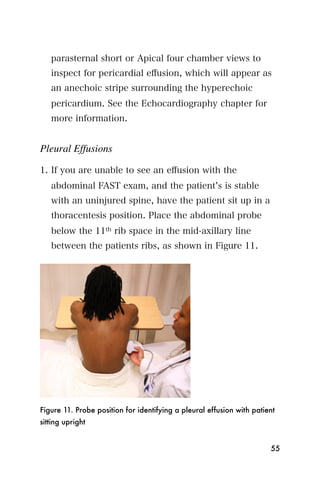

![Recommended reading
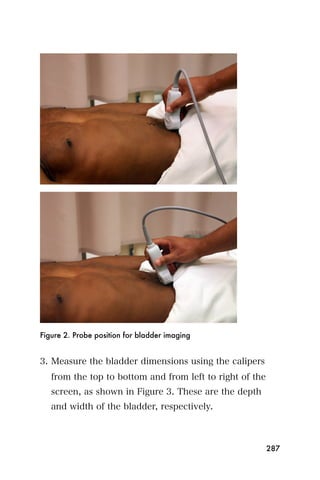
1. Andrews MW. Ultrasound of the spleen. World J Surg
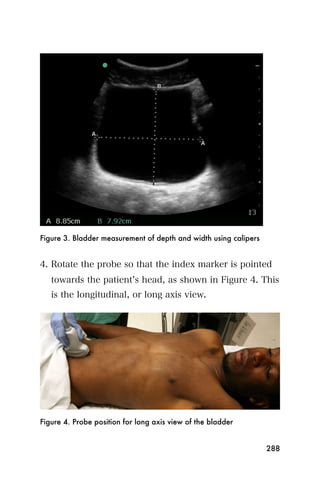
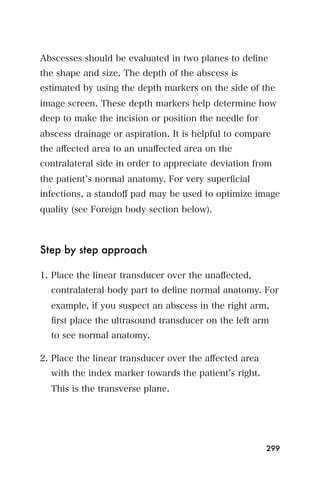
2000;24:183-7.
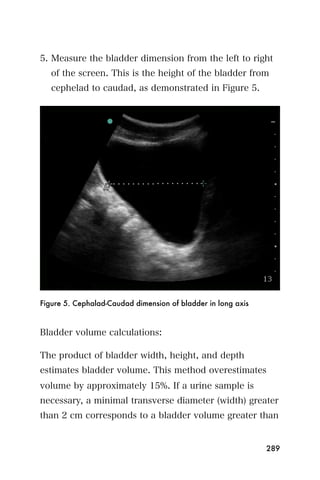
2. Bonnard P, Lanuit R, Dompnier JP, et al. [Predictive
ultrasonographic criteria for portal hypertension due to
Schistosoma mansoni in a recently established endemic zone].
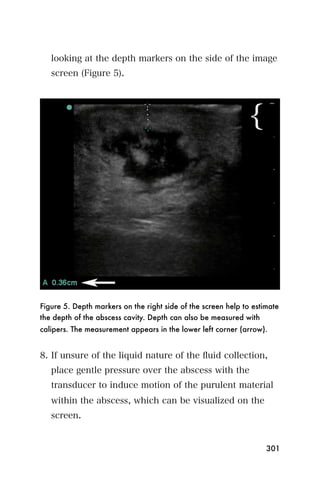
Med Trop (Mars) 2000;60:42-6.
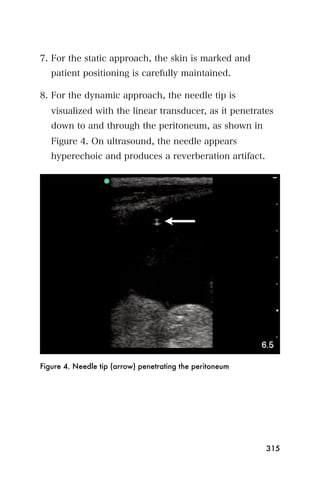
3. Harald T. Lutz HAG. Manual of Diagnostic Ultrasound in
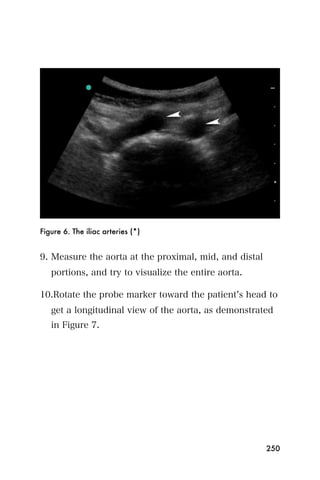
Infectious Tropical Diseases. Berlin, Germany: Springer-Verlag,
2006.
4. Richter J, de Bernardis C, Sagir A, et al. Is ultrasound a useful
adjunct for assessing malaria patients? Parasitol Res
2004;94:349-53.
5. Doehring-Schwerdtfeger E, Kaiser C, Schlake J, et al.
Ultrasound versus clinical examination as indication for
Schistosoma mansoni associated morbidity in children. Trop
Med Parasitol 1992;43:245-8.
6. Mathieson JR, Cooperberg PL. The Spleen in Diagnostic
Ultrasound. Mosby Year Book. St. Louis, MO: Mosby;
1997:154-177.
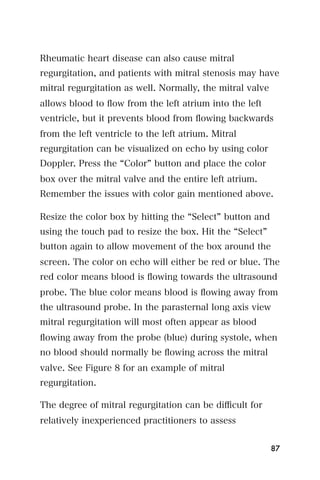
221](https://image.slidesharecdn.com/manualultrasound-120605111949-phpapp02/85/Manual-ultrasound-221-320.jpg)

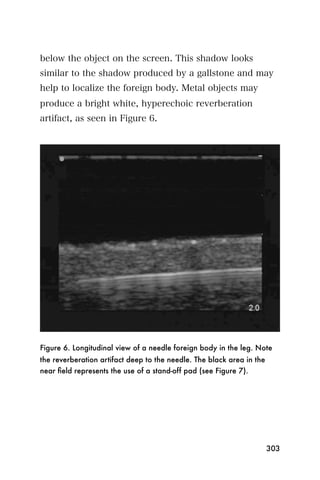
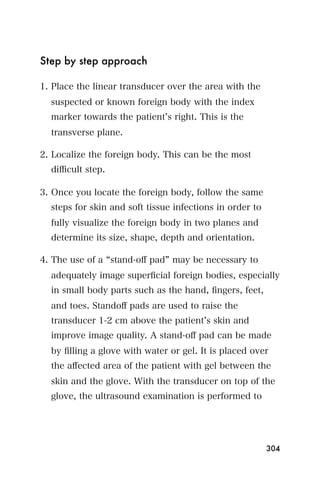
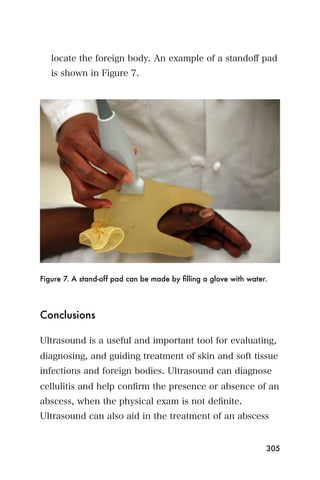
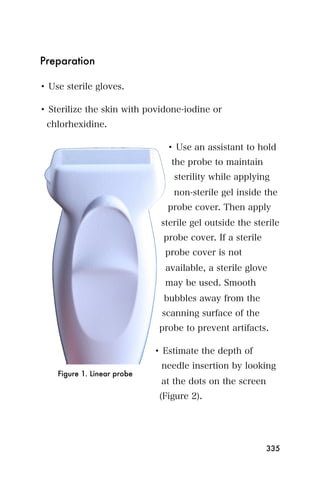
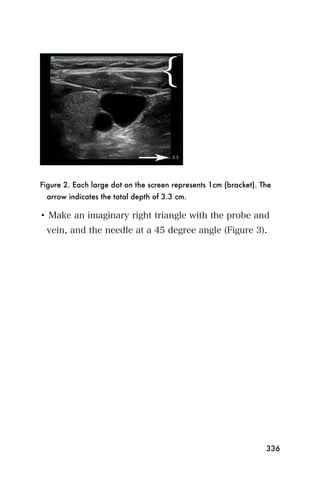
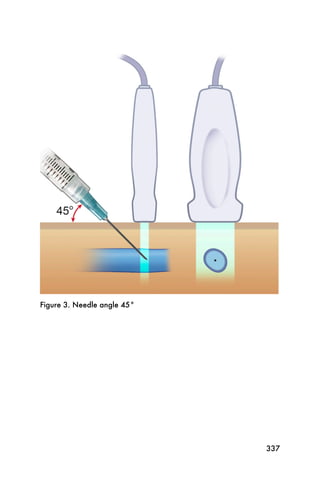
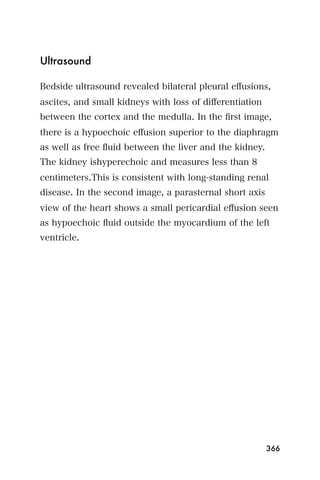
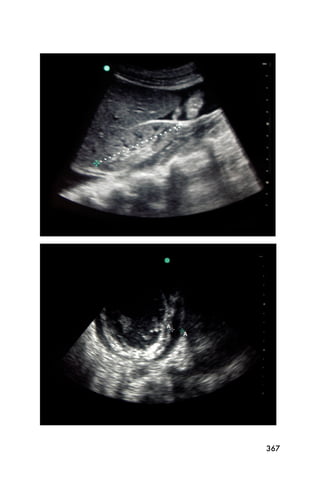

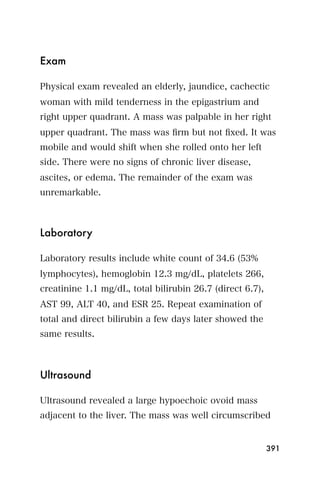
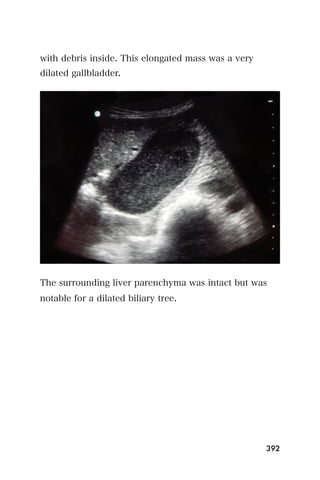
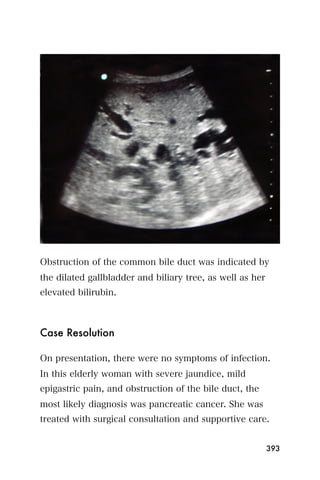
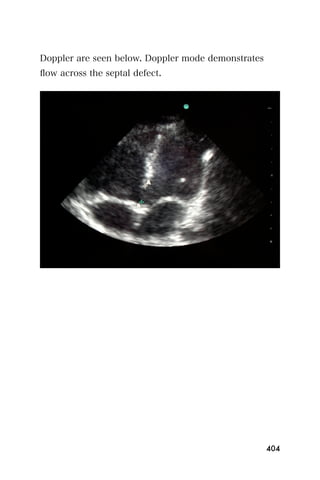
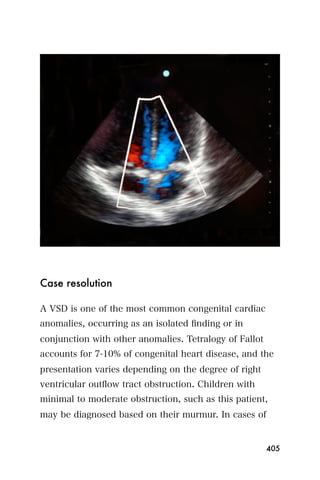

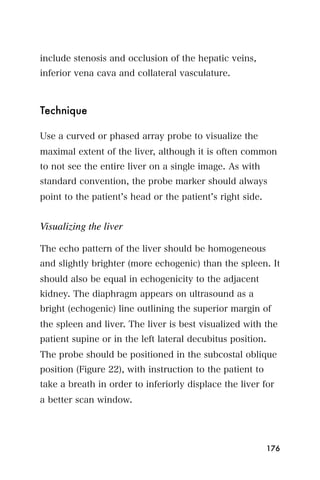
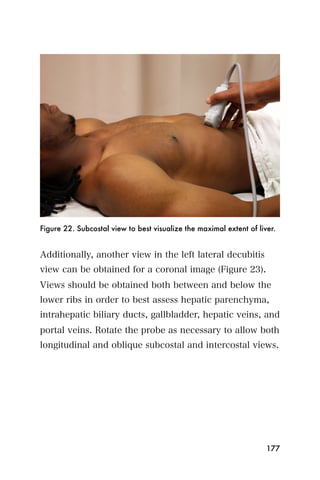
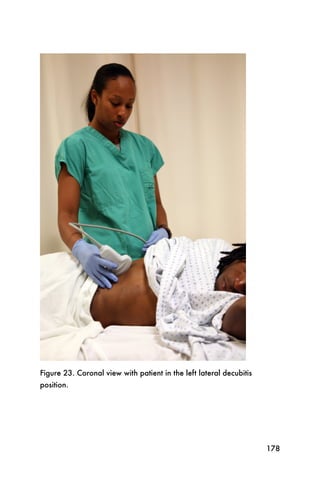
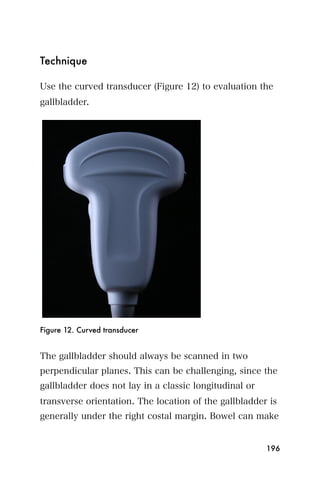
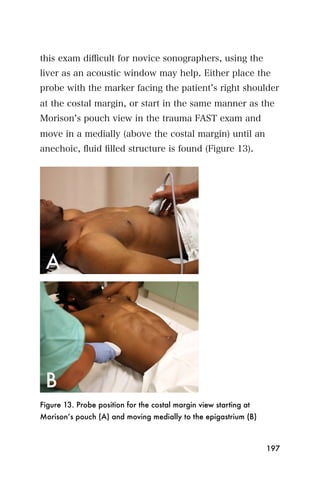
This document provides an overview and table of contents for "The Partners In Health Manual of Ultrasound for Resource Limited Settings." It was edited by Sachita P Shah and Daniel D Price and contains chapters on fundamentals of ultrasound, trauma, echocardiography, obstetrics, liver, gallbladder, spleen, kidney, abdominal aortic aneurysm, deep venous thrombosis, volume status, bladder, skin, procedures, and vascular access. It is intended as a resource for healthcare providers using point-of-care ultrasound in resource-limited settings.


![CASE_PRESENTATION_ON_subdural_hematoma(SDH)[1 FINAL PPT]-1.pptx](https://cdn.slidesharecdn.com/ss_thumbnails/casepresentationonsubduralhematomasdh1finalppt-1-260129172522-d405d375-thumbnail.jpg?width=640&height=640&fit=bounds)


