This document provides an explanation of the Data Points included in the Region's and Individual state trading relationships 2004 - 2010. Pass your cursor over the bubbles to see the explanation of what the data represents.
This document provides an explanation of the Data Points included in the Region's and Individual state trading relationships 2004 - 2010. Pass your cursor over the bubbles to see the explanation of what the data represents.
The international trade data comes from Bureau of Transportation Statistics North American Transborder Freight Data (http://www.bts.gov/programs/international/transborder/TBDR_QA.html). domestic data is from the Freight Analysis Framework by Center for Transportation Analysis in the Oak Ridge National Laboratory under funding from the Federal Highway Administration (http://faf.ornl.gov/fafweb/Extraction2.aspx).
The international trade data comes from Bureau of Transportation Statistics North American Transborder Freight Data (http://www.bts.gov/programs/international/transborder/TBDR_QA.html).
This domestic data is from the Freight Analysis Framework by Center for Transportation Analysis in the Oak Ridge National Laboratory under funding from the Federal Highway Administration (http://faf.ornl.gov/fafweb/Extraction2.aspx).
The international trade data comes from Bureau of Transportation Statistics North American Transborder Freight Data (http://www.bts.gov/programs/international/transborder/TBDR_QA.html). domestic data is from the Freight Analysis Framework by Center for Transportation Analysis in the Oak Ridge National Laboratory under funding from the Federal Highway Administration (http://faf.ornl.gov/fafweb/Extraction2.aspx).
The international trade data comes from Bureau of Transportation Statistics North American Transborder Freight Data (http://www.bts.gov/programs/international/transborder/TBDR_QA.html). domestic data is from the Freight Analysis Framework by Center for Transportation Analysis in the Oak Ridge National Laboratory under funding from the Federal Highway Administration (http://faf.ornl.gov/fafweb/Extraction2.aspx).
The international trade data comes from Bureau of Transportation Statistics North American Transborder Freight Data (http://www.bts.gov/programs/international/transborder/TBDR_QA.html). domestic data is from the Freight Analysis Framework by Center for Transportation Analysis in the Oak Ridge National Laboratory under funding from the Federal Highway Administration (http://faf.ornl.gov/fafweb/Extraction2.aspx).
The international trade data comes from Bureau of Transportation Statistics North American Transborder Freight Data (http://www.bts.gov/programs/international/transborder/TBDR_QA.html). domestic data is from the Freight Analysis Framework by Center for Transportation Analysis in the Oak Ridge National Laboratory under funding from the Federal Highway Administration (http://faf.ornl.gov/fafweb/Extraction2.aspx).
The international trade data comes from Bureau of Transportation Statistics North American Transborder Freight Data (http://www.bts.gov/programs/international/transborder/TBDR_QA.html). domestic data is from the Freight Analysis Framework by Center for Transportation Analysis in the Oak Ridge National Laboratory under funding from the Federal Highway Administration (http://faf.ornl.gov/fafweb/Extraction2.aspx).
The international trade data comes from Bureau of Transportation Statistics North American Transborder Freight Data (http://www.bts.gov/programs/international/transborder/TBDR_QA.html). domestic data is from the Freight Analysis Framework by Center for Transportation Analysis in the Oak Ridge National Laboratory under funding from the Federal Highway Administration (http://faf.ornl.gov/fafweb/Extraction2.aspx).
As a growing number of homebuyers, many of whom put their purchase on hold due to stricter lending guidelines, now reactivate their search, the expectation is for
renewed growth in home sales in the second half of 2013,"
“It is clear that many GTA households remain upbeat about home ownership because owning a home represents a high quality, long-term investment. We will see a big, new record this year for home sales reported through TREB’s MLS® System,” said Mr. McLean.
This is great news for everyone indeed. A healthy market is beneficial for the greater economy and to every single client we deal with.
Reach for the Sky!: Funding Opportunities – Programs, grants, innovative fund...Ports-To-Plains Blog
Reach for the Sky!: Funding Opportunities – Programs, grants, innovative funding options
Elena Quintanilla, Director of Regional Services, South Plains Association of Governments
The international trade data comes from Bureau of Transportation Statistics North American Transborder Freight Data (http://www.bts.gov/programs/international/transborder/TBDR_QA.html). domestic data is from the Freight Analysis Framework by Center for Transportation Analysis in the Oak Ridge National Laboratory under funding from the Federal Highway Administration (http://faf.ornl.gov/fafweb/Extraction2.aspx).
The international trade data comes from Bureau of Transportation Statistics North American Transborder Freight Data (http://www.bts.gov/programs/international/transborder/TBDR_QA.html).
This domestic data is from the Freight Analysis Framework by Center for Transportation Analysis in the Oak Ridge National Laboratory under funding from the Federal Highway Administration (http://faf.ornl.gov/fafweb/Extraction2.aspx).
The international trade data comes from Bureau of Transportation Statistics North American Transborder Freight Data (http://www.bts.gov/programs/international/transborder/TBDR_QA.html). domestic data is from the Freight Analysis Framework by Center for Transportation Analysis in the Oak Ridge National Laboratory under funding from the Federal Highway Administration (http://faf.ornl.gov/fafweb/Extraction2.aspx).
The international trade data comes from Bureau of Transportation Statistics North American Transborder Freight Data (http://www.bts.gov/programs/international/transborder/TBDR_QA.html). domestic data is from the Freight Analysis Framework by Center for Transportation Analysis in the Oak Ridge National Laboratory under funding from the Federal Highway Administration (http://faf.ornl.gov/fafweb/Extraction2.aspx).
The international trade data comes from Bureau of Transportation Statistics North American Transborder Freight Data (http://www.bts.gov/programs/international/transborder/TBDR_QA.html). domestic data is from the Freight Analysis Framework by Center for Transportation Analysis in the Oak Ridge National Laboratory under funding from the Federal Highway Administration (http://faf.ornl.gov/fafweb/Extraction2.aspx).
The international trade data comes from Bureau of Transportation Statistics North American Transborder Freight Data (http://www.bts.gov/programs/international/transborder/TBDR_QA.html). domestic data is from the Freight Analysis Framework by Center for Transportation Analysis in the Oak Ridge National Laboratory under funding from the Federal Highway Administration (http://faf.ornl.gov/fafweb/Extraction2.aspx).
The international trade data comes from Bureau of Transportation Statistics North American Transborder Freight Data (http://www.bts.gov/programs/international/transborder/TBDR_QA.html). domestic data is from the Freight Analysis Framework by Center for Transportation Analysis in the Oak Ridge National Laboratory under funding from the Federal Highway Administration (http://faf.ornl.gov/fafweb/Extraction2.aspx).
The international trade data comes from Bureau of Transportation Statistics North American Transborder Freight Data (http://www.bts.gov/programs/international/transborder/TBDR_QA.html). domestic data is from the Freight Analysis Framework by Center for Transportation Analysis in the Oak Ridge National Laboratory under funding from the Federal Highway Administration (http://faf.ornl.gov/fafweb/Extraction2.aspx).
As a growing number of homebuyers, many of whom put their purchase on hold due to stricter lending guidelines, now reactivate their search, the expectation is for
renewed growth in home sales in the second half of 2013,"
“It is clear that many GTA households remain upbeat about home ownership because owning a home represents a high quality, long-term investment. We will see a big, new record this year for home sales reported through TREB’s MLS® System,” said Mr. McLean.
This is great news for everyone indeed. A healthy market is beneficial for the greater economy and to every single client we deal with.
Reach for the Sky!: Funding Opportunities – Programs, grants, innovative fund...Ports-To-Plains Blog
Reach for the Sky!: Funding Opportunities – Programs, grants, innovative funding options
Elena Quintanilla, Director of Regional Services, South Plains Association of Governments
Howdy Partners!: Updates from Ports-to-Plains Alliance PartnersAlan Hyland, Chairman of the Palliser Economic Partnership (P.E.P.), Councillor Town of Bow Island
A confiança do consumidor brasileiro caiu 1,7% em junho na comparação com maio, de acordo com a pesquisa Índice Nacional de Expectativa do Consumidor (INEC) realizada pela Confederação Nacional da Indústria (CNI) e divulgada nesta segunda-feira, 02.07. O índice recuou de 114,6 para 112,6 de um mês para o outro, devido principalmente a uma preocupação maior com o desemprego e com uma situação financeira mais desfavorável, dois dos seis componentes do INEC.
Efeitos da crise internacional levam CNI a reduzir a 2,1%
a estimativa de crescimento do PIB e a 1% o da indústria
Informe Conjuntural divulgado pela Confederação Nacional da Indústria - CNI - em 11/07/2012
Estão abertas as inscrições para o Prêmio CNI de Jornalismo - edição 2012.
Curta a nossa página: www.facebook.com/premiocnidejornalismo
Acesse www.premiocnidejornalismo.com.br e saiba mais.
Cushman & Wakefield's Canadian Office Statistical Summary Q4 2018Guy Masse
Q4 2018
Canadian Office Statistical Summary
Driven by buoyant demand from technology companies, extremely tight CBD markets in both Vancouver and Toronto got even tighter over the final quarter of the year, helping drive the National CBD vacancy rate to 8.7% - its lowest point since Q3 2015!
KEY HIGHLIGHTS
• Canadian CBD Class A markets saw absorption of 3.6 msf in 2018, with a fourth quarter contribution of 1.5 msf. This is the strongest premium space growth since 2011.
• The arrival and partial occupancy of Stantec Tower helped drive Q4 2018 absorption in Edmonton’s downtown market to above 800,000 sf, with a final year-end 2018 tally of 1.2 msf.
• Although Calgary continues to see modest momentum in its CBD market, Suburban markets had a strong year with absorption reaching 337,000 sf. This drove vacancy to 16.9% from 19.4% one-year-ago.
• Vacancy in Downtown Toronto reached an incredibly tight 1.9% in Q4, a vacancy rate not seen in over 35 years. Conditions are expected to remain extremely tight until late 2020 when the first in a 10.7 msf wave of new developments will begin to hit the downtown market.
• Downtown Vancouver, another hot market driven by technology growth, saw its vacancy decline to 2.3% in Q4; its lowest point since Q2 2008. Like Toronto, little relief for tenants is not anticipated until the next wave of downtown new supply begins to arrive in late 2020.
TORONTO REAL ESTATE BOARD'S -- MARKET WATCH - JULY 2019Shawn Venasse
Toronto Real Estate Board President Michael Collins announced that Greater Toronto Area REALTORS® reported 8,595 sales through TREB's MLS® System in July 2019. This result was up by 24.3 per cent compared to July 2018. On a month-over-month basis, sales were up by 5.1 per cent, after preliminary seasonal adjustment.
New listings entered into TREB's MLS® System in July 2019 were up compared to July 2018, but by a much lesser annual rate than sales, at 3.7 per cent. With annual growth in sales far outstripping annual growth in new listings, market conditions clearly tightened compared to last year. Active listings at the end of July were down by 9.1 per cent year-over-year, further reflecting tightening market conditions.
As market conditions continued to tighten in July, the average selling price increased by 3.2 per cent on a year-over-year basis to $806,755. The MLS® Home Price Index Composite benchmark was up by 4.4 per cent. Higher density home types continued to drive price growth, whereas detached home prices remained down in many communities throughout the GTA.
Broadly speaking, increased competition between buyers for available properties has resulted in relatively strong price growth above the rate of inflation for semi-detached houses, townhouses and condominium apartments. However, the single-detached market segment, which has arguably been impacted most by the OSFI stress test, has experienced a slower pace of price growth, with average detached prices remaining lower than last year's levels in some parts of the GTA.
Presentation by Joe Kiely, Vice President of Operations at Ports-to-Plains Alliance at Northern Ports-to-Plains Work Group Meeting in Wainwright, AB on June 21, 2013
Energy Development Impact on Transportation Infrastructure presented by TxDOT at Ports-to-Plains Alliance Annual Meeting in Washington DC on April 26, 2013.
Wind Energy's Future and the Impact on U.S. Manufacturing presentation at Ports-to-Plains Alliance Energy Conference in Washington DC on April 26, 2013.
Fuels Policy, Ethanol and RFS Reform Political and Policy Implications on Gas...Ports-To-Plains Blog
Fuels Policy, Ethanol and RFS Reform
Political and Policy Implications on Gasoline Prices.
Presented at Ports-to-Plains Alliance Energy Conference, Washington Dc on April 26, 2013
Dear Governor Heineman:
Thank you for approving the new route for the Keystone XL Pipeline. The project will allow America to gain independence from Middle East and Venezuelan oil by increasing supplies from our loyal, stable and secure ally in Canada. It will also be a major economic development booster for our country and region, not only in the construction of the pipeline, but in further development of Alberta’s oil resources. For every two Canadian jobs created by the oil sands, a third is created in the US. Alberta oil sands development is projected to generate more than $500 billion in US economic impact over the next 25 years.
Letter supporting the Findings of nebraska Department of Environmental Quality for the Keystone XL Pipeline Evaluation by 125 elected officials and community leaders in the Ports-to-Plains region.
Jack Schenendorf, Ports-to-Plains Alliance Transportation Consultant, in Washington will address the following topics:
The 2012 elections, the politics of 113th Congress, and the new leaders handling transportation.
Fiscal cliff: how bad is it and what is likely to happen?
Transportation's fiscal cliff: what are we going to do about it?
MAP-21 implementation and reauthorization in 113th Congress.
Jack Schenendorf’s practice concentrates on transportation and legislation with a particular focus on legislative strategy, legislative procedure, and the federal budget process. For nearly 25 years, Mr. Schenendorf served on the staff of the Committee on Transportation and Infrastructure of the U.S. House of Representatives. He was Chief of Staff from 1995 to 2001.
Jack represents the Ports-to-Plains Alliance in Washington, DC. In addition he has represented Associated General Contractors, American Association of State Highway and Transportation Officials, Association of Equipment Manufactures, United Airlines and others
Comments on Interim Guidance on State Freight Plans and State Advisory Commit...Ports-To-Plains Blog
The U.S. Department of Transportation (DOT) requested comments related to the interim guidance on state freight plans and state advisory committees. In response to the Notice, the Ports-to-Plains Alliance respectfully submitted these comments.
Interim Guidance on State Freight Plans and State Freight Advisory CommitteesPorts-To-Plains Blog
DEPARTMENT OF TRANSPORTATION
Office of the Secretary of Transportation
Interim Guidance on State Freight Plans and State Freight Advisory Committees
Federal Register / Vol. 77, No. 199 / Monday, October 15, 2012 / Notices
Statement on TBD Colorado Recommendations on Transportation
Ports-to-Plains Alliance Northern Working Group Strategic Plan October 2012Ports-To-Plains Blog
Members of the Ports-to-Plains Alliance, organizations and individuals from North Dakota, Montana, Alberta and Saskatchewan met in Regina on October 10 and 11, 2012 to develop a northern plan to enhance the Ports-to-Plains Corridor.
15th Annual Ports-to-Plains Alliance Conference
Medicine Hat, AB
October 2-4, 2012
Thursday, October 4, 2012
Open Road. Big Opportunity. Rural to Rural Project
4. Oklahoma Trading Relationships -- 2004 - 2010 Mexico
Domestic
Canada
2010 Leading Exports from Oklahoma to Mexico (Surface 2010 2010 Leading Exports from Oklahoma to Mexico (Surface 2010
Transportation) Transportation)
Rank Export Rank Coahuila Export
1 84 Computer-Related Machinery and Parts $88,607,696 1 2 Meat and Edible Offal $27,856,202
2 2 Meat and Edible Offal $56,460,263 2 84 Computer-Related Machinery and Parts $1,270,217
3 23 Food Residues and Waste $37,067,950 3 34 Soap and Organic Surface-Active Agents $371,123
4 87 Vehicles Other than Railway $36,584,184 4 39 Plastics and Articles $353,263
5 85 Electrical Machinery; Equipment and Parts $23,051,024 5 25 Salt; Sulfur; Plaster and Cement $345,785
6 38 Miscellaneous Chemical Products $18,843,333 6 68 Stone; Plaster; Cement and Asbestos $291,394
7 90 Measuring and Testing Instruments $16,865,616 7 72 Iron and Steel $232,844
8 39 Plastics and Articles $13,693,873 8 27 Mineral Fuels; Oils and Waxes $191,968
9 73 Articles of Iron and Steel $13,319,059 9 73 Articles of Iron and Steel $180,262
10 70 Glass $10,943,488 10 85 Electrical Machinery; Equipment and Parts $149,935
2010 Leading Imports to Oklahoma from Mexico (Surface 2010 2010 Leading Exports from Oklahoma from Mexico (Surface 2010
Rank Import Rank Nuevo Leon Export
1 85 Electrical Machinery; Equipment and Parts $194,253,634 1 85 Electrical Machinery; Equipment and Parts $10,778,375
2 87 Vehicles Other than Railway $168,699,377 2 70 Glass $10,306,691
3 90 Measuring and Testing Instruments $86,018,125 3 84 Computer-Related Machinery and Parts $9,016,847
4 84 Computer-Related Machinery and Parts $50,530,163 4 74 Copper and Articles $6,647,324
5 73 Articles of Iron and Steel $36,299,031 5 27 Mineral Fuels; Oils and Waxes $3,962,425
6 62 Not Knitted or Crocheted Apparel $15,559,059 6 73 Articles of Iron and Steel $2,819,262
7 39 Plastics and Articles $14,655,448 7 39 Plastics and Articles $2,465,039
8 72 Iron and Steel $11,561,354 8 87 Vehicles Other than Railway $2,104,306
9 98 Special Classification Provisions $10,083,625 9 2 Meat and Edible Offal $1,971,323
10 48 Paper and Paperboard $8,287,850 10 12 Oil Seeds and Oleaginous Fruits $1,869,550
2010 Leading Exports from Oklahoma from Mexico (Surface 2010
Rank Tamaulipas Export
1 84 Computer-Related Machinery and Parts $5,151,043
2 85 Electrical Machinery; Equipment and Parts $1,053,123
3 34 Soap and Organic Surface-Active Agents $603,629
4 72 Iron and Steel $452,418
5 87 Vehicles Other than Railway $437,277
6 1 Live Animals $387,025
7 39 Plastics and Articles $292,684
8 27 Mineral Fuels; Oils and Waxes $271,003
9 32 Tanning or Dyeing Extracts $195,196
10 38 Miscellaneous Chemical Products $185,217
7. Oklahoma Trading Relationships -- 2004 - 2010 Mexico
Domestic
Canada
2009-2010 2009-2010 2004-2010 2004-2010
2004 2005 2006 2007 2008 2009 2010 Difference % Change Difference % Change
Sweet Grass, MT
Truck Exports $233,546,574 $350,672,951 $433,603,461 $304,070,201 $373,200,765 $237,283,910 $360,064,256 $122,780,346 51.7% $126,517,682 54.2%
% of Total Exports to Canada 26.0% 29.1% 30.5% 23.4% 25.7% 20.5% 22.9% 2.4% -3.1%
Imports $73,164,225 $118,681,783 $158,681,183 $186,222,515 $228,772,939 $109,149,429 $133,333,395 $24,183,966 22.2% $60,169,170 82.2%
% of Total Exports to Canada 10.0% 15.2% 18.6% 22.1% 23.3% 16.0% 18.7% 2.6% 8.7%
Total Truck Trade Thru Sweet Grass 306710799 $469,354,734 $592,284,644 $490,292,716 $601,973,704 $346,433,339 $493,397,651 $146,964,312 42.4% $186,686,852 60.9%
% Total Trade with Canada 18.8% 23.6% 26.0% 22.9% 24.8% 18.8% 21.6% 2.8% 2.8%
Rail Exports $1,697,666 $2,420,158 $13,537,642 $7,901,656 $19,487,718 $3,092,198 $4,403,609 $1,311,411 42.4% $2,705,943 159.4%
% of Total Exports to Canada 1.0% 0.8% 9.0% 9.7% 17.7% 4.1% 5.0% 0.9% 4.1%
Imports $10,013,234 $15,226,946 $20,684,475 $32,818,594 $46,791,742 $11,907,943 $24,202,498 $12,294,555 103.2% $14,189,264 141.7%
% of Total Exports to Canada 3.8% 2.4% 5.5% 13.1% 15.8% 7.0% 9.4% 2.3% 5.6%
Total Rail Trade Thru Sweet Grass $11,710,900 $17,647,104 $34,222,117 $40,720,250 $66,279,460 $15,000,141 $28,606,107 $13,605,966 90.7% $16,895,207 144.3%
% Total Trade with Canada 2.7% 1.9% 6.5% 12.2% 16.4% 6.1% 8.3% 2.1% 5.6%
TOTAL
Exports $235,244,240 $353,093,109 $447,141,103 $311,971,857 $392,688,483 $240,376,108 $364,467,865 $124,091,757 51.6% $129,223,625 54.9%
% of Total Exports to Canada 21.9% 23.7% 28.4% 22.6% 25.2% 19.5% 21.9% 2.5% 0.1%
Imports $83,177,459 $133,908,729 $179,365,658 $219,041,109 $275,564,681 $121,057,372 $157,535,893 $36,478,521 30.1% $74,358,434 89.4%
% of Total Imports to Canada 8.3% 9.4% 14.6% 20.0% 21.6% 14.2% 16.2% 1.9% 7.9%
Total Trade Thru Sweet Grass $318,421,699 $487,001,838 $626,506,761 $531,012,966 $668,253,164 $361,433,480 $522,003,758 $160,570,278 44.4% $203,582,059 63.9%
% Total Trade with Canada 15.4% 16.7% 22.4% 21.4% 23.6% 17.3% 19.8% 2.5% 4.5%
Portal, ND
Truck Exports $61,712,804 $120,688,417 $153,643,699 $130,265,014 $176,868,686 $121,815,103 $196,178,597 $74,363,494 61.0% $134,465,793 217.9%
% of Total Exports to Canada 6.9% 10.0% 10.8% 10.0% 12.2% 10.5% 12.5% 2.0% 5.6%
Imports $21,238,017 $20,205,458 $30,587,116 $34,939,031 $35,511,135 $26,902,480 $43,951,411 $17,048,931 63.4% $22,713,394 106.9%
% of Total Imports to Canada 2.9% 2.6% 3.6% 4.1% 3.6% 4.0% 6.2% 2.2% 3.3%
Total Truck Trade Thru Portal $82,950,821 $140,893,875 $184,230,815 $165,204,045 $212,379,821 $148,717,583 $240,130,008 $91,412,425 61.5% $157,179,187 189.5%
% Total Trade with Canada 5.1% 7.1% 8.1% 7.7% 8.7% 8.1% 10.5% 2.4% 5.4%
Rail Exports $3,933,566 $12,778,589 $13,326,530 $7,924,672 $36,174,371 $15,260,903 $31,222,231 $17,895,701 104.6% $27,288,665 693.7%
% of Total Exports to Canada 2.2% 4.5% 8.8% 9.7% 32.9% 20.1% 35.6% 15.5% 33.4%
Imports $15,070,036 $33,408,555 $41,351,266 $47,070,699 $48,365,649 $48,117,553 $94,083,875 $52,732,609 95.5% $79,013,839 524.3%
% of Total Imports to Canada 5.7% 5.2% 11.0% 18.7% 16.4% 28.5% 36.4% 7.9% 30.7%
Total Rail Trade Thru Portal $19,003,602 $46,187,144 $54,677,796 $54,995,371 $84,540,020 $63,378,456 $125,306,106 $70,628,310 97.7% $106,302,504 559.4%
% Total Trade with Canada 4.3% 5.0% 10.4% 16.5% 20.9% 25.9% 36.2% 10.3% 31.9%
TOTAL
Exports $65,646,370 $133,467,006 $153,643,699 $130,265,014 $176,868,686 $121,815,103 $196,178,597 $74,363,494 61.0% $161,754,458 198.8%
% of Total Exports to Canada 6.1% 8.9% 9.8% 9.4% 11.3% 9.9% 11.8% 2.0% 5.7%
Imports $36,308,053 $53,614,013 $71,938,382 $82,009,730 $83,876,784 $75,020,033 $138,035,286 $63,015,253 84.0% $101,727,233 280.2%
% of Total Imports to Canada 3.6% 3.8% 7.2% 7.5% 6.6% 8.8% 14.2% 5.4% 10.5%
Total Trade Thru Portal $101,954,423 $187,081,019 $225,582,081 $212,274,744 $260,745,470 $196,835,136 $334,213,883 $137,378,747 69.8% $263,481,691 227.8%
% Total Trade with Canada 4.9% 6.4% 8.1% 8.6% 9.2% 9.4% 12.7% 3.3% 7.8%
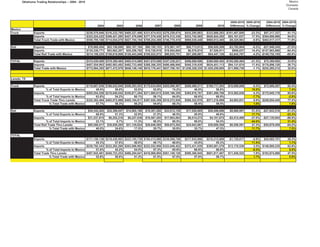
8. Oklahoma Trading Relationships -- 2004 - 2010 Mexico
Domestic
Canada
2009-2010 2009-2010 2004-2010 2004-2010
2004 2005 2006 2007 2008 2009 2010 Difference % Change Difference % Change
Wild Horse
0
Truck Exports $0 $0 $0 $0 $0 $0 $0 $0 #DIV/0! $0 #DIV/0!
% of Total Exports to Canada 0.0% 0.0% 0.0% 0.0% 0.0% 0.0% 0.0% 0.0% 0.0%
Imports $13,930 $0 $0 $36,325 $7,000 $7,670 $0 -$7,670 -100.0% -$13,930 -100.0%
% of Total Imports to Canada 0.0% 0.0% 0.0% 0.0% 0.0% 0.0% 0.0% 0.0% 0.0%
Total Truck Trade Thru GPITC $13,930 $0 $0 $36,325 $7,000 $7,670 $0 -$7,670 -100.0% -$13,930 -100.0%
% Total Trade with Canada 0.0% 0.0% 0.0% 0.0% 0.0% 0.0% 0.0% 0.0% 0.0%
Rail Exports $0 $0 $0 $0 $0 $0 $0 $0 #DIV/0! $0 #DIV/0!
% of Total Exports to Canada 0.0% 0.0% 0.0% 0.0% 0.0% 0.0% 0.0% 0.0% 0.0%
Imports $0 $0 $0 $0 $0 $0 $0 $0 #DIV/0! $0 #DIV/0!
% of Total Imports to Canada 0.0% 0.0% 0.0% 0.0% 0.0% 0.0% 0.0% 0.0% 0.0%
Total Rail Trade Thru GPITC $0 $0 $0 $0 $0 $0 $0 $0 #DIV/0! $0 #DIV/0!
% Total Trade with Canada 0.0% 0.0% 0.0% 0.0% 0.0% 0.0% 0.0% 0.0% 0.0%
TOTAL
Exports $0 $0 $0 $0 $0 $0 $0 $0 #DIV/0! $0 #DIV/0!
% of Total Exports to Canada 0.0% 0.0% 0.0% 0.0% 0.0% 0.0% 0.0% 0.0% 0.0%
Imports $13,930 $0 $0 $36,325 $7,000 $7,670 $0 -$7,670 -100.0% -$13,930 -100.0%
% of Total Imports to Canada 0.0% 0.0% 0.0% 0.0% 0.0% 0.0% 0.0% 0.0% 0.0%
Total Trade Thru GPITC $13,930 $0 $0 $36,325 $7,000 $7,670 $0 -$7,670 -100.0% -$13,930 -100.0%
% Total Trade with Canada 0.0% 0.0% 0.0% 0.0% 0.0% 0.0% 0.0% 0.0% 0.0%
GPITC
#DIV/0!
Truck Exports $295,331,052 $471,440,593 $588,790,406 $435,265,644 $551,693,039 $360,949,778 $571,530,503 $210,580,725 58.3% $276,199,451 93.5%
% of Total Exports to Canada 32.9% 39.1% 41.4% 33.5% 38.1% 31.1% 36.3% 5.2% 3.4%
Imports $94,487,846 $138,966,466 $190,811,545 $222,128,300 $265,914,662 $137,910,344 $192,572,456 $54,662,112 39.6% $98,084,610 103.8%
% of Total Imports to Canada 12.9% 17.8% 22.4% 26.3% 27.1% 20.3% 27.0% 6.7% 14.1%
Total Truck Trade Thru GPITC $389,818,898 $610,407,059 $779,601,951 $657,393,944 $817,607,701 $498,860,122 $764,102,959 $265,242,837 53.2% $374,284,061 96.0%
% Total Trade with Canada 23.9% 30.7% 34.3% 30.7% 33.6% 27.1% 33.4% 6.3% 9.5%
Rail Exports $5,631,232 $15,198,747 $26,864,172 $15,826,328 $55,662,089 $18,353,101 $35,625,840 $17,272,739 94.1% $29,994,608 532.6%
% of Total Exports to Canada 0.6% 1.3% 1.9% 1.2% 3.8% 1.6% 2.3% 0.7% 1.6%
Imports $25,083,270 $48,635,501 $62,035,741 $79,889,293 $95,157,391 $60,025,496 $118,286,373 $58,260,877 97.1% $93,203,103 371.6%
% of Total Imports to Canada 3.4% 6.2% 7.3% 9.5% 9.7% 8.8% 16.6% 7.7% 13.1%
Total Rail Trade Thru GPITC $30,714,502 $63,834,248 $88,899,913 $95,715,621 $150,819,480 $78,378,597 $153,912,213 $75,533,616 96.4% $123,197,711 401.1%
% Total Trade with Canada 1.9% 3.2% 3.9% 4.5% 6.2% 4.3% 6.7% 2.5% 4.8%
TOTAL
Exports $300,962,284 $486,639,340 $615,654,578 $451,091,972 $607,355,128 $379,302,879 $607,156,343 $227,853,464 60.1% $306,194,059 101.7%
% of Total Exports to Canada 28.0% 32.6% 39.2% 32.6% 0.389449787 30.7% 36.6% 5.9% 8.6%
Imports $119,571,116 $187,601,967 $252,847,286 $302,017,593 $361,072,053 $197,935,840 $310,858,829 $112,922,989 57.1% $191,287,713 160.0%
% of Total Imports to Canada 12.0% 13.1% 20.6% 27.6% 0.283051467 23.3% 32.0% 8.7% 20.0%
Total Trade Thru GPITC $420,533,400 $674,241,307 $868,501,864 $753,109,565 $968,427,181 $577,238,719 $918,015,172 $340,776,453 59.0% $497,481,772 118.3%
% Total Trade with Canada 20.3% 23.1% 31.0% 30.4% 0.34157737 27.7% 34.9% 7.2% 14.6%
9. Oklahoma Trading Relationships -- 2004 - 2010 Mexico
Domestic
Canada
2010 Leading Exports from Oklahoma to Canada (Surface 2010 2010 Leading Exports from Oklahoma to Canada (Surface 2010
Transportation) Transportation)
Rank Export Rank Alberta Export
1 84 Computer-Related Machinery and Parts $493,462,513 1 84 Computer-Related Machinery and Parts $196,677,438
2 27 Mineral Fuels; Oils and Waxes $236,666,575 2 73 Articles of Iron and Steel $48,254,332
3 40 Rubber and Articles $192,929,008 3 82 Tools of Base Metal $35,877,311
4 73 Articles of Iron and Steel $189,658,903 4 85 Electrical Machinery; Equipment and Parts $33,672,394
5 85 Electrical Machinery; Equipment and Parts $134,268,799 5 87 Vehicles Other than Railway $20,809,166
6 87 Vehicles Other than Railway $124,399,763 6 90 Measuring and Testing Instruments $13,612,207
7 39 Plastics and Articles $82,053,333 7 39 Plastics and Articles $6,682,627
8 82 Tools of Base Metal $43,814,782 8 38 Miscellaneous Chemical Products $5,543,263
9 16 Preparations of Fish and Meat $35,518,672 9 16 Preparations of Fish and Meat $5,411,439
10 88 Aircraft; Spacecraft and Parts $34,620,197 10 40 Rubber and Articles $4,733,237
2010 Leading Imports to Oklahoma from Canada (Surface 2010 2010 Leading Exports from Oklahoma to Canada (Surface 2010
Rank Export Rank British Colombia Export
1 27 Mineral Fuels; Oils and Waxes $461,070,539 1 84 Computer-Related Machinery and Parts $18,973,357
2 84 Computer-Related Machinery and Parts $305,062,801 2 73 Articles of Iron and Steel $13,304,994
3 39 Plastics and Articles $96,604,706 3 87 Vehicles Other than Railway $5,369,960
4 73 Articles of Iron and Steel $80,896,123 4 35 Albuminoidal Substances; Glues and Enzymes $2,909,549
5 98 Special Classification Provisions $77,907,931 5 85 Electrical Machinery; Equipment and Parts $2,196,212
6 47 Pulp of Wood and Paperboard $55,987,889 6 18 Cocoa and Cocoa Preparations $1,860,676
7 85 Electrical Machinery; Equipment and Parts $49,863,566 7 39 Plastics and Articles $1,852,515
8 48 Paper and Paperboard $37,385,169 8 90 Measuring and Testing Instruments $1,578,047
9 2 Meat and Edible Offal $29,382,462 9 82 Tools of Base Metal $1,440,304
10 90 Measuring and Testing Instruments $28,576,506 10 16 Preparations of Fish and Meat $960,585
2010 Leading Exports from Oklahoma to Canada (Surface 2010
Rank Saskatchewan Export
1 84 Computer-Related Machinery and Parts $94,052,110
2 27 Mineral Fuels; Oils and Waxes $53,987,367
3 73 Articles of Iron and Steel $43,696,547
4 87 Vehicles Other than Railway $17,146,264
5 85 Electrical Machinery; Equipment and Parts $4,938,418
6 39 Plastics and Articles $3,180,389
7 38 Miscellaneous Chemical Products $3,124,209
8 90 Measuring and Testing Instruments $1,824,973
9 40 Rubber and Articles $1,556,639
10 16 Preparations of Fish and Meat $620,084