Download as PDF, PPTX
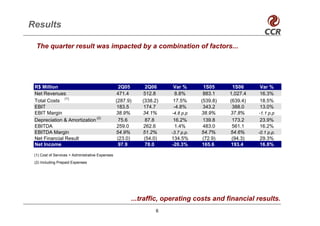
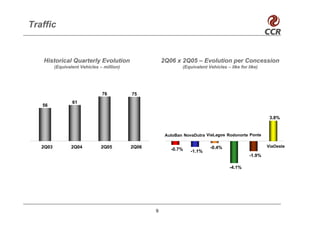
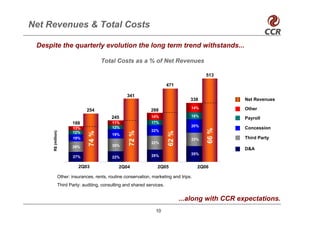
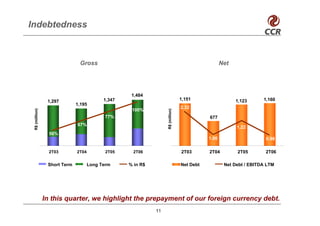
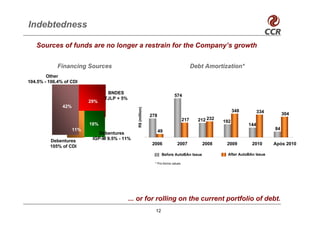
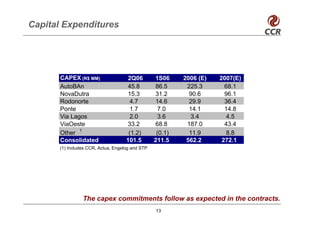


CCR's 2Q06 results showed an 8.8% increase in net operating income compared to 2Q05, reaching R$512.8 million, with the number of electronic toll collection users increasing 25.3% to 599 thousand. Total costs increased 17.5% compared to 2Q05. EBIT decreased 4.8% to R$174.7 million due to factors including traffic, operating costs and financial results. CCR's entrance to the IBOVESPA stock index in March 2006 and prepayment of foreign currency debt were highlighted as subsequent positive events.


