Disclaimer
Thispresentation contains forward-looking statements regarding the
prospects of the business, estimates for operating and financial results, and
those regarding Cia. Hering's growth prospects. These are merely projections
and, as such, are based exclusively on the expectations of Cia. Hering
management concerning the future of the business and its continued access
to capital to fund the Company’s business plan. Such forward-looking
statements depend, substantially, on changes in market
conditions, government regulations, competitive pressures, the performance
of the Brazilian economy and the industry, among other factors and risks
disclosed in Cia. Hering’s filed disclosure documents and
are, therefore, subject to change without prior notice.
Highlights
MAIN INDICATORS
Total GrossRevenue totaled R$ 233.8 million in the 1Q10 (+38.2%)
Same-
Same-store sales in the HS chain: + 26.6%
Two-
Two-digit sales growth for the three brands
EBITDA up 126.5% (R$ 47.2 million with 24.3% of EBITDA margin)
Cash Gross Margin of 49.5% with expansion of 6.2 p.p.
OTHER HIGHLIGHTS
Opening of 2 Hering Stores in the 1Q10
Same Store Sales of 14.4% in the PUC chain
2010 CapEx: R$ 58.7 million
1Q10 ends up with Free Cash Flow of +R$ 77.0 million
Sales Performance
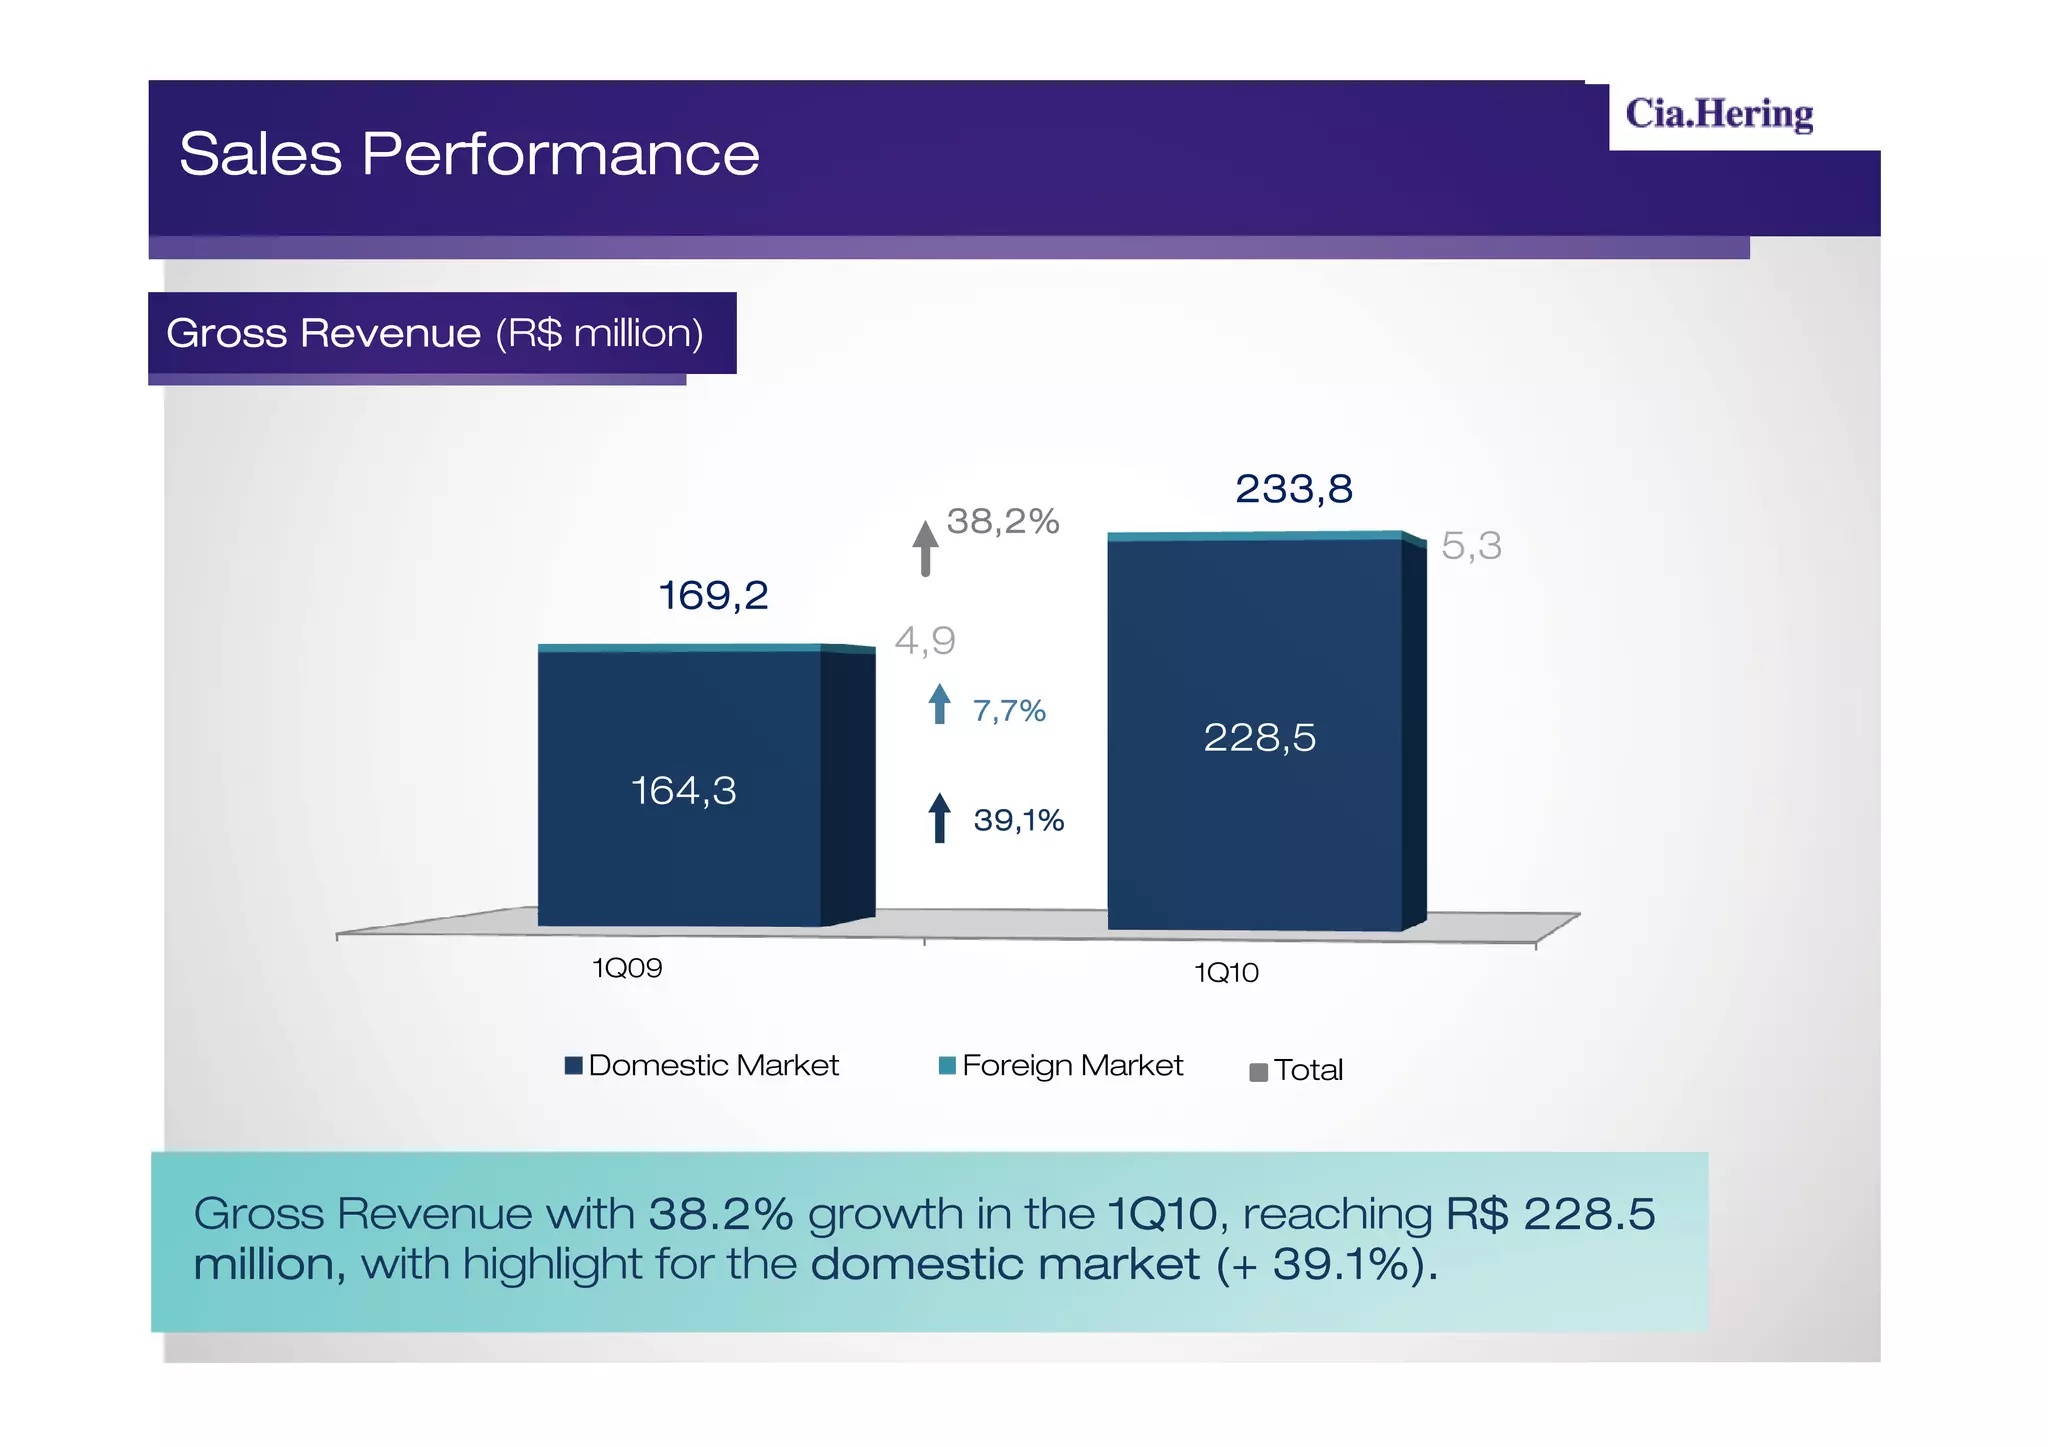
Gross Revenue(R$ million)
233,8
38,2%
5,3
169,2
4,9
7,7%
228,5
164,3
39,1%
1Q09 1Q10
Domestic Market Foreign Market Total
Gross Revenue with 38.2% growth in the 1Q10 reaching R$ 228.5
1Q10,
million,
million, with highlight for the domestic market (+ 39.1%).
7.
Sales Performance (cont.)
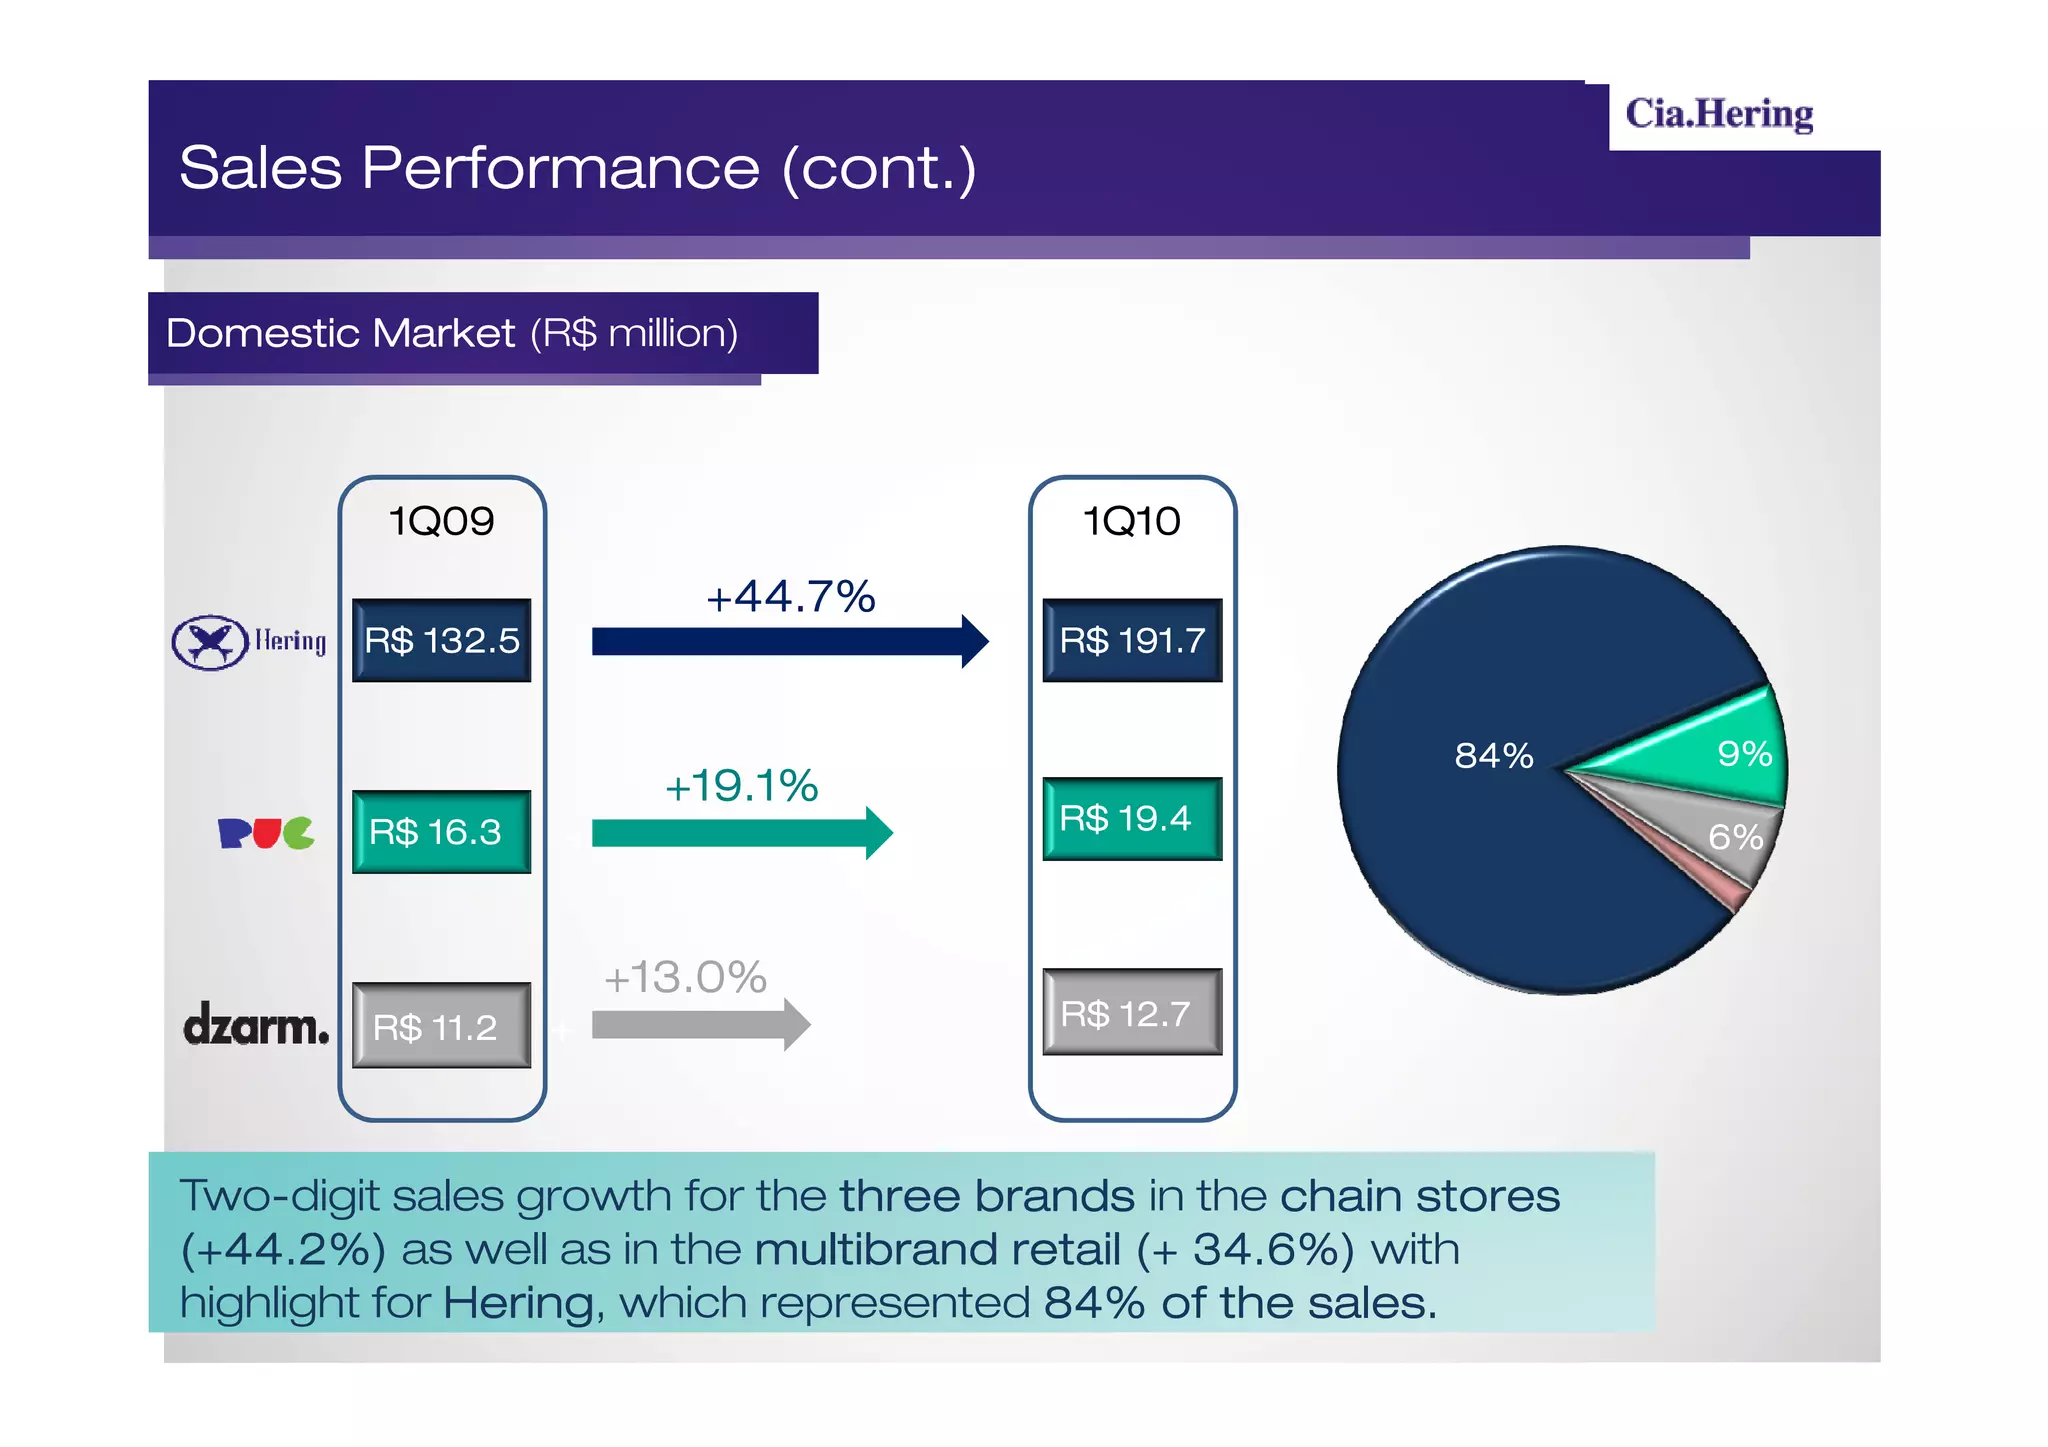
DomesticMarket (R$ million)
1Q09 1Q10
+44.7%
R$ 132.5 R$ 191.7
84% 9%
+19.1%
R$ 16.3 R$ 19.4
+ 6%
+13.0%
R$ 11.2 R$ 12.7
+
Two-digit sales growth for the three brands in the chain stores
(+44.2%) as well as in the multibrand retail (+ 34.6%) with
highlight for Hering which represented 84% of the sales.
Hering, sales.
8.
Distribution Chain -Hering Store and PUC
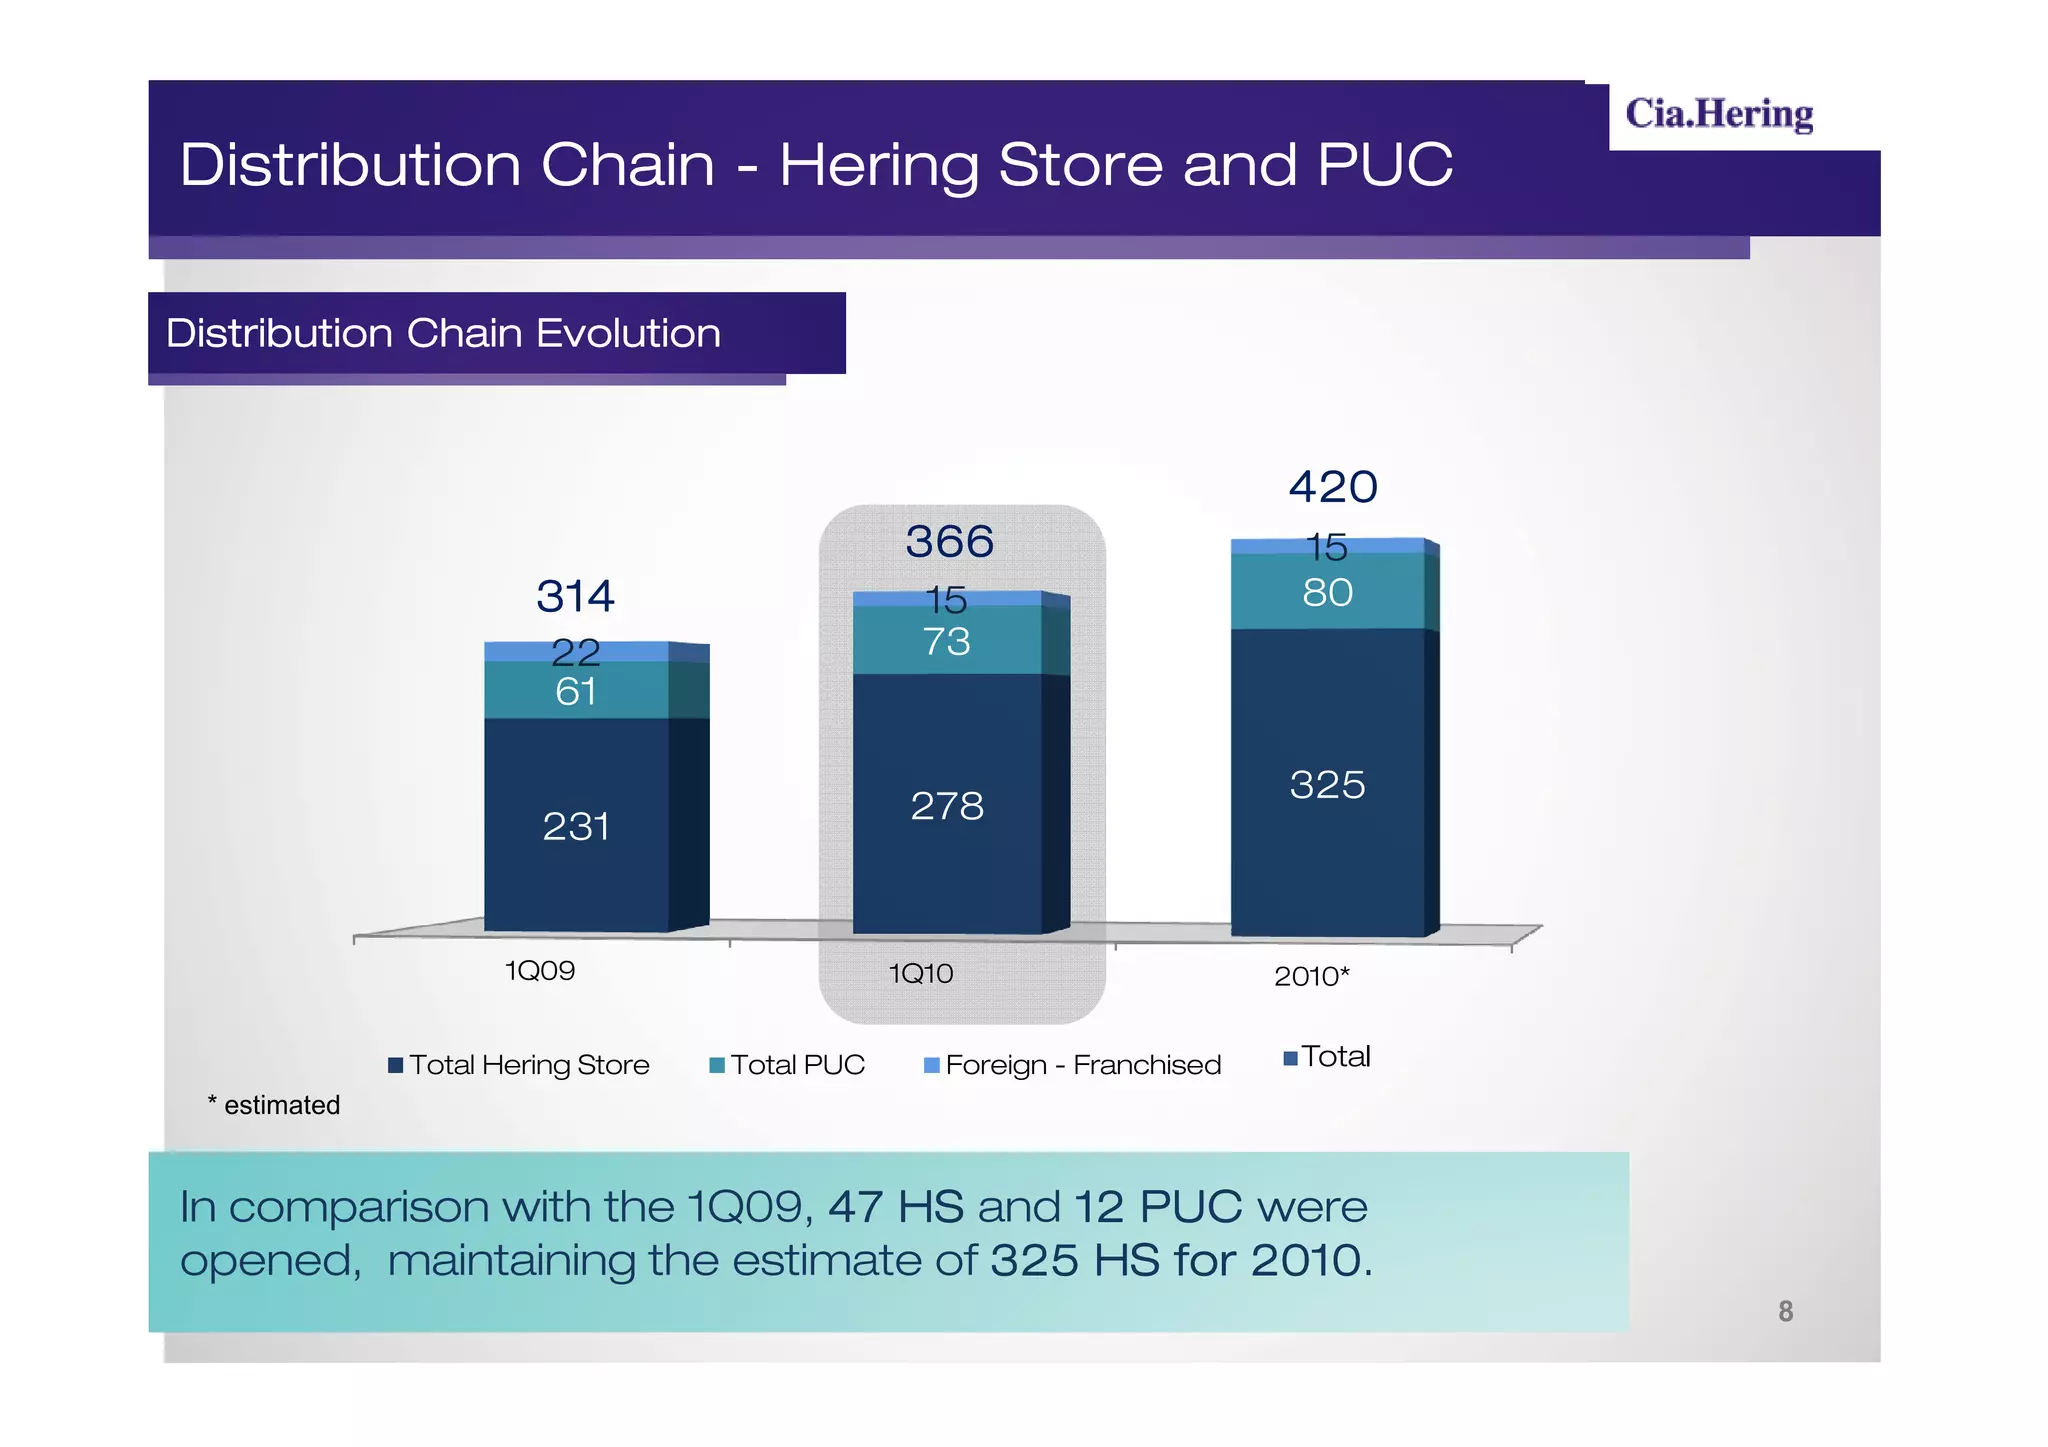
Distribution Chain Evolution
420
366 15
314 15 80
22 73
61
325
278
231
1Q09 1Q10 2010*
Total Hering Store Total PUC Foreign - Franchised Total
* estimated
In comparison with the 1Q09, 47 HS and 12 PUC were
opened, maintaining the estimate of 325 HS for 2010
2010.
8
9.
Hering Store ChainPerformance
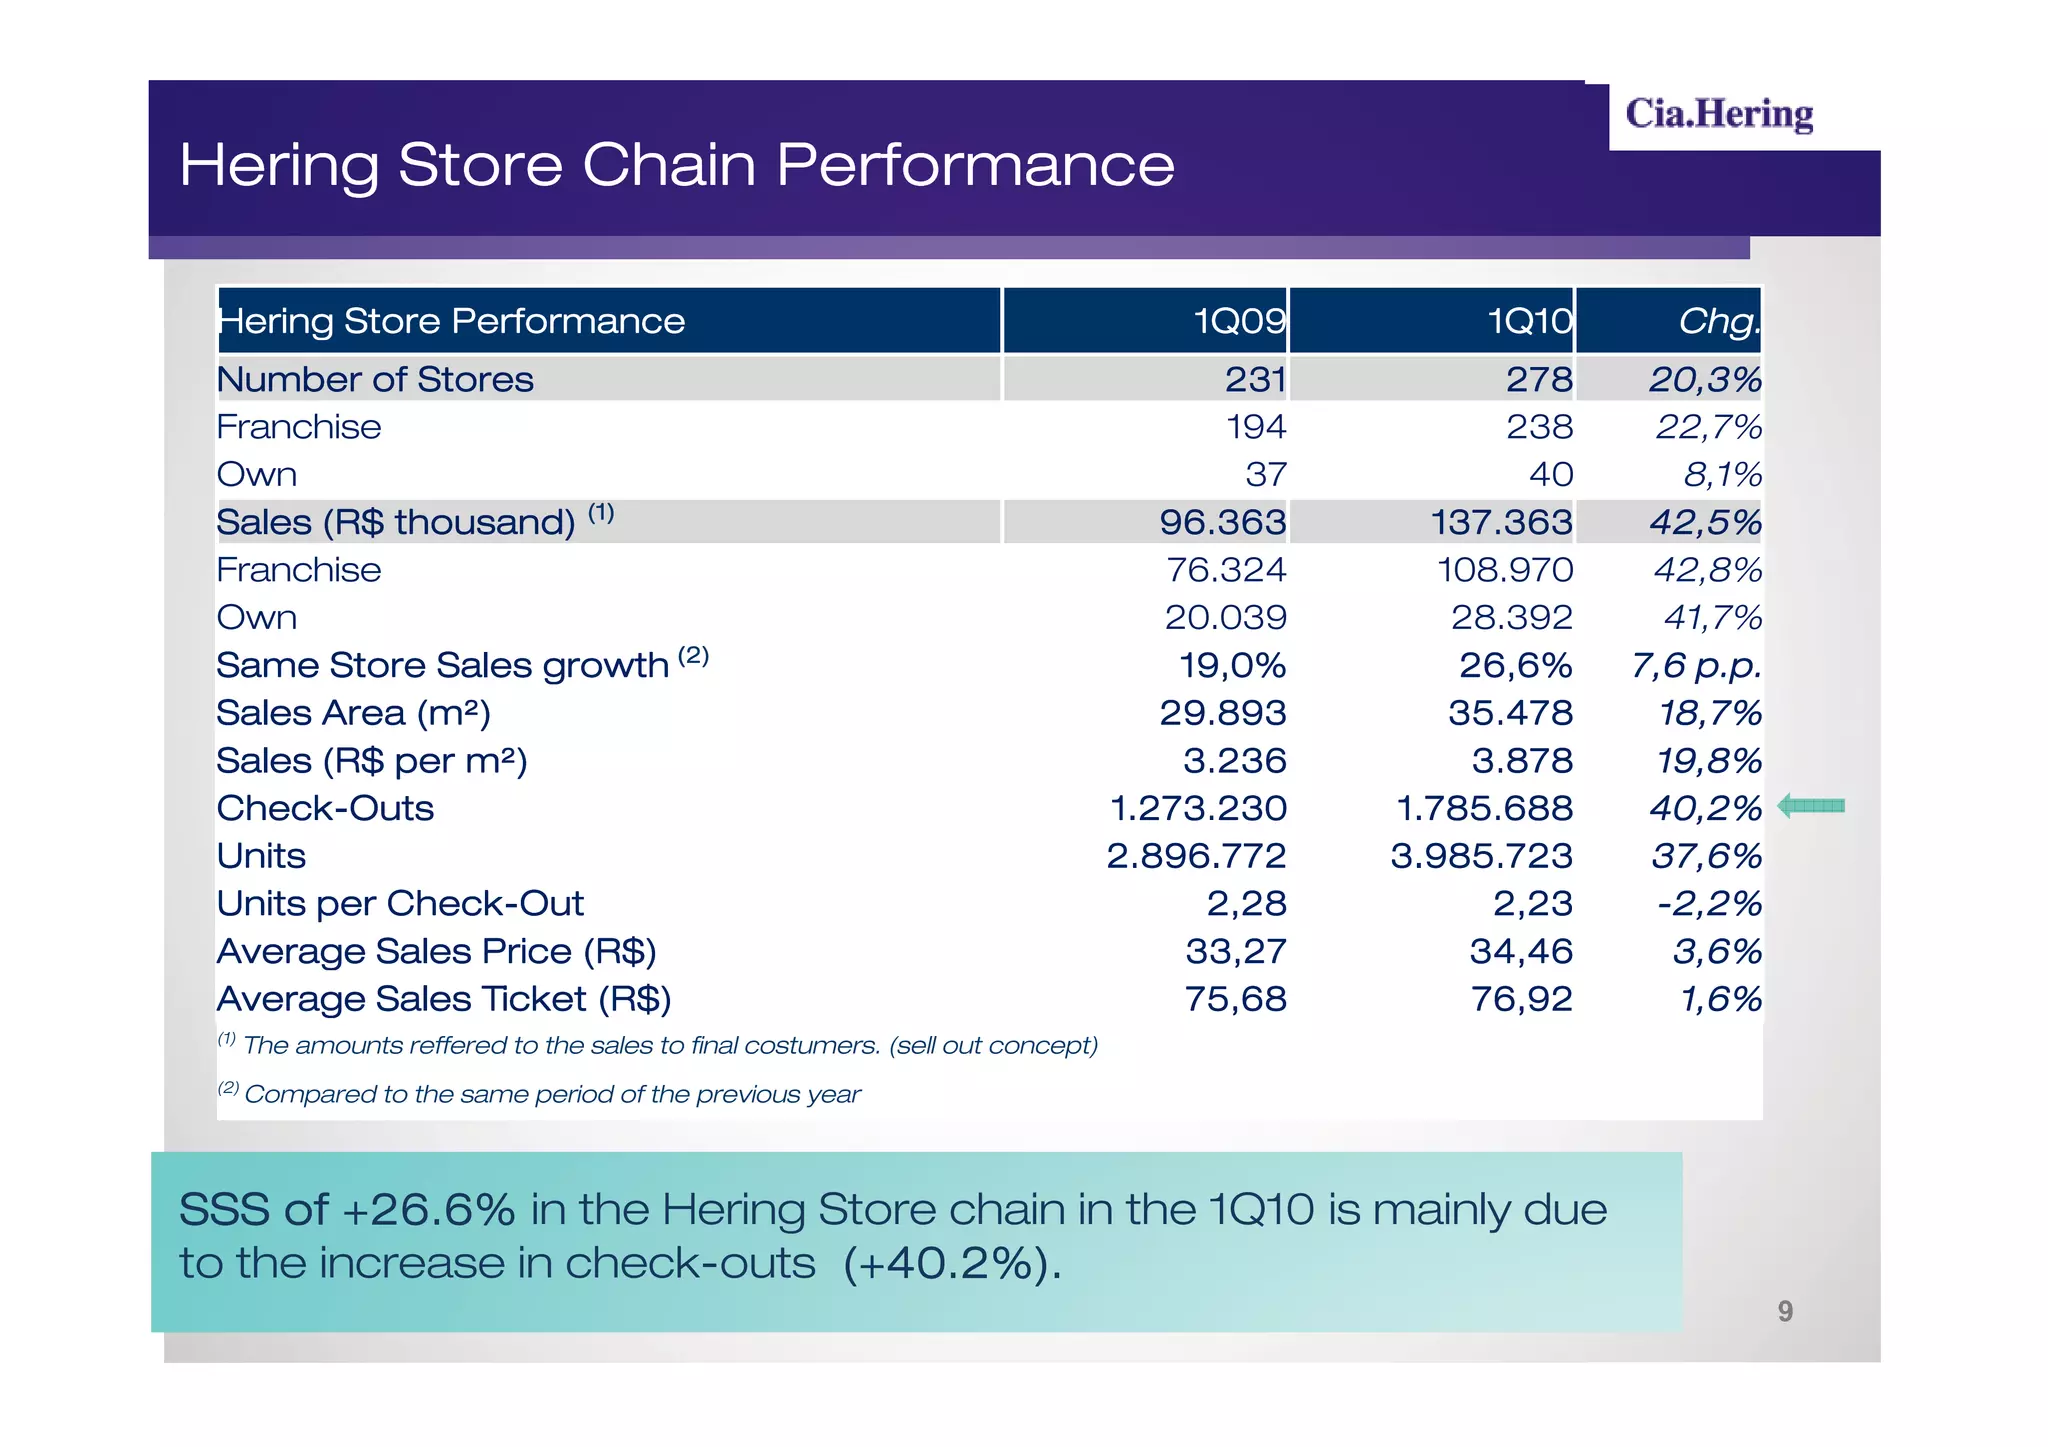
Hering Store Performance 1Q09 1Q10 Chg.
Number of Stores 231 278 20,3%
Franchise 194 238 22,7%
Own 37 40 8,1%
Sales (R$ thousand) (1)
thousand) 96.363 137.363 42,5%
Franchise 76.324 108.970 42,8%
Own 20.039 28.392 41,7%
Same Store Sales growth (2) 19,0% 26,6% 7,6 p.p.
m²)
Sales Area (m²) 29.893 35.478 18,7%
m²)
Sales (R$ per m²) 3.236 3.878 19,8%
Check-
Check-Outs 1.273.230 1.785.688 40,2%
Units 2.896.772 3.985.723 37,6%
Check-
Units per Check-Out 2,28 2,23 -2,2%
Average Sales Price (R$) 33,27 34,46 3,6%
Average Sales Ticket (R$) 75,68 76,92 1,6%
(1)
The amounts reffered to the sales to final costumers. (sell out concept)
(2)
Compared to the same period of the previous year
SSS of +26.6% in the Hering Store chain in the 1Q10 is mainly due
to the increase in check-outs (+40.2%).
9
Gross Profit andGross Margin
(R$ million)
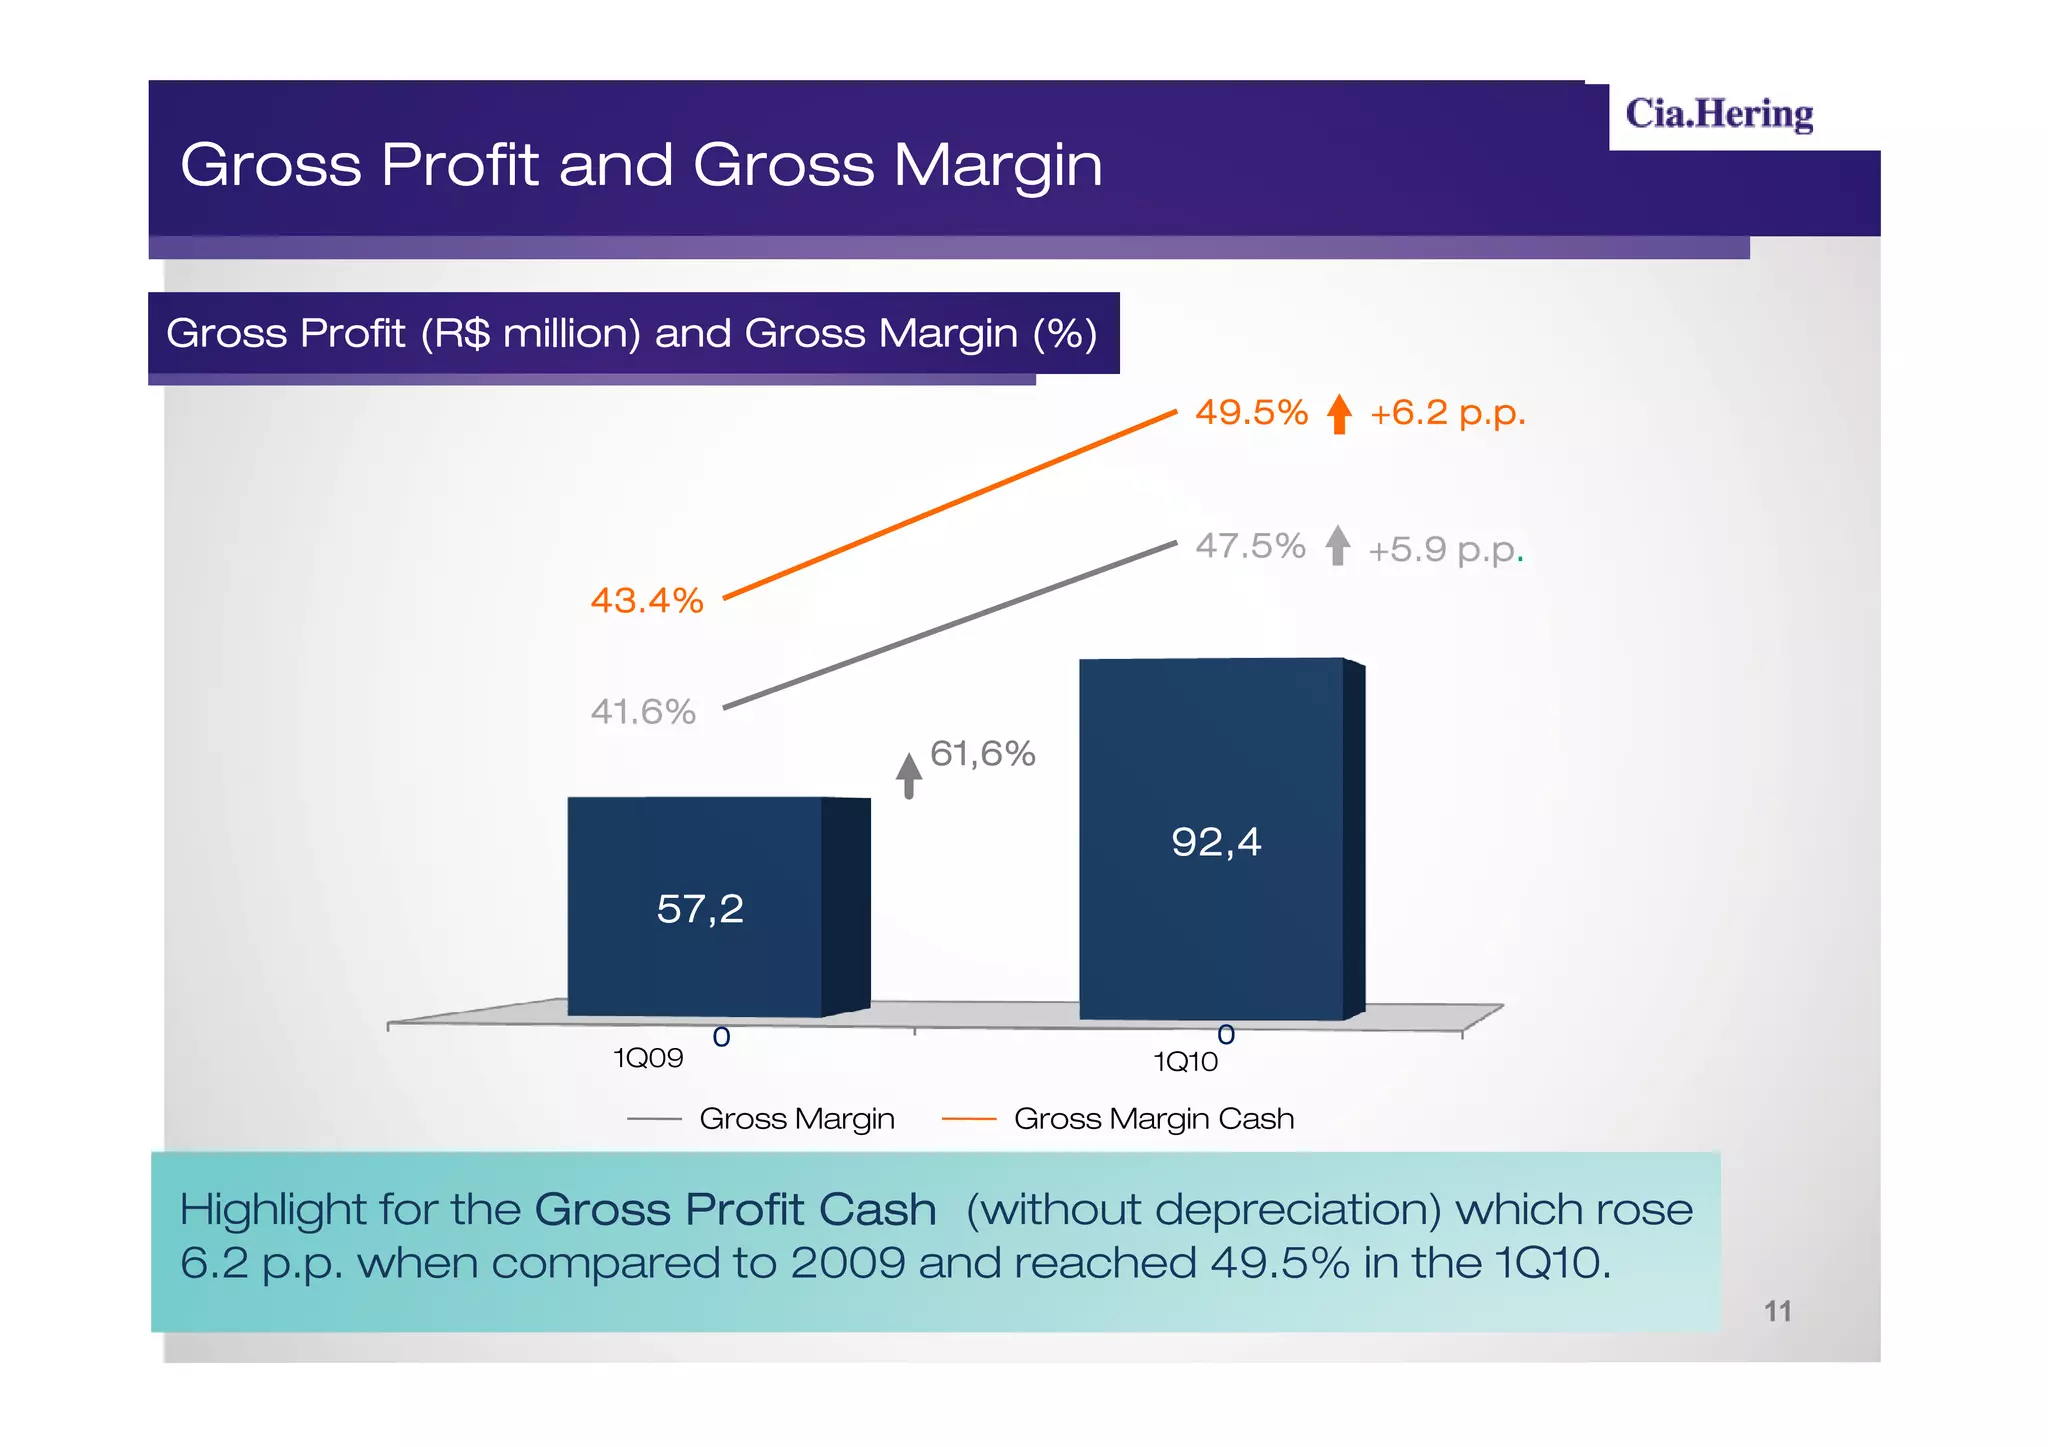
Gross Profit (R$ million) and Gross Margin (%)
49.5% +6.2 p.p.
47.5% p.p.
+5.9 p.p.
43.4%
41.6%
61,6%
92,4
57,2
0 0
1Q09 1Q10
Gross Margin Gross Margin Cash
Highlight for the Gross Profit Cash (without depreciation) which rose
6.2 p.p. when compared to 2009 and reached 49.5% in the 1Q10.
11
12.
EBITDA and EBITDAMargin
(R$ million)
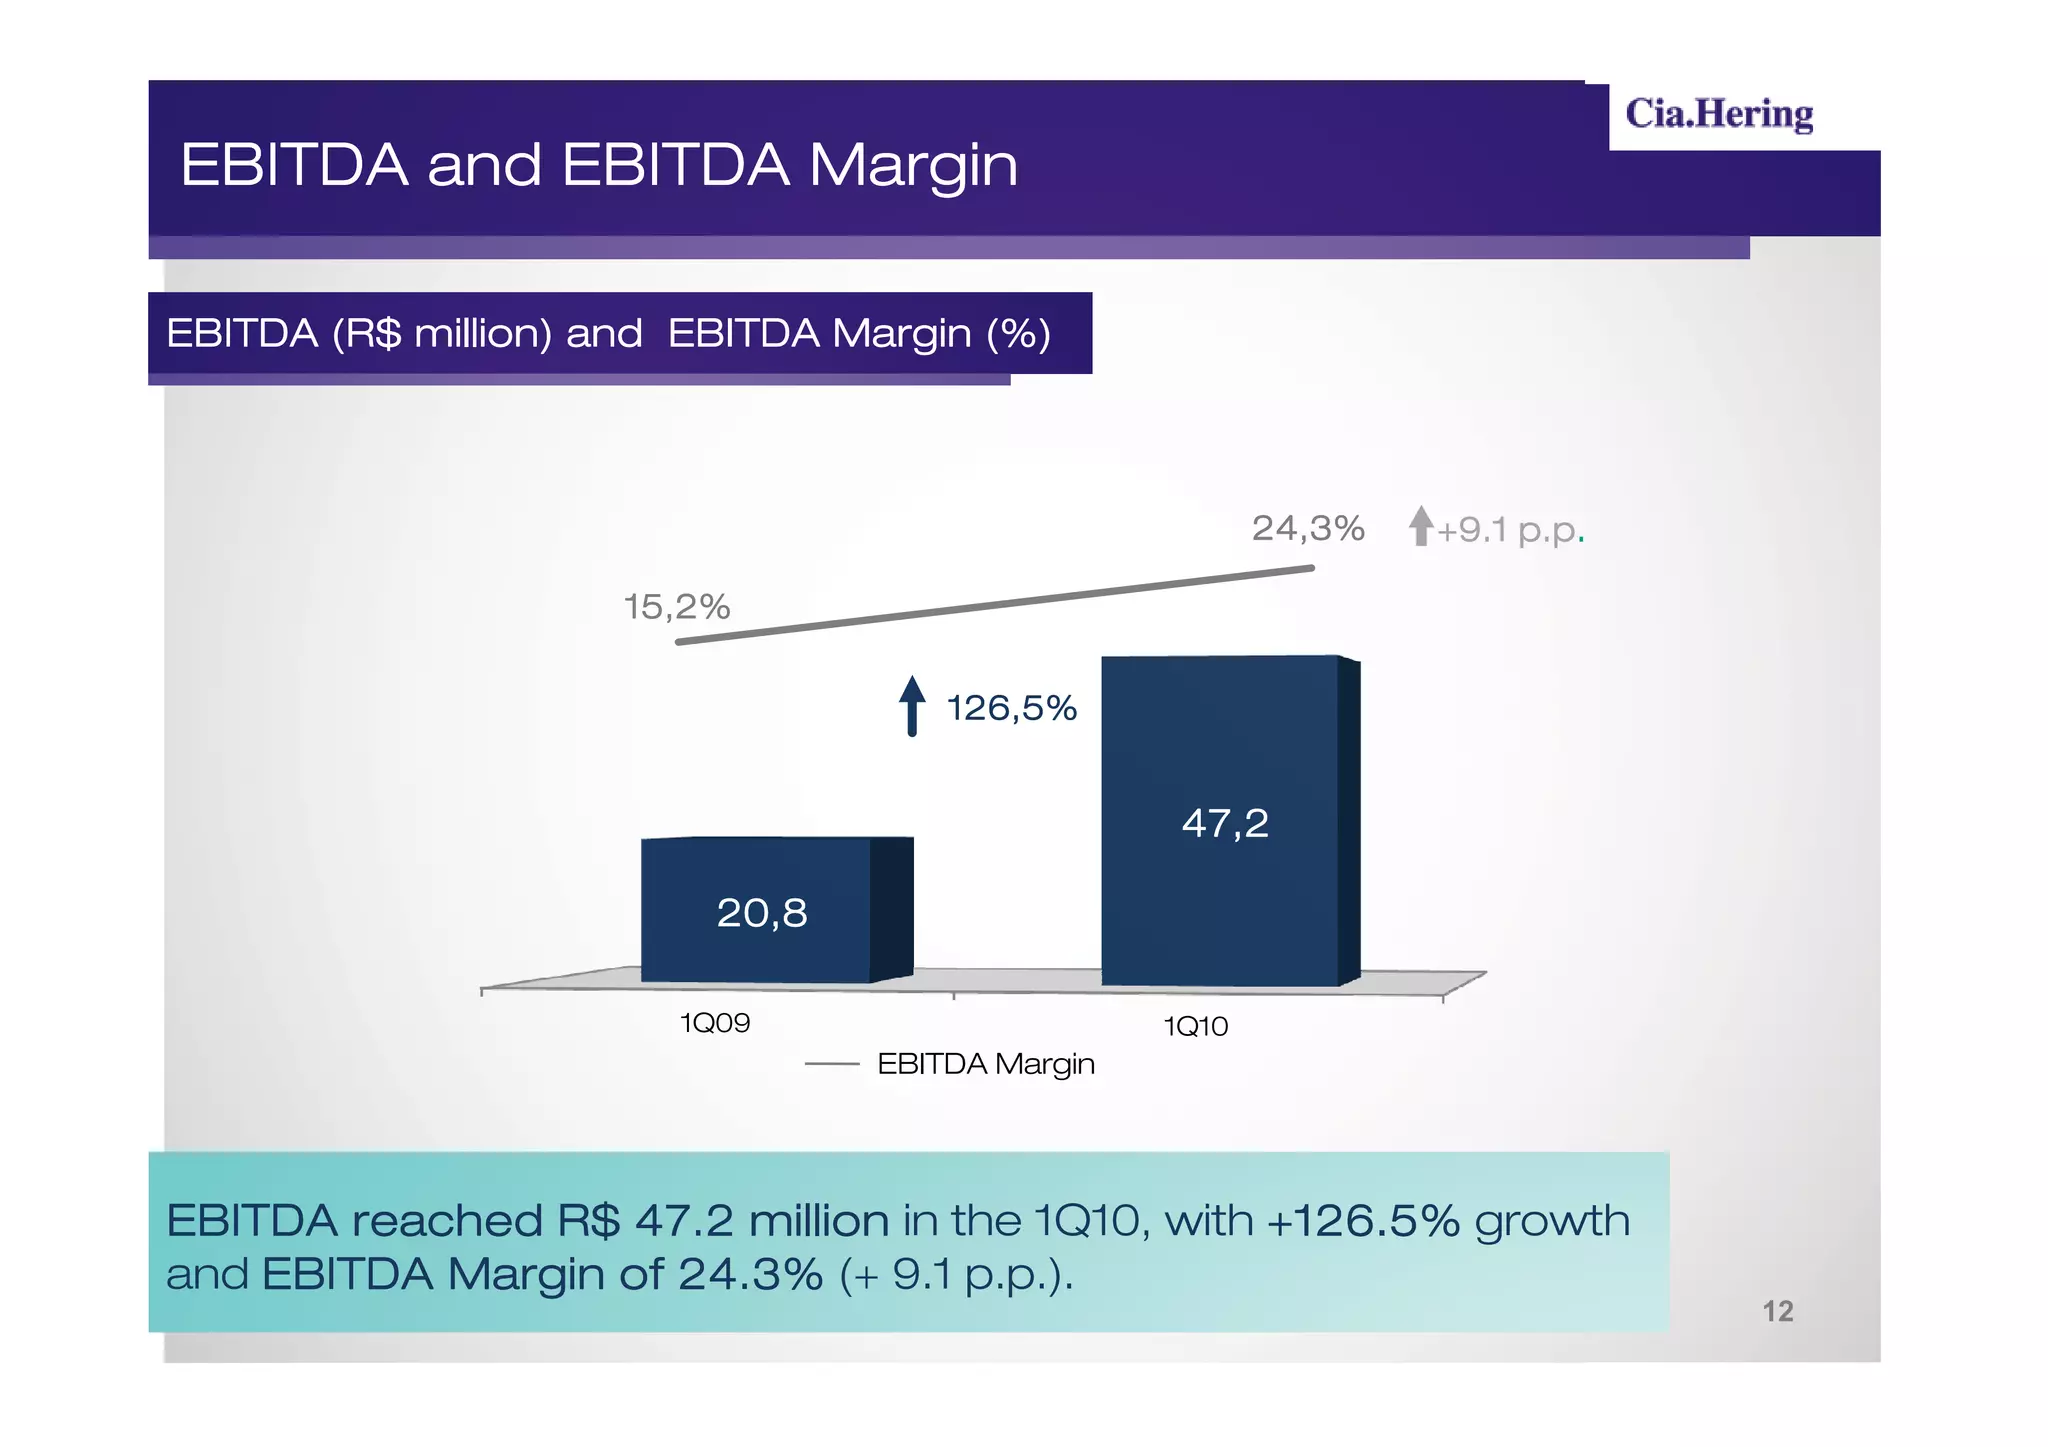
EBITDA (R$ million) and EBITDA Margin (%)
24,3% p.p.
+9.1 p.p.
15,2%
126,5%
47,2
20,8
1Q09 1Q10
EBITDA Margin
EBITDA reached R$ 47.2 million in the 1Q10, with +126.5% growth
and EBITDA Margin of 24.3% (+ 9.1 p.p.).
12
13.
EBITDA and EBITDAMargin (cont.)
(R$ million)
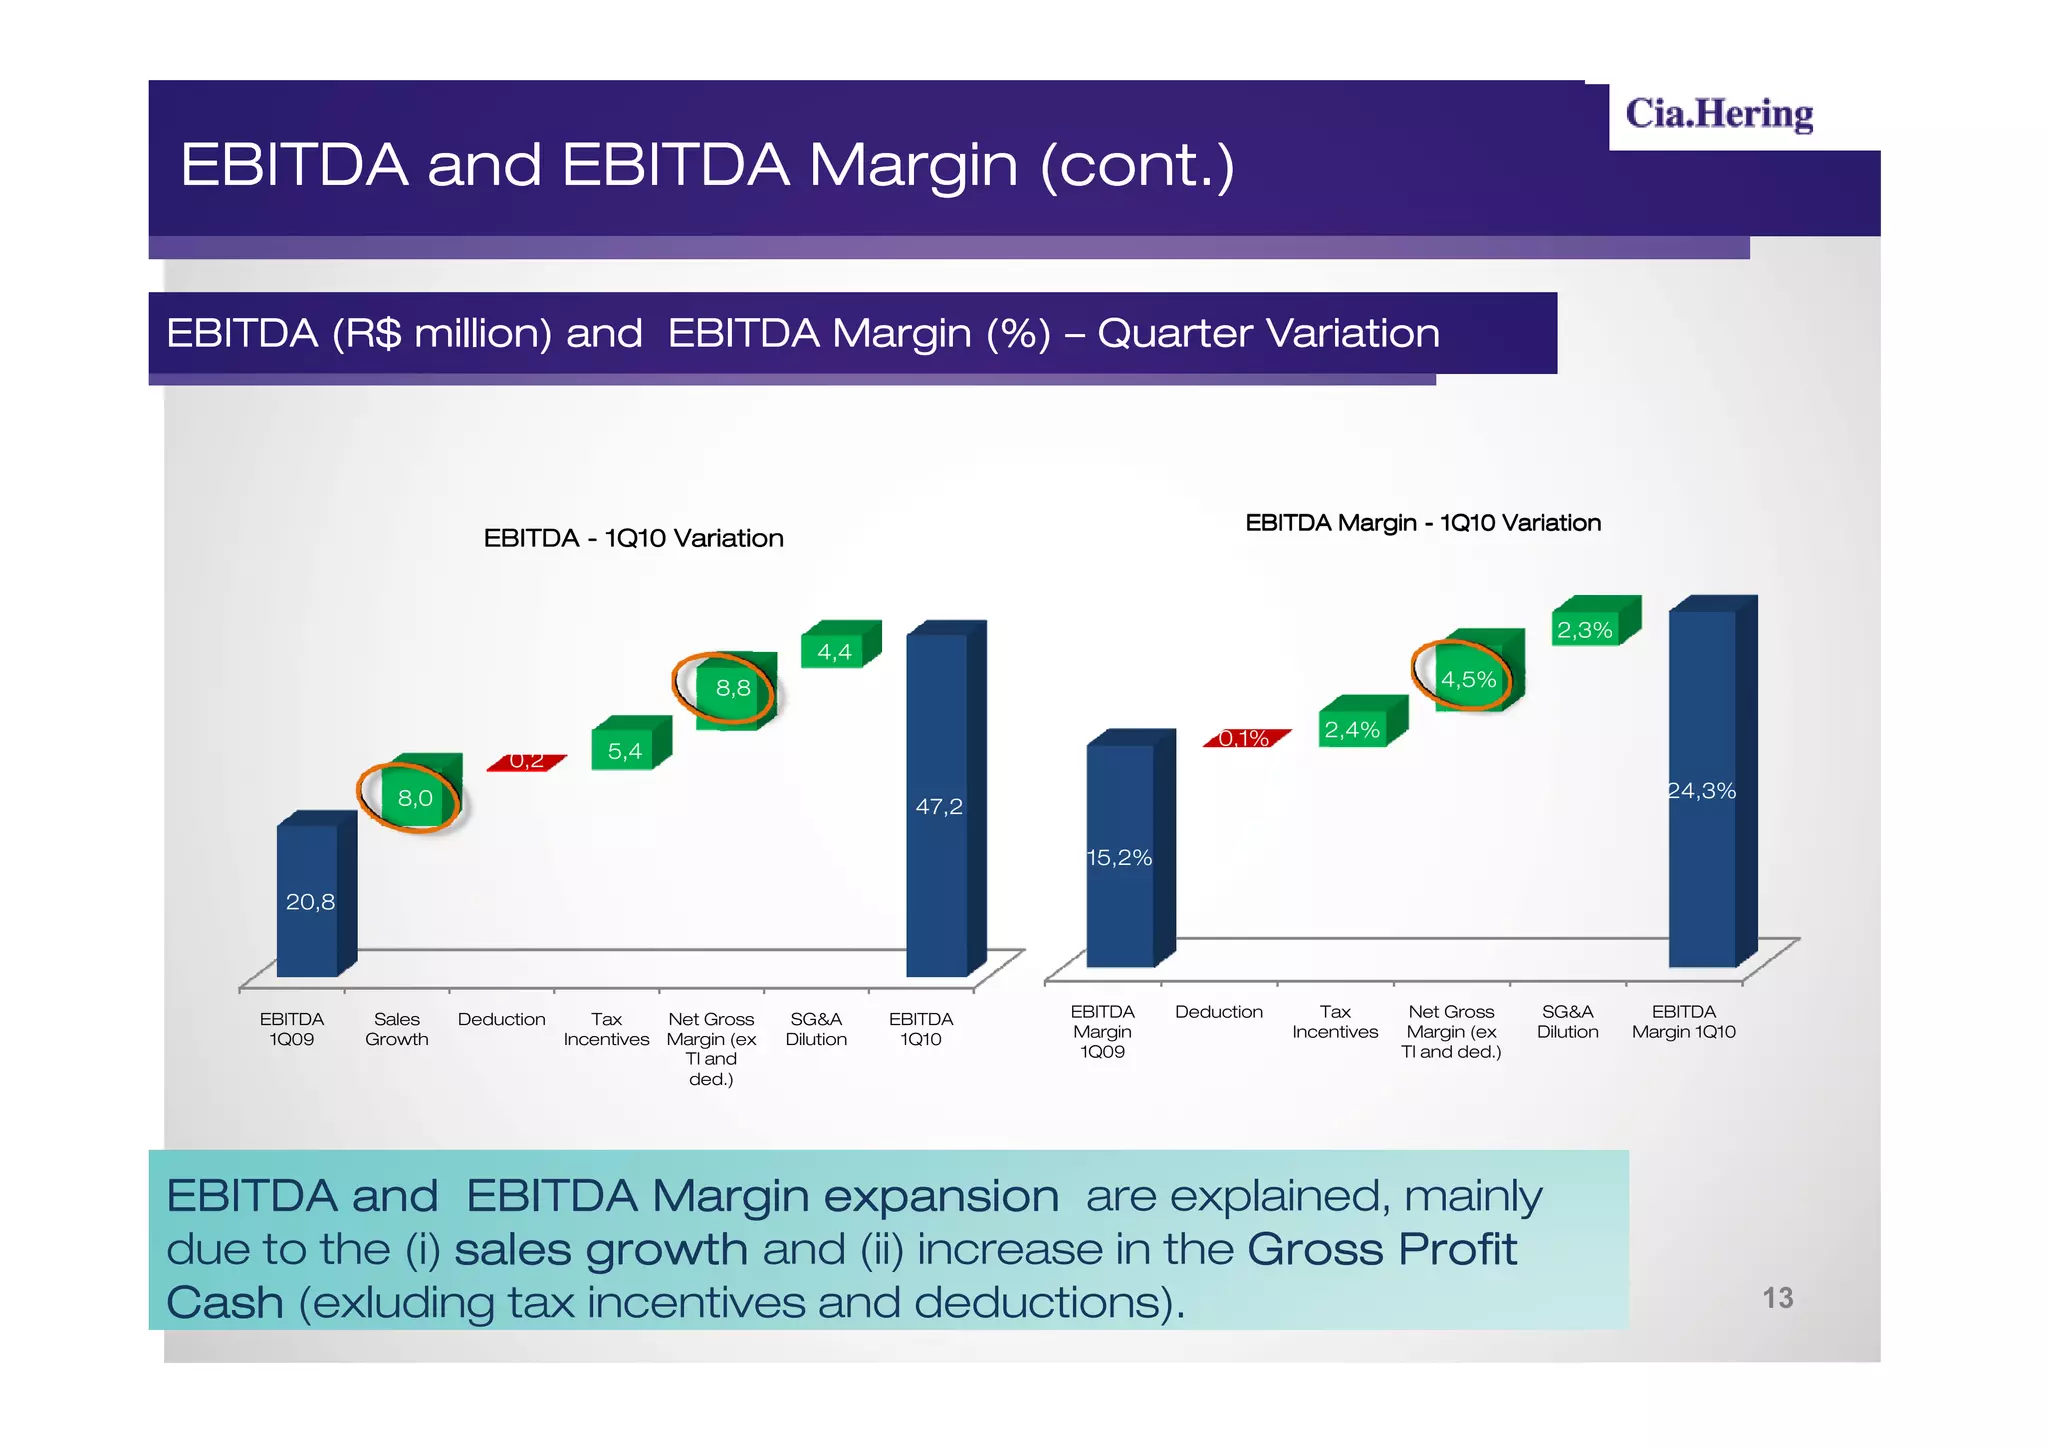
EBITDA (R$ million) and EBITDA Margin (%) – Quarter Variation
EBITDA Margin - 1Q10 Variation
EBITDA - 1Q10 Variation
2,3%
4,4
8,8 4,5%
0,1% 2,4%
0,2 5,4
8,0 24,3%
47,2
15,2%
20,8
EBITDA Sales Deduction Tax Net Gross SG&A EBITDA EBITDA Deduction Tax Net Gross SG&A EBITDA
1Q09 Growth Incentives Margin (ex Dilution 1Q10 Margin Incentives Margin (ex Dilution Margin 1Q10
TI and 1Q09 TI and ded.)
ded.)
EBITDA and EBITDA Margin expansion are explained, mainly
due to the (i) sales growth and (ii) increase in the Gross Profit
Cash (exluding tax incentives and deductions). 13
14.
Net Profit
(R$ million)
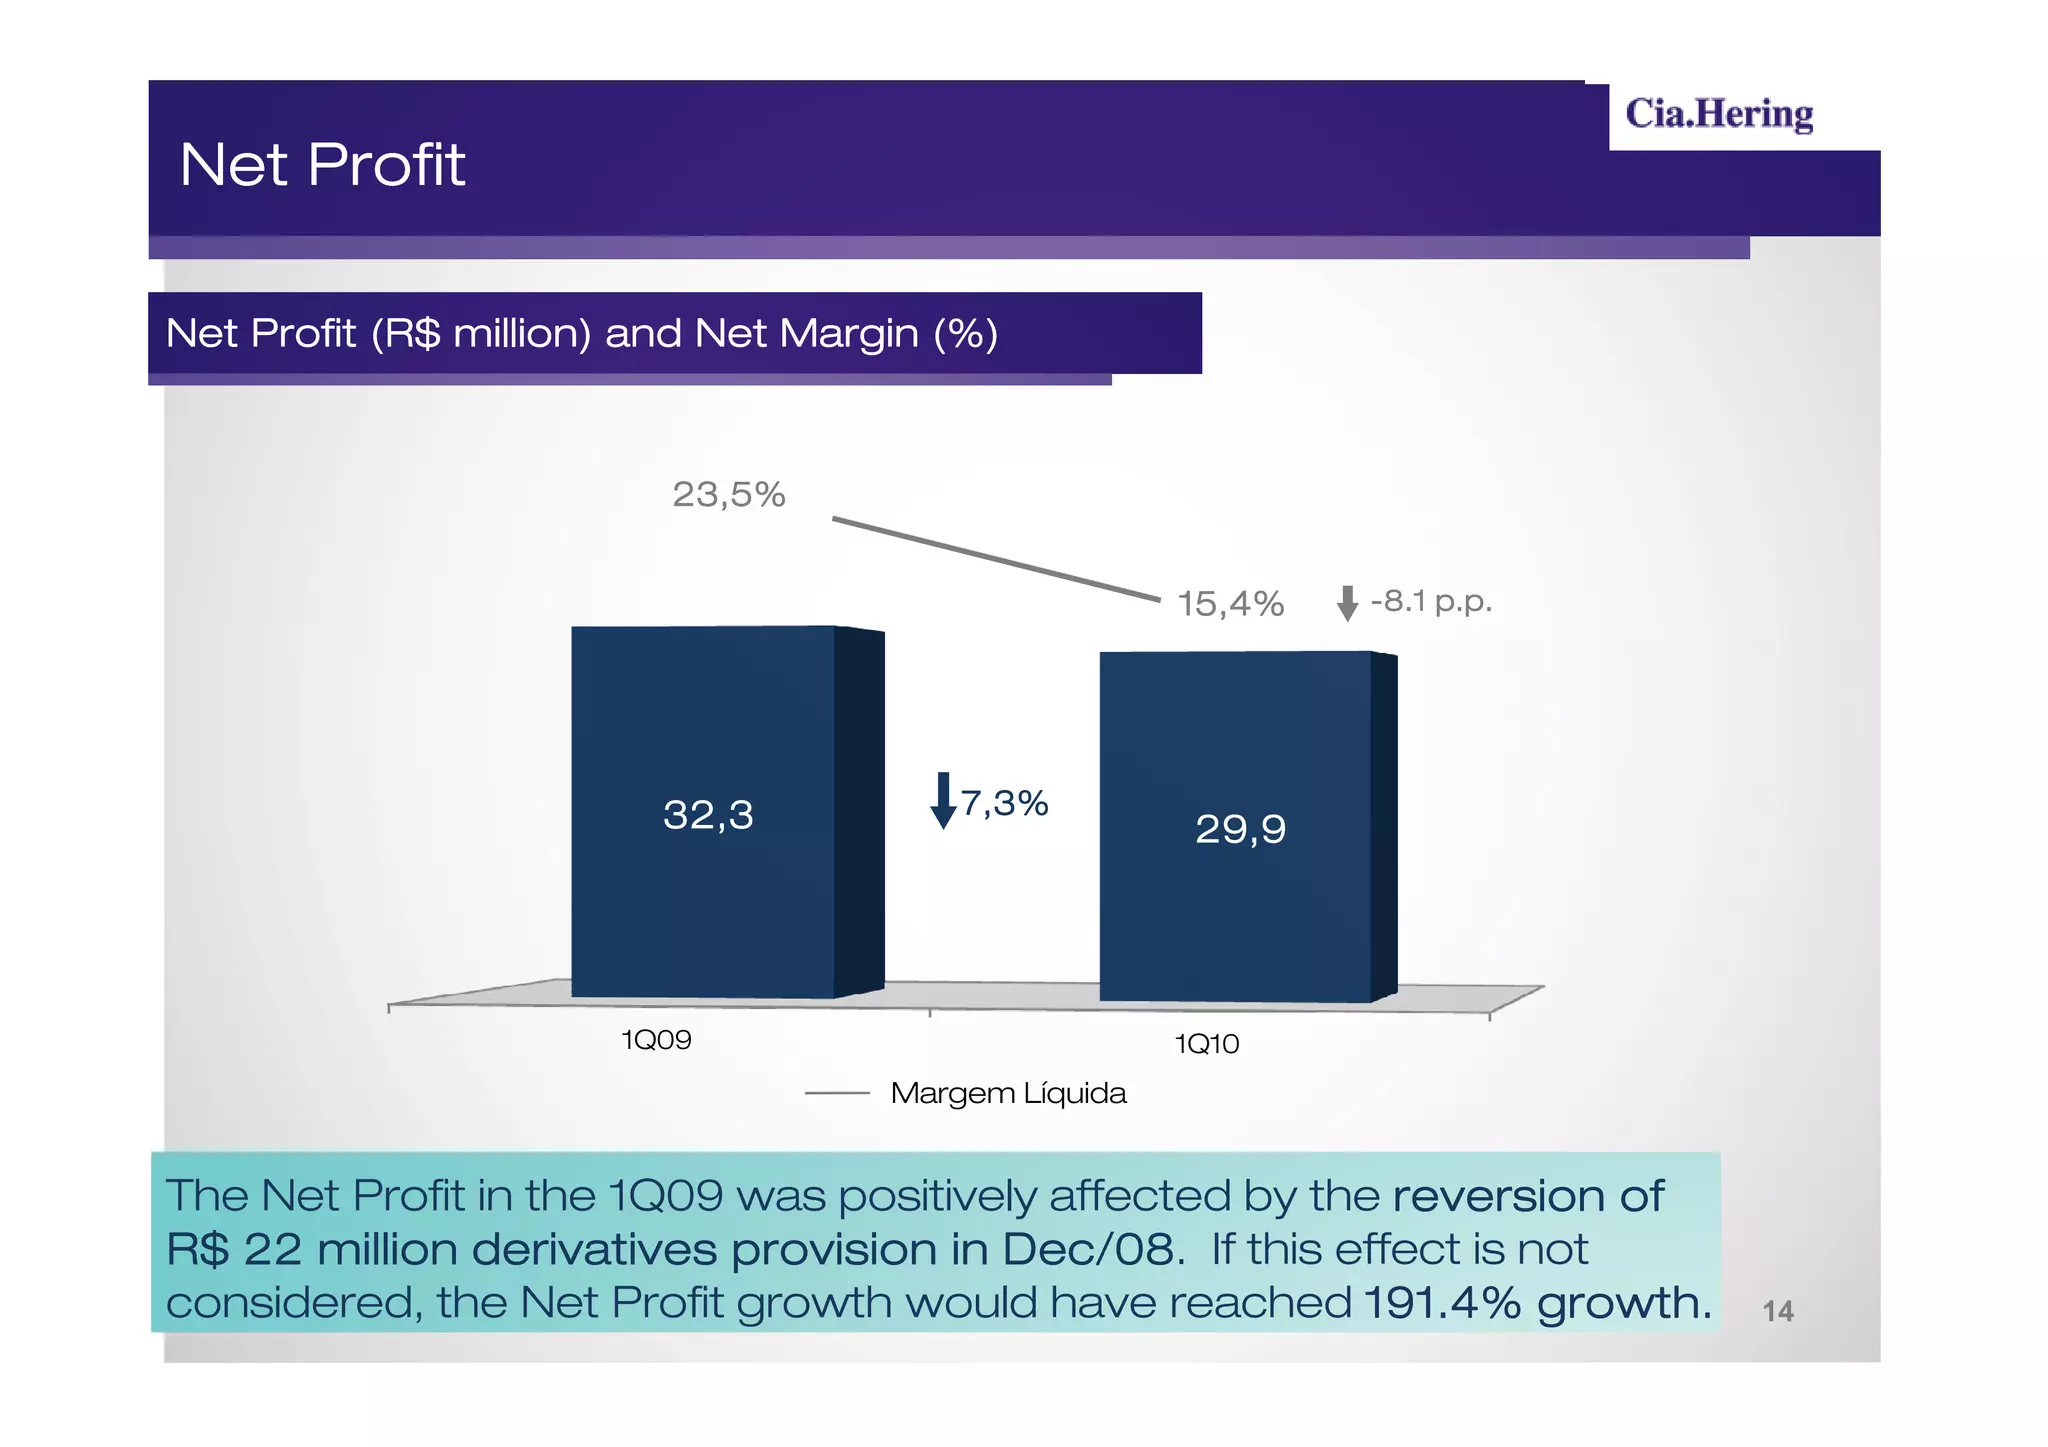
Net Profit (R$ million) and Net Margin (%)
23,5%
15,4%
15,4% -8.1 p.p.
32,3 7,3%
29,9
1Q09 1Q10
Margem Líquida
The Net Profit in the 1Q09 was positively affected by the reversion of
R$ 22 million derivatives provision in Dec/08 If this effect is not
Dec/08.
considered, the Net Profit growth would have reached 191.4% growth. 14
15.
CapEx
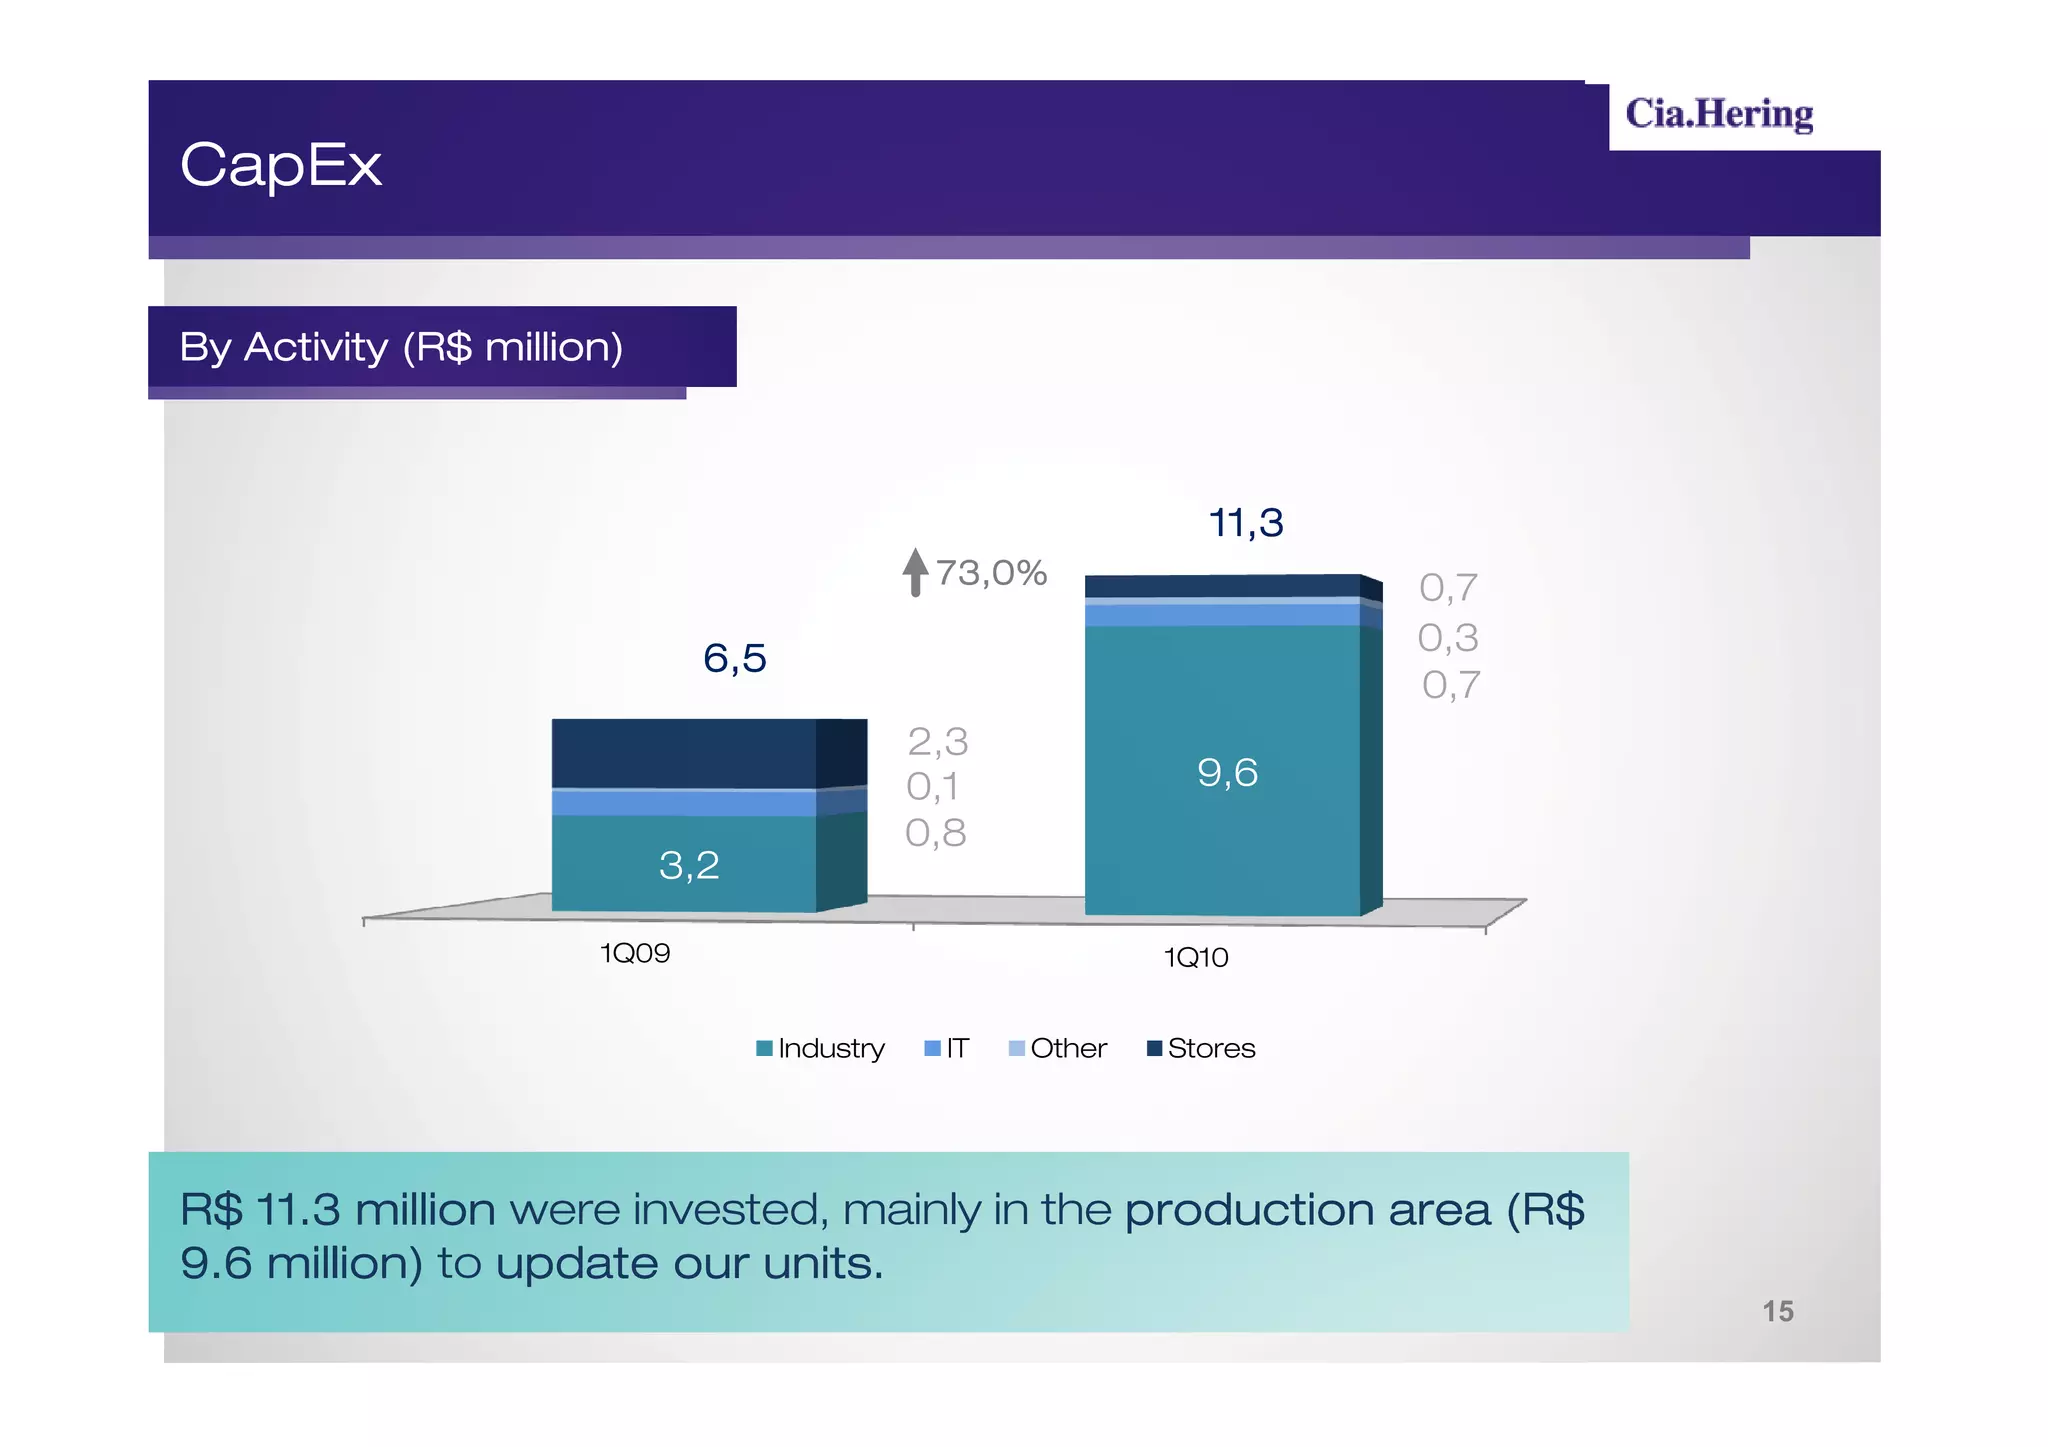
By Activity (R$million)
million)
11,3
73,0% 0,7
0,3
6,5
0,7
2,3
0,1 9,6
0,8
3,2
1Q09 1Q10
Industry IT Other Stores
R$ 11.3 million were invested, mainly in the production area (R$
9.6 million) to update our units.
million) units.
15
16.
Cash Flow
(R$ milllion)
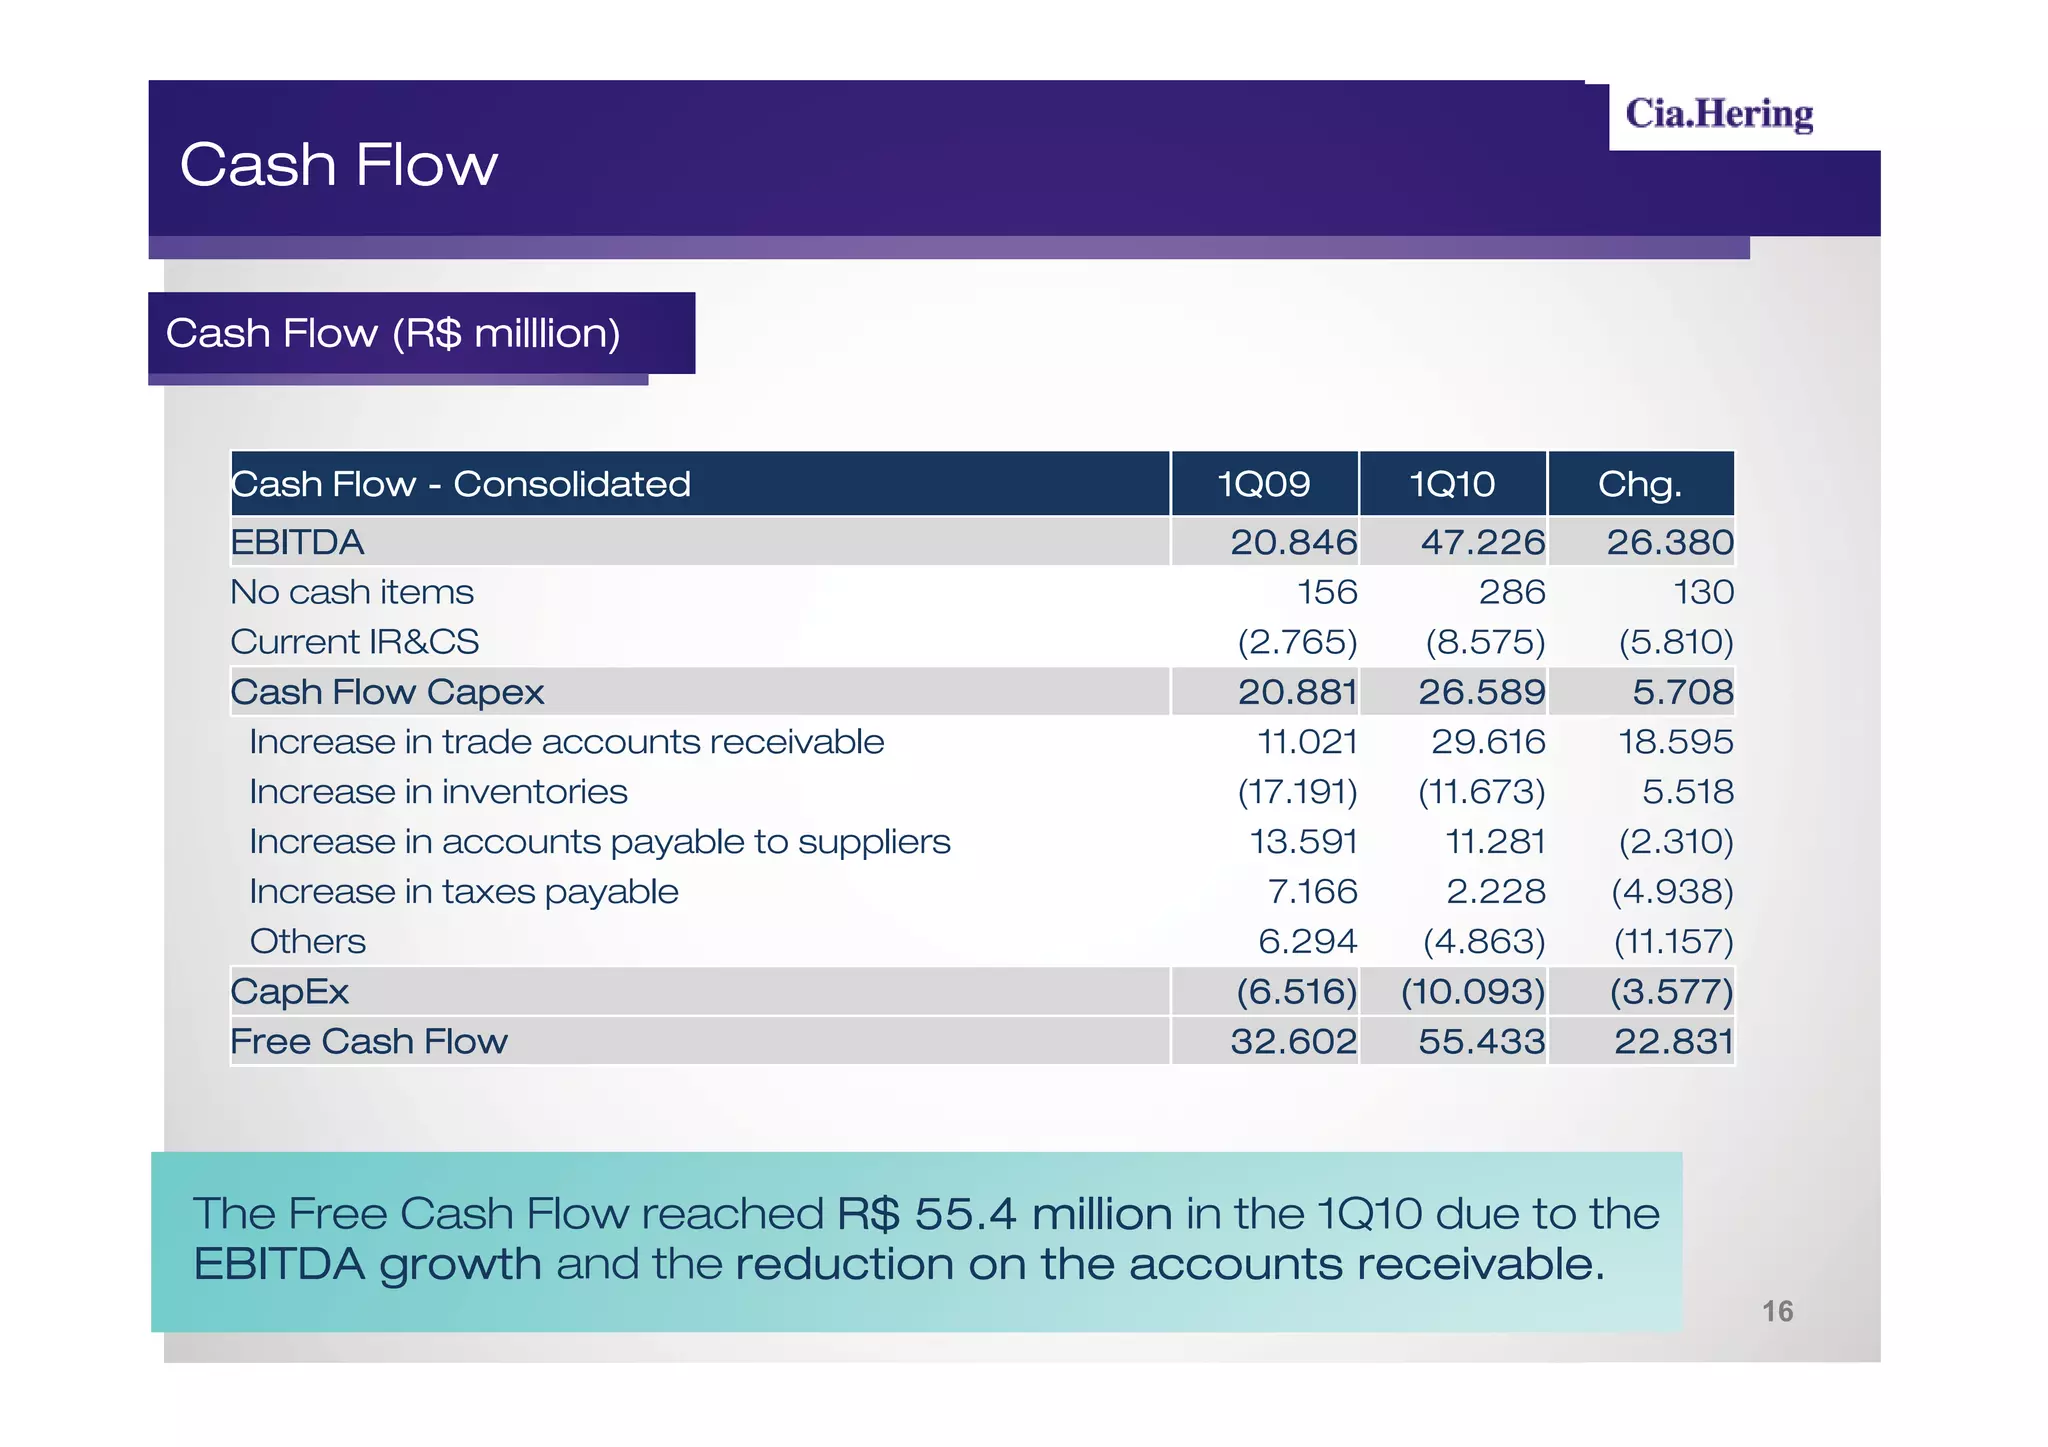
Cash Flow (R$ milllion)
Cash Flow - Consolidated 1Q09 1Q10 Chg.
EBITDA 20.846 47.226 26.380
No cash items 156 286 130
Current IR&CS (2.765) (8.575) (5.810)
Cash Flow Capex 20.881 26.589 5.708
Increase in trade accounts receivable 11.021 29.616 18.595
Increase in inventories (17.191) (11.673) 5.518
Increase in accounts payable to suppliers 13.591 11.281 (2.310)
Increase in taxes payable 7.166 2.228 (4.938)
Others 6.294 (4.863) (11.157)
CapEx (6.516) (10.093) (3.577)
Free Cash Flow 32.602 55.433 22.831
The Free Cash Flow reached R$ 55.4 million in the 1Q10 due to the
EBITDA growth and the reduction on the accounts receivable.
receivable.
16
17.
Indebtedness
million)
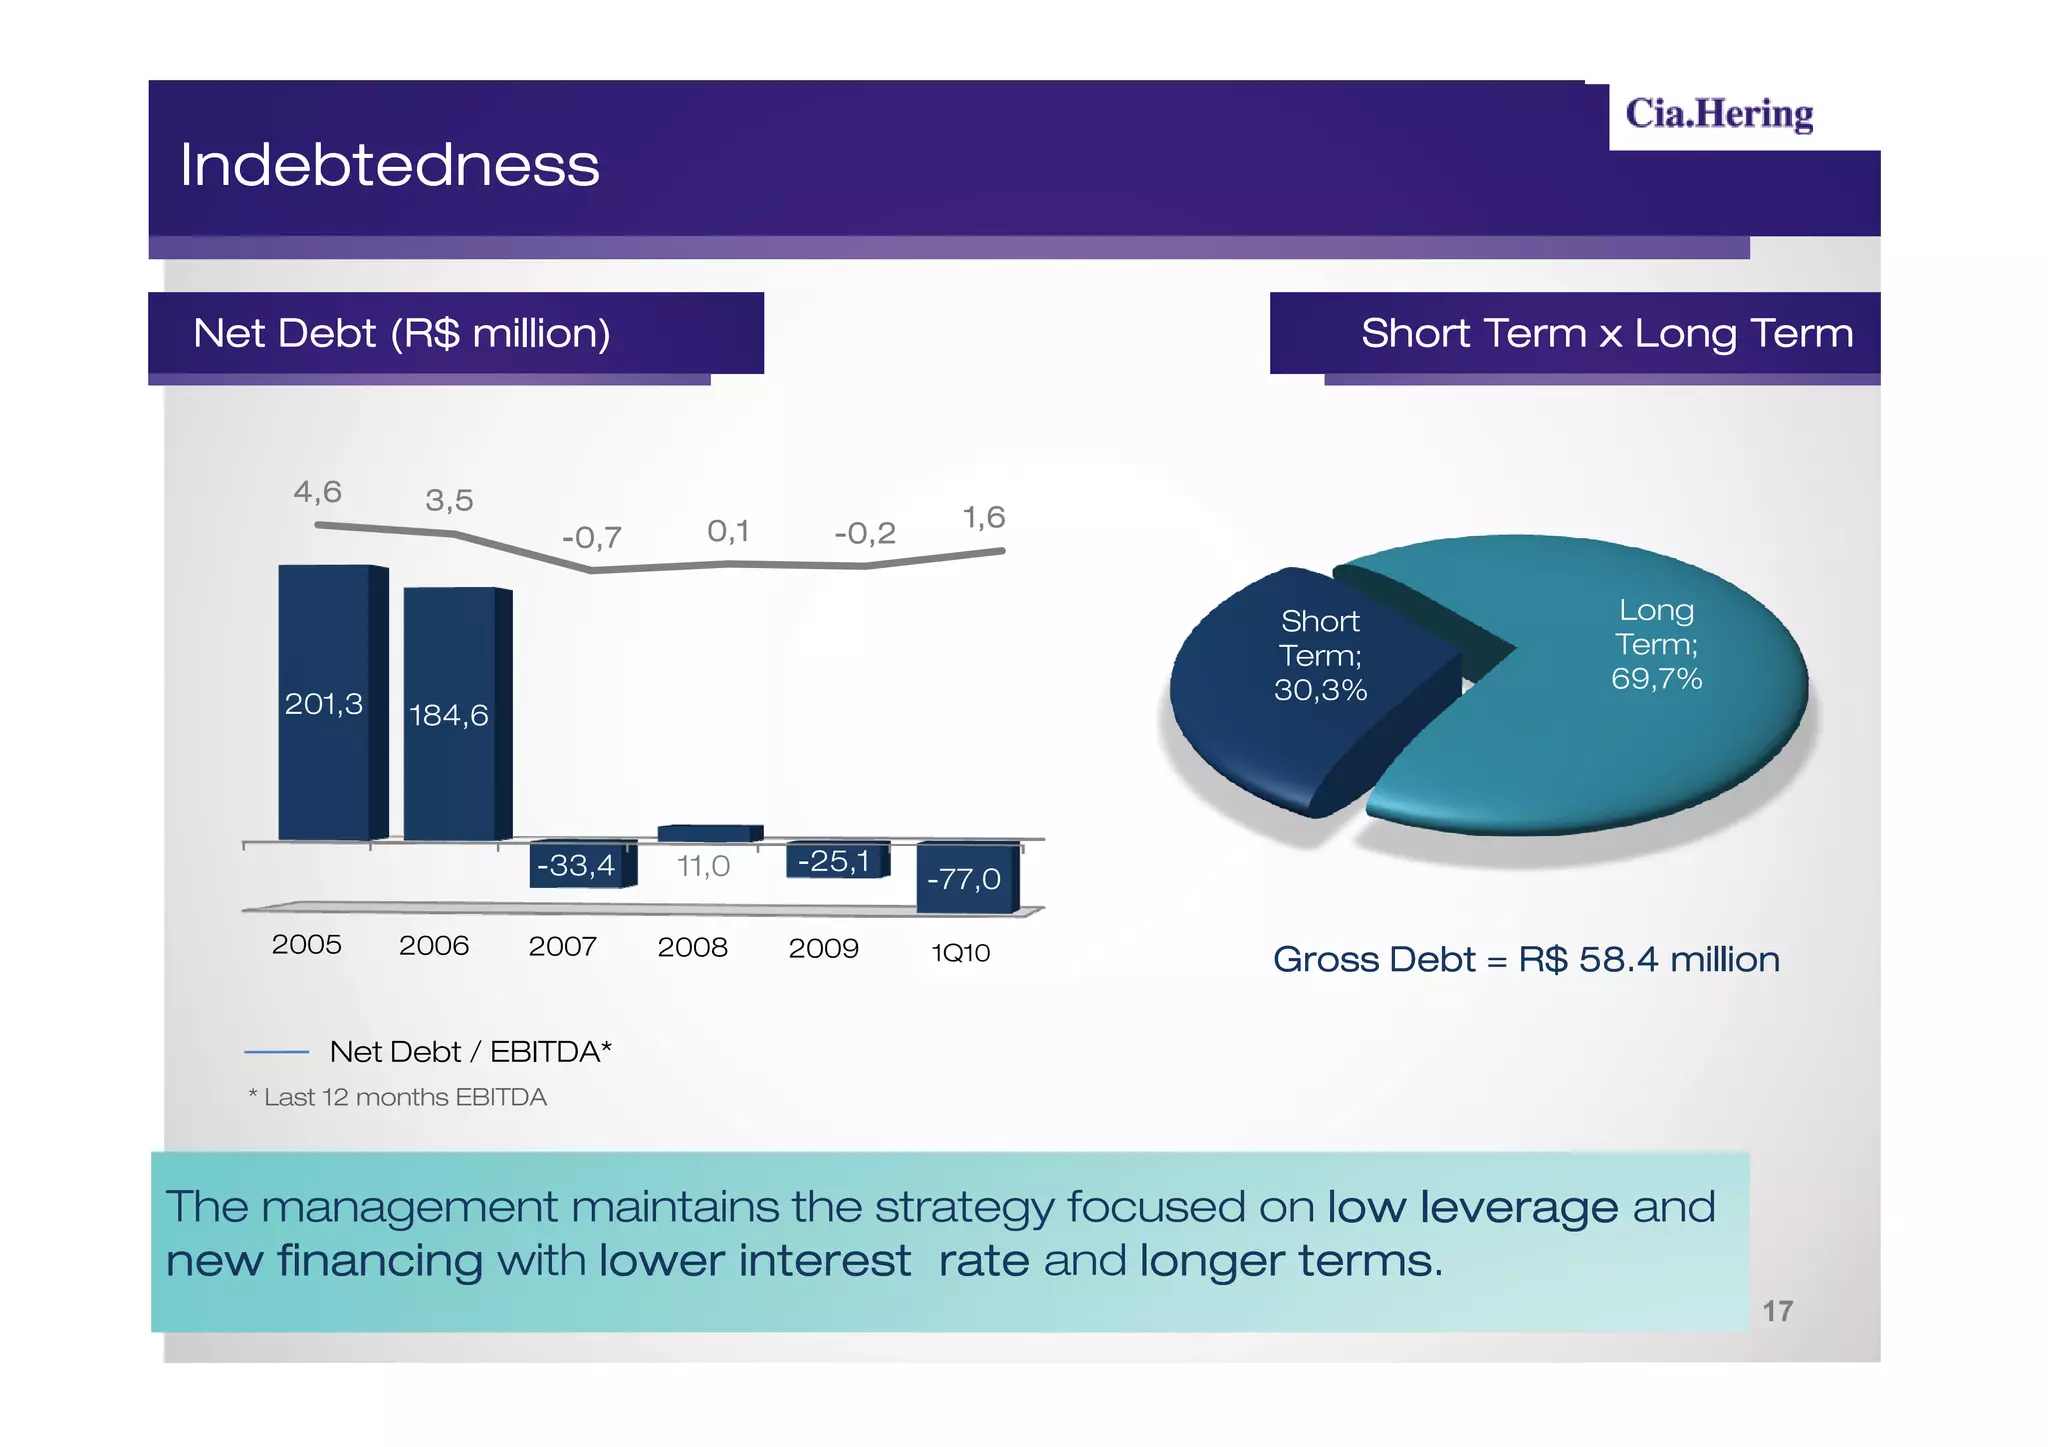
Net Debt (R$ million) Short Term x Long Term
4,6 3,5
0,1 1,6
-0,7 -0,2
Short Long
Term; Term;
30,3% 69,7%
201,3 184,6
-33,4 11,0 -25,1
-77,0
2005 2006 2007 2008 2009 1T10
1Q10 Gross Debt = R$ 58.4 million
Net Debt / EBITDA*
* Last 12 months EBITDA
The management maintains the strategy focused on low leverage and
new financing with lower interest rate and longer terms
terms.
17
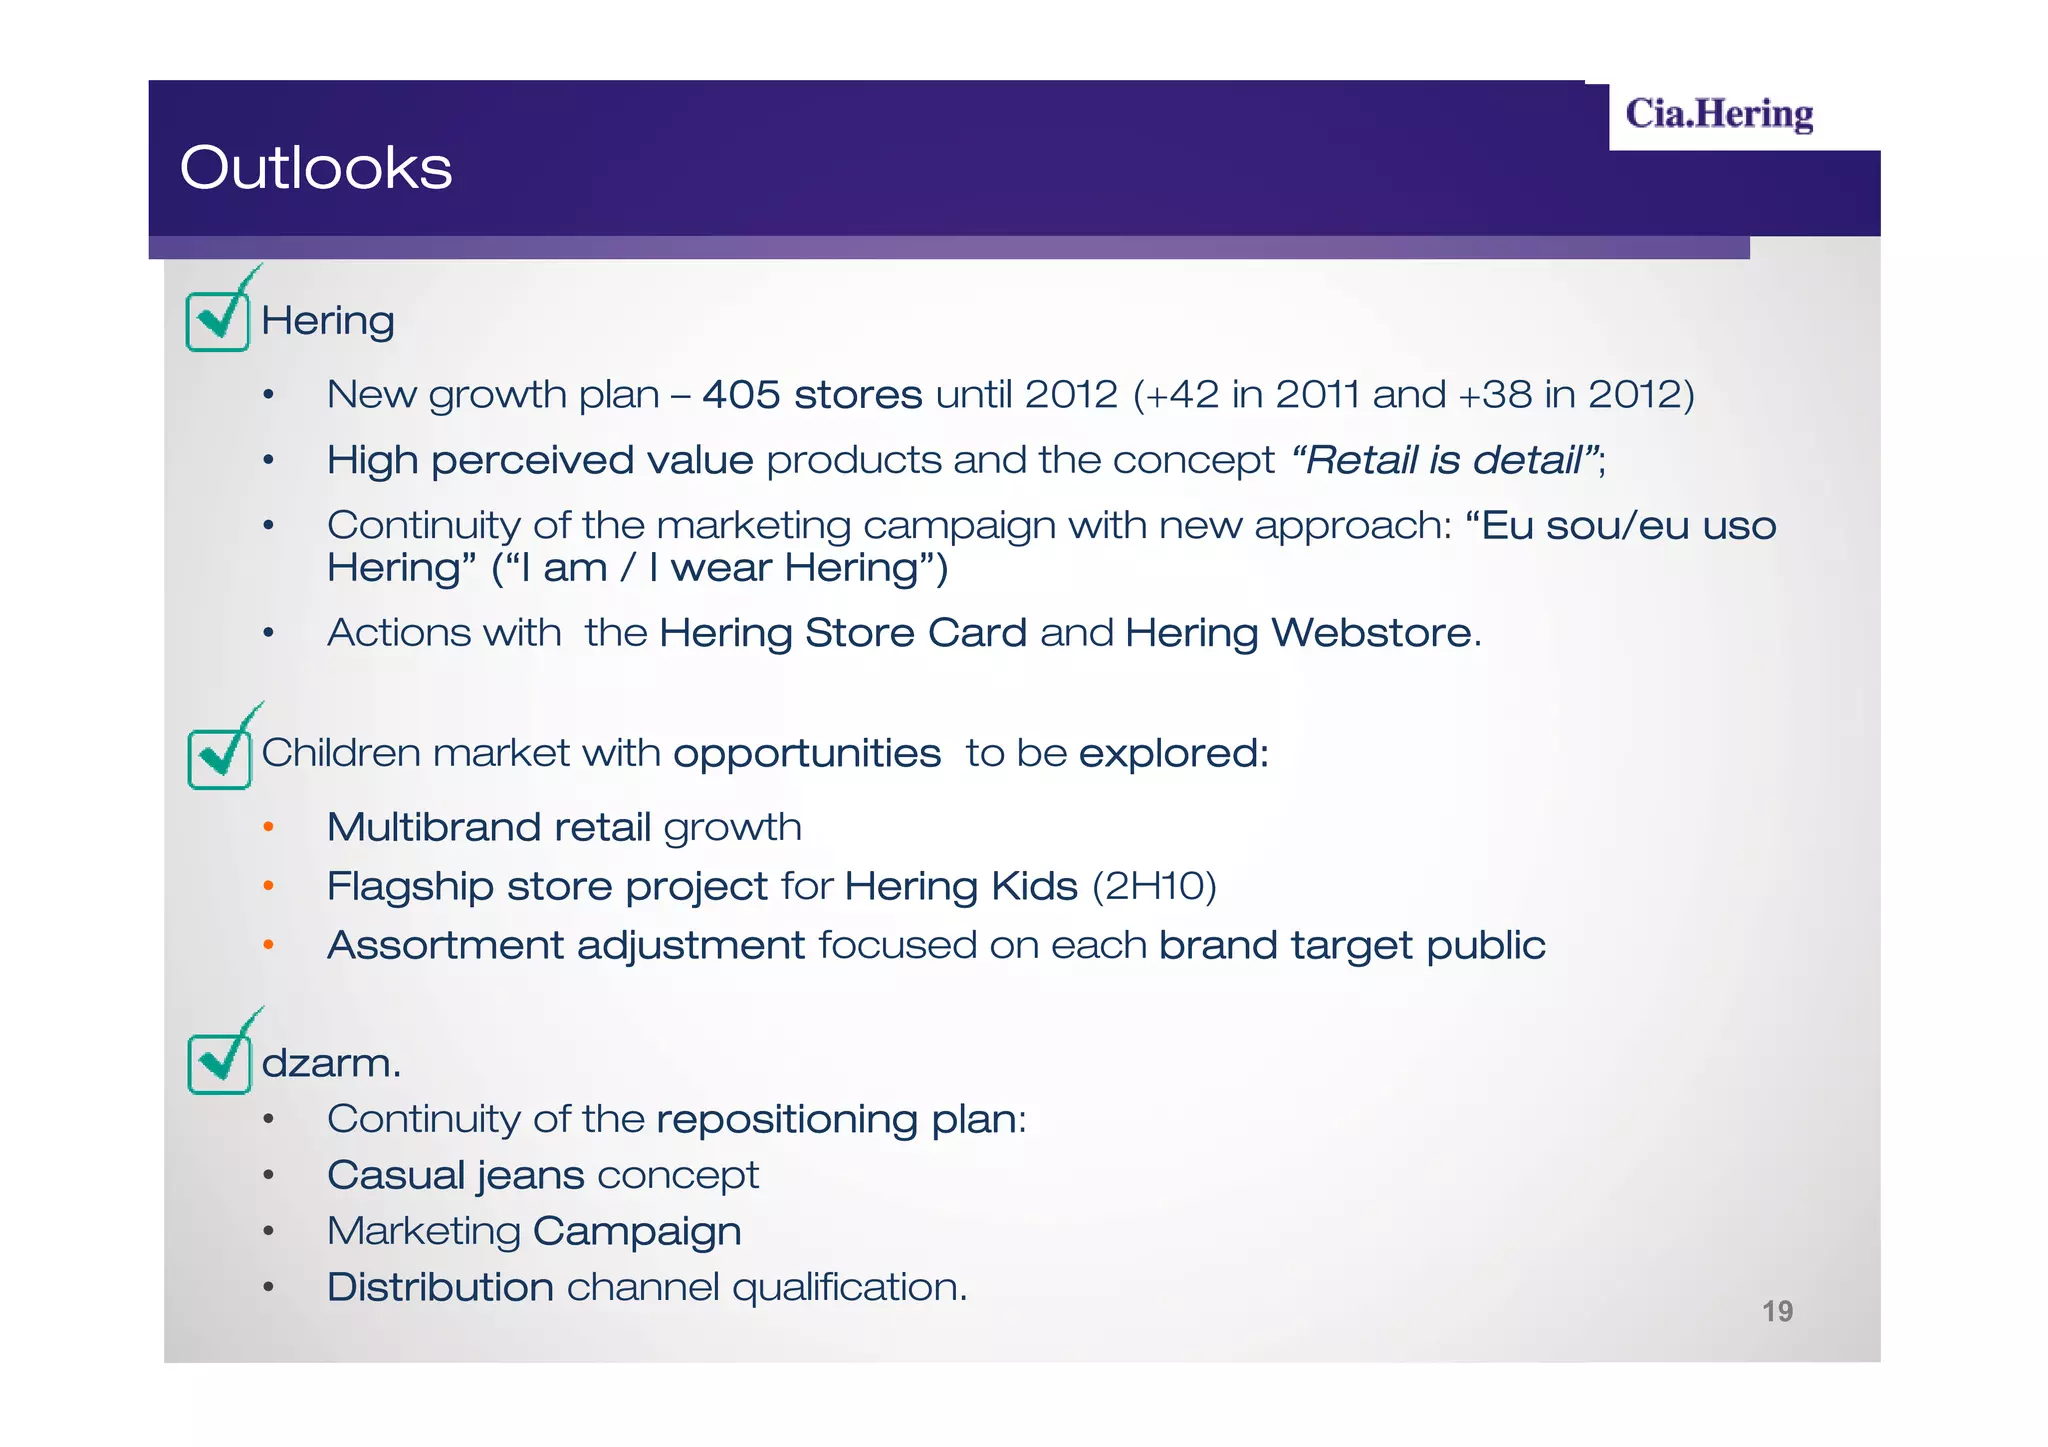
Outlooks
Hering
• New growth plan – 405 stores until 2012 (+42 in 2011 and +38 in 2012)
• High perceived value products and the concept “Retail is detail”;
detail”
• Continuity of the marketing campaign with new approach: “Eu sou/eu uso
Hering” (“I am / I wear Hering”)
• Actions with the Hering Store Card and Hering Webstore
Webstore.
Children market with opportunities to be explored:
explored:
• Multibrand retail growth
• Flagship store project for Hering Kids (2H10)
• Assortment adjustment focused on each brand target public
dzarm.
dzarm .
• Continuity of the repositioning plan
plan:
• Casual jeans concept
• Marketing Campaign
• Distribution channel qualification.
19
20.
INVESTOR RELATION TEAM
Fabio Hering – CEO and IR Director
Frederico de Aguiar Oldani – Finance Director
Karina Koerich – IR Manager
Gracila Camargo Lopes – IR Analyst
Tel. +55 (47) 3321-3469
E-mail: ri@heringnet.com.br
Website: www.ciahering.com.br/ir
FIRB – Financial Investor Relations Brasil
Tel. +55 (11) 3897-6857
E-mail: ligia.montagnani@firb.com