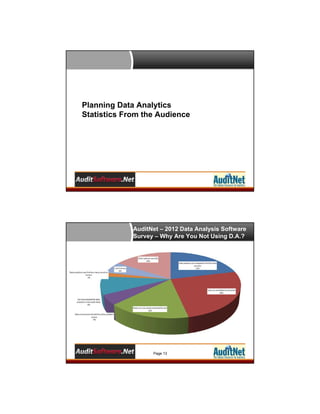
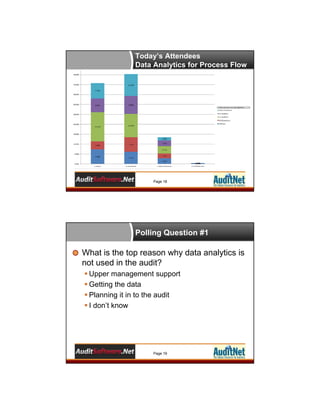
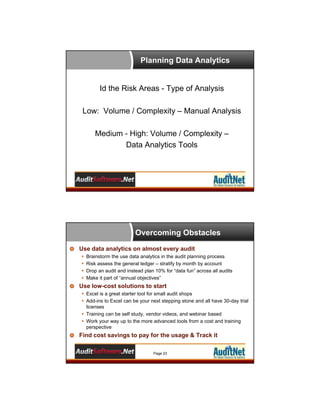
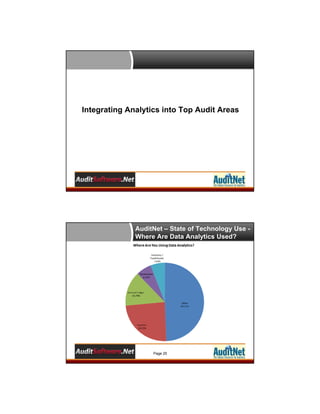
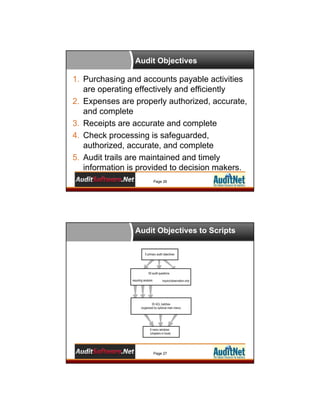
Planning Data Analytics
Into Your Audits – Best
Practices

October 31, 2012

AuditNet and AuditSoftware.Net
Collaboration

Brought to you by AuditSoftware.net and
AuditNet, working together to provide
 Practical audit software training
 Resource links
 Independent analysis
 Tools to improve audit software usage

Today focused on providing practical data
analysis training
Page 1
About Jim Kaplan, CIA, CFE
 President and Founder

of AuditNet®, the global
resource for auditors
 Auditor, Author, Web
Site Guru, Internet for
Auditors Pioneer
 Recipient of the IIA’s
2007 Bradford Cadmus
Memorial Award.
 Local Government
Auditors Lifetime
Member Award
Page 2

Introductions

About AuditNet LLC

• AuditNet® is the global resource for auditors created by Jim
Kaplan an Internet for auditors pioneer and recipient of the IIA’s
2007 Bradford Cadmus Memorial Award. The Web site features:
• Over 2,000 Reusable Templates, Audit Programs, Questionnaires,
and Control Matrices
• Training without Travel Webinars focusing on fraud, audit software
(ACL, IDEA, Excel), IT audit, and internal audit
• Audit guides, manuals, and books on audit basics and using audit
technology
• LinkedIn Networking Groups
• Monthly Newsletters with Expert Guest Columnists
• Book Reviews
• Surveys on timely topics for internal auditors
Page 3
Webinar Housekeeping
This webinar and its material are the property of AuditNet® and Cash
Recovery Partners. Unauthorized usage or recording of this webinar or
any of its material is strictly forbidden. We will be recording the webinar
and if you paid the registration fee you will be provided access to that
recording within two business days after the webinar. Downloading or
otherwise duplicating the webinar recording is expressly prohibited.
Please complete the evaluation to help us continuously improve our
Webinars
You must answer the polling questions to qualify for CPE per NASBA
Submit questions via the chat box on your screen and we will answer
them either during or at the conclusion
If GTW stops working you may need to close and restart. You can
always dial in and listen and follow along with the handout

Page 4

Richard B. Lanza, CPA, CFE, CGMA
•
•
•
•

•

Over two decades of ACL and Excel software usage
Wrote the first practical ACL publication on how to use the
product in 101 ways (101 ACL Applications)
Has written and spoken on the use of audit data analytics for
over 15 years.
Received the Outstanding Achievement in Business Award by
the Association of Certified Fraud Examiners for developing
the publication Proactively Detecting Fraud Using Computer
Audit Reports as a research project for the IIA
Recently was a contributing author of:
•
•

•

Global Technology Audit Guide (GTAG #13) Fraud in an
Automated World – Institute of Internal Auditors.
Data Analytics – A Practical Approach - research whitepaper
for the Information System Accountability Control
Association.
Cost Recovery – Turning Your Accounts Payable Department
into a Profit Center – Wiley and Sons.

Please see full bio at www.richlanza.com
Learning Objectives
Gain an appreciation, based on the attendee participants,
of their successes and pitfalls when planning data
analytics.
Understand some common approaches to overcoming
obstacles to planning data analytics based on case
studies from companies and survey attendees
themselves.
Learn how planning analytics can be integrated into top
audit areas.
Outline an effective data request process to ensure
complete and accurate extractions of data every time.
See how analytics can maximize the annual audit plan
and better ensure focus is placed on organizational risk.
Page 6

Technology Standards
 IPPF Standard 1210.A3
 Internal auditors must have

sufficient knowledge
of…available technology
based audit techniques to
perform their assigned
work
IIA Guidance – GTAG 13
Internal auditors require appropriate
skills and should use available
technological tools to help them
maintain a successful fraud
management program that covers
prevention, detection, and
investigation. As such, all audit
professionals — not just IT audit
specialists — are expected to be
increasingly proficient in areas such as
data analysis and the use of
technology to help them meet the
demands of the job.

Professional Guidance
Categories of Audit Software
Continuous

Anti

Controls

Fraud

Monitoring

Automated
Issues
Tracking

Governance
Risk
Compliance

Data
Analysis

Risk
Assessment

Audit
Management

Electronic
Work Papers

Audit
Resource
Scheduling

2012 Survey: Using Data
Analysis Software













Over 500 auditors responded as of 11/01/2012
More than 70% reported using data analysis software
85% of those using reported purchasing specifically for data
analysis
68% reported use to improve audit plan sometimes or always
33% Ad Hoc Beginner (Excel) 37% Intermediate (Excel, ACL,
IDEA)
73% use audit staff for data analysis (no outsourcing)
44% use ACL, 33% use Access , 25% IDEA
43% major reason for not using on all audits - staff not trained
75% said greatest benefit - able to review entire population
84% performance objectives/compensation not tied to use
59% indicated would use data analytics if audit programs
included steps
58% indicated would use if a script library were available or if
vendors provided a lite version of their software

Page 11
Planning Data Analytics
Statistics From the Audience

AuditNet – 2012 Data Analysis Software
Survey – Why Are You Not Using D.A.?

Page 13
Today’s Attendees

Page 14

Today’s Attendees

Page 15
Today’s Attendees
Data Analytics in the Audit Plan

Page 16

Today’s Attendees
Data Analytics in Audit Planning

Page 17
Today’s Attendees
Data Analytics for Process Flow

Page 18

Polling Question #1

What is the top reason why data analytics is
not used in the audit?
 Upper management support
 Getting the data
 Planning it in to the audit
 I don’t know

Page 19
Common Approaches to Overcoming
Obstacles in Planning With Data Analytics

Planning Data Analytics

Identify the Risk Areas for the Audit
Objective
Risks Identified Best use of Data Analytics
Planning Data Analytics

Id the Risk Areas - Type of Analysis
Low: Volume / Complexity – Manual Analysis
Medium - High: Volume / Complexity –
Data Analytics Tools

Overcoming Obstacles
Use data analytics on almost every audit





Brainstorm the use data analytics in the audit planning process
Risk assess the general ledger – stratify by month by account
Drop an audit and instead plan 10% for “data fun” across all audits
Make it part of “annual objectives”

Use low-cost solutions to start
 Excel is a great starter tool for small audit shops
 Add-ins to Excel can be your next stepping stone and all have 30-day trial
licenses
 Training can be self study, vendor videos, and webinar based
 Work your way up to the more advanced tools from a cost and training
perspective

Find cost savings to pay for the usage & Track it
Page 23
Integrating Analytics into Top Audit Areas

AuditNet – State of Technology Use Where Are Data Analytics Used?

Page 25
Audit Objectives

1. Purchasing and accounts payable activities
are operating effectively and efficiently
2. Expenses are properly authorized, accurate,
and complete
3. Receipts are accurate and complete
4. Check processing is safeguarded,
authorized, accurate, and complete
5. Audit trails are maintained and timely
information is provided to decision makers.
Page 26

Audit Objectives to Scripts

Page 27
How the Scripts Align
to Objectives

Page 28

Specific Tests Based
on the 5 Ws
Who
 Summarize journal entries by the persons entering to determine if they’re
authorized.
What
 Summarize journal entries by account and repetitive extracts (more than 50
instances) and unique account sequences used in the journal entry (based on the
first five debit and credit postings).
 Extract nonstandard or manual journal entries (versus a created system such as an
accounts payable ledger posting) for further analysis.
 Stratify size of journal entries based on amount (using the debit side of the
transaction).
 Summarize general ledger activity on the amount field (absolute value of debit or
credit) to identify the top occurring amounts. Then summarize activity by account
and the amount identified for the top 25 appearing amounts.
 Scatter-graph general ledger account (debit and credit amounts separately) and
numbers of transactions.
Page 29
Specific Tests Based
on the 5 Ws
When
 Extract journal entries posted on weekends and holidays.
 Extract journal entries relating to the prior year that were made just immediately
following a fiscal-year end.
 Summarize journal entry credits and debits processing by day, month, and year.
Where
 Extract journal entries made to suspense accounts and summarize by the person
entering and corresponding account numbers.
 Extract journal entries to general ledger accounts known to be problems or complex
based on past issues (errors of accounting in journal subsequently corrected by
accounting staff or auditors) at the company or the industry in general.
 Extract debits in revenue and summarize by general ledger account. Summarize
journal entries by the persons entering to determine if they’re authorized.

Page 30

Specific Tests Based
on the 5 Ws
Why
 Extract general ledger transaction amounts (debit or credit) that exceed the average
amounts for that general ledger account by a specified percentage. (Five times the
average is the default.)
 Extract journal entries that equate to round multiples of 10,000, 100,000, and
1,000,000.
 Extract journal entries with key texts such as “plug” and “net to zero” anywhere in
the record.
 Extract journal entries that are made below set accounting department approval
limits especially multiple entries of amounts below such limits.
 Extract journal entries that don’t net to zero (debits less credits).

Page 31
Mapping Data Elements to
Audit Objectives

Page 32

Polling Question #2

Which audit objective question below is most
easily automated?
 Does the company have a written code of ethics?
 Does the company follow approval limits prior to
invoice approval?
 Do adequate written procedures exist for invoice
processing?
 Is check stock safeguarded?

Page 33
Effective Data Import Process

Top 10 Data Import Mistakes
1. Not knowing what is possible within the tool to
import and normalize data
2. Asking for data before understanding reporting
needs
3. Not including knowledgeable system
professionals to assist in or review the extract
4. Forgetting to run statistics on amount/date fields
5. Not summarizing text code fields (including
invoice numbers to find E+ issues)

Page 35
Top 10 Data Import Mistakes

6. Lack of hardcopy information for review in
relation to imported data
7. Not validating field totals to batch totals
8. Using report files vs. fixed length system files
9. Getting data in Excel vs. a more raw format
10.Lack of understanding of the various data
types

Page 36

Quick Process to Running
Data

1.
2.
3.
4.
5.
6.
7.

Know your audit objectives
Align reports to the objectives
Use past reports to model /refine reports
Set data requirements based on reports
Obtain, validate, and normalize data
Edit scripts for data needs
Run reports and document results

Page 37
Data Request Checklist

Actual Files to Obtain
 File Structure / Record Layout
 Indexes to Understand Data
 Indexes to Understand Reason Codes

Other non-System Information Needed
 Loan or Credit Agreement Terms

Data Request Checklist

Computed Fields
• How to use them?
• Where to place them?
Data Request Checklist

Repetitive Audit /
Project
vs.
Special Assignments

Data Request Checklist

Outcome
Initial Analysis
Next Steps
Today’s Attendees
Data Request is Sent Prior…..

Page 42

Clear Data Request

Accounts Payable Data Request.doc

Page 43
Polling Question #3

What is NOT one of the top 10 data import
mistakes?
 Asking for data before understanding report
needs
 Not validating batch totals to data
 Including knowledgeable people in the extract
process
 Not knowing what is possible in the software

Page 44

Integrating Analytics into The Audit Plan
Cost Recovery Opportunity Analysis

Expenses for Analysis
 Primarily SG&A
 Cost of goods sold (i.e., freight)
Data Files
 General Ledger (trial balance)
 A/P Invoice Detail Distribution
 Purchase Orders
 Pricing List

Profit Opportunities
Outweigh Analytic Costs

Accounts Payable
Audit Fee Benchmarking
Advertising Agency
Document Fleet
Freight
Health Benefits
Lease
Media
Order to Cash

Proactive Fraud
Detection
Project Fraud
Real Estate Depreciation
Sales & Use Tax / VAT /
R&D tax
Strategic Sourcing
Telecom
Travel and Entertainment
Utilities
Cost Recovery Opportunity Tests
A/P and G/L Review Factors








Accounts that are sole sourced
Accounts that have too many vendors
Categories that map to the “recovery list”
Assess to industry cost category benchmarks
Top 100 vendors
Trend analysis over time
Trend analysis by vendor (scatter graph)

Purchase Order / Price List
 Match to invoice payments to assess price
differences
 Strategic sourcing vendor review

Stratify Your Data
=IF(B4>1000,“3. Over $1000",IF(B4>100,“2. Over
$100 to $1,000",IF(B4<=100,“1. Up to $100")))
This will create three strata:
1. Up to $100
2. Over $100 to $1,000
3. Over $1,000
Start from highest to lowest – Excel picks the first
matching item
Page 49
The Sampling “Problem”
Bottom Line Numbers
Modern tests (round numbers, duplicates, missing fields)
identify thousands of ‘suspicious’ transactions, usually about 1
in 5 of all transactions get a ‘red flag’
Historically at least 0.02 – 0.03 % of all transactions have real
problems, such as a recoverable over-payment
So roughly 0.00025 / 0.2 = 0.00125 or 1 in 800 ‘red flags’ lead
to a real problem.

Imagine throwing a random dart at 800 balloons hoping
to hit the right one!!!
Page 50

Transactional Score
A single score is given to each transaction based on its severity
(number of attributes it meets)
Scores are summarized by enterer, vendor, and department (buyer)
Scattergraphs are completed of the results by:
 Enterer
 Business Partner
 Department
…focusing on severity/volume and differences in
these variables
Sampling is completed in each quadrant
51
Transactional Scoring

The result is a sampling
methodology that is now
based on Risk as you define

Page 52

Summaries on Various
Perspectives

Summarize by 
dimensions (and sub 
dimension) to pinpoint 
within the cube the 
crossover between the top 
scored location, time, and 
place of fraud based on 
the combined judgmental 
and statistical score 
53
Using Vlookup to Combine
Scores

Create a record number
Relate sheets based on VLookup

Page 54

Severity To Value

55
GeoMapping – BatchGeo

Page 56

Polling Question #4

What function is mainly used to align all
scores in a spreadsheet?
 MOD()
 FIND()
 MID()
 VLOOKUP()

Page 57
Questions?
Any Questions?
Don’t be Shy!

Page 58

AuditSoftwareVideos.com
Videos accessible for 12-month subscriptions
Repeat video and text instruction as much as
you need
Bite-size video format (3 to 10 minutes)
Professionally produced
videos
 Sample files, scripts,
and macros included for
ACL™ and Excel™
 Instructors with over 20
years experience in
ACL™, Excel™ , and
more
Page 59
AuditNet® Survey - 2012 Data
Analysis Software Survey

Please help us by taking the survey

Scan the QR Code with your Mobile Device
Or Visit
https://www.surveymonkey.com/s/2012DataA
nalysisSoftware
Page 60

Thank You!
Jim Kaplan
AuditNet LLC®
1-800-385-1625
Email: webinars@auditnet.org
http://www.auditnet.org
Richard B. Lanza, CPA, CFE
Cash Recovery Partners, LLC
Phone: 973-729-3944
Cell: 201-650-4150
Fax: 973-270-2428
Email: rich@richlanza.com
Page 61

Best Practices: Planning Data Analytic into Your Audits

  • 1.
    Planning Data Analytics IntoYour Audits – Best Practices October 31, 2012 AuditNet and AuditSoftware.Net Collaboration Brought to you by AuditSoftware.net and AuditNet, working together to provide  Practical audit software training  Resource links  Independent analysis  Tools to improve audit software usage Today focused on providing practical data analysis training Page 1
  • 2.
    About Jim Kaplan,CIA, CFE  President and Founder of AuditNet®, the global resource for auditors  Auditor, Author, Web Site Guru, Internet for Auditors Pioneer  Recipient of the IIA’s 2007 Bradford Cadmus Memorial Award.  Local Government Auditors Lifetime Member Award Page 2 Introductions About AuditNet LLC • AuditNet® is the global resource for auditors created by Jim Kaplan an Internet for auditors pioneer and recipient of the IIA’s 2007 Bradford Cadmus Memorial Award. The Web site features: • Over 2,000 Reusable Templates, Audit Programs, Questionnaires, and Control Matrices • Training without Travel Webinars focusing on fraud, audit software (ACL, IDEA, Excel), IT audit, and internal audit • Audit guides, manuals, and books on audit basics and using audit technology • LinkedIn Networking Groups • Monthly Newsletters with Expert Guest Columnists • Book Reviews • Surveys on timely topics for internal auditors Page 3
  • 3.
    Webinar Housekeeping This webinarand its material are the property of AuditNet® and Cash Recovery Partners. Unauthorized usage or recording of this webinar or any of its material is strictly forbidden. We will be recording the webinar and if you paid the registration fee you will be provided access to that recording within two business days after the webinar. Downloading or otherwise duplicating the webinar recording is expressly prohibited. Please complete the evaluation to help us continuously improve our Webinars You must answer the polling questions to qualify for CPE per NASBA Submit questions via the chat box on your screen and we will answer them either during or at the conclusion If GTW stops working you may need to close and restart. You can always dial in and listen and follow along with the handout Page 4 Richard B. Lanza, CPA, CFE, CGMA • • • • • Over two decades of ACL and Excel software usage Wrote the first practical ACL publication on how to use the product in 101 ways (101 ACL Applications) Has written and spoken on the use of audit data analytics for over 15 years. Received the Outstanding Achievement in Business Award by the Association of Certified Fraud Examiners for developing the publication Proactively Detecting Fraud Using Computer Audit Reports as a research project for the IIA Recently was a contributing author of: • • • Global Technology Audit Guide (GTAG #13) Fraud in an Automated World – Institute of Internal Auditors. Data Analytics – A Practical Approach - research whitepaper for the Information System Accountability Control Association. Cost Recovery – Turning Your Accounts Payable Department into a Profit Center – Wiley and Sons. Please see full bio at www.richlanza.com
  • 4.
    Learning Objectives Gain anappreciation, based on the attendee participants, of their successes and pitfalls when planning data analytics. Understand some common approaches to overcoming obstacles to planning data analytics based on case studies from companies and survey attendees themselves. Learn how planning analytics can be integrated into top audit areas. Outline an effective data request process to ensure complete and accurate extractions of data every time. See how analytics can maximize the annual audit plan and better ensure focus is placed on organizational risk. Page 6 Technology Standards  IPPF Standard 1210.A3  Internal auditors must have sufficient knowledge of…available technology based audit techniques to perform their assigned work
  • 5.
    IIA Guidance –GTAG 13 Internal auditors require appropriate skills and should use available technological tools to help them maintain a successful fraud management program that covers prevention, detection, and investigation. As such, all audit professionals — not just IT audit specialists — are expected to be increasingly proficient in areas such as data analysis and the use of technology to help them meet the demands of the job. Professional Guidance
  • 6.
    Categories of AuditSoftware Continuous Anti Controls Fraud Monitoring Automated Issues Tracking Governance Risk Compliance Data Analysis Risk Assessment Audit Management Electronic Work Papers Audit Resource Scheduling 2012 Survey: Using Data Analysis Software             Over 500 auditors responded as of 11/01/2012 More than 70% reported using data analysis software 85% of those using reported purchasing specifically for data analysis 68% reported use to improve audit plan sometimes or always 33% Ad Hoc Beginner (Excel) 37% Intermediate (Excel, ACL, IDEA) 73% use audit staff for data analysis (no outsourcing) 44% use ACL, 33% use Access , 25% IDEA 43% major reason for not using on all audits - staff not trained 75% said greatest benefit - able to review entire population 84% performance objectives/compensation not tied to use 59% indicated would use data analytics if audit programs included steps 58% indicated would use if a script library were available or if vendors provided a lite version of their software Page 11
  • 7.
    Planning Data Analytics StatisticsFrom the Audience AuditNet – 2012 Data Analysis Software Survey – Why Are You Not Using D.A.? Page 13
  • 8.
  • 9.
    Today’s Attendees Data Analyticsin the Audit Plan Page 16 Today’s Attendees Data Analytics in Audit Planning Page 17
  • 10.
    Today’s Attendees Data Analyticsfor Process Flow Page 18 Polling Question #1 What is the top reason why data analytics is not used in the audit?  Upper management support  Getting the data  Planning it in to the audit  I don’t know Page 19
  • 11.
    Common Approaches toOvercoming Obstacles in Planning With Data Analytics Planning Data Analytics Identify the Risk Areas for the Audit Objective Risks Identified Best use of Data Analytics
  • 12.
    Planning Data Analytics Idthe Risk Areas - Type of Analysis Low: Volume / Complexity – Manual Analysis Medium - High: Volume / Complexity – Data Analytics Tools Overcoming Obstacles Use data analytics on almost every audit     Brainstorm the use data analytics in the audit planning process Risk assess the general ledger – stratify by month by account Drop an audit and instead plan 10% for “data fun” across all audits Make it part of “annual objectives” Use low-cost solutions to start  Excel is a great starter tool for small audit shops  Add-ins to Excel can be your next stepping stone and all have 30-day trial licenses  Training can be self study, vendor videos, and webinar based  Work your way up to the more advanced tools from a cost and training perspective Find cost savings to pay for the usage & Track it Page 23
  • 13.
    Integrating Analytics intoTop Audit Areas AuditNet – State of Technology Use Where Are Data Analytics Used? Page 25
  • 14.
    Audit Objectives 1. Purchasingand accounts payable activities are operating effectively and efficiently 2. Expenses are properly authorized, accurate, and complete 3. Receipts are accurate and complete 4. Check processing is safeguarded, authorized, accurate, and complete 5. Audit trails are maintained and timely information is provided to decision makers. Page 26 Audit Objectives to Scripts Page 27
  • 15.
    How the ScriptsAlign to Objectives Page 28 Specific Tests Based on the 5 Ws Who  Summarize journal entries by the persons entering to determine if they’re authorized. What  Summarize journal entries by account and repetitive extracts (more than 50 instances) and unique account sequences used in the journal entry (based on the first five debit and credit postings).  Extract nonstandard or manual journal entries (versus a created system such as an accounts payable ledger posting) for further analysis.  Stratify size of journal entries based on amount (using the debit side of the transaction).  Summarize general ledger activity on the amount field (absolute value of debit or credit) to identify the top occurring amounts. Then summarize activity by account and the amount identified for the top 25 appearing amounts.  Scatter-graph general ledger account (debit and credit amounts separately) and numbers of transactions. Page 29
  • 16.
    Specific Tests Based onthe 5 Ws When  Extract journal entries posted on weekends and holidays.  Extract journal entries relating to the prior year that were made just immediately following a fiscal-year end.  Summarize journal entry credits and debits processing by day, month, and year. Where  Extract journal entries made to suspense accounts and summarize by the person entering and corresponding account numbers.  Extract journal entries to general ledger accounts known to be problems or complex based on past issues (errors of accounting in journal subsequently corrected by accounting staff or auditors) at the company or the industry in general.  Extract debits in revenue and summarize by general ledger account. Summarize journal entries by the persons entering to determine if they’re authorized. Page 30 Specific Tests Based on the 5 Ws Why  Extract general ledger transaction amounts (debit or credit) that exceed the average amounts for that general ledger account by a specified percentage. (Five times the average is the default.)  Extract journal entries that equate to round multiples of 10,000, 100,000, and 1,000,000.  Extract journal entries with key texts such as “plug” and “net to zero” anywhere in the record.  Extract journal entries that are made below set accounting department approval limits especially multiple entries of amounts below such limits.  Extract journal entries that don’t net to zero (debits less credits). Page 31
  • 17.
    Mapping Data Elementsto Audit Objectives Page 32 Polling Question #2 Which audit objective question below is most easily automated?  Does the company have a written code of ethics?  Does the company follow approval limits prior to invoice approval?  Do adequate written procedures exist for invoice processing?  Is check stock safeguarded? Page 33
  • 18.
    Effective Data ImportProcess Top 10 Data Import Mistakes 1. Not knowing what is possible within the tool to import and normalize data 2. Asking for data before understanding reporting needs 3. Not including knowledgeable system professionals to assist in or review the extract 4. Forgetting to run statistics on amount/date fields 5. Not summarizing text code fields (including invoice numbers to find E+ issues) Page 35
  • 19.
    Top 10 DataImport Mistakes 6. Lack of hardcopy information for review in relation to imported data 7. Not validating field totals to batch totals 8. Using report files vs. fixed length system files 9. Getting data in Excel vs. a more raw format 10.Lack of understanding of the various data types Page 36 Quick Process to Running Data 1. 2. 3. 4. 5. 6. 7. Know your audit objectives Align reports to the objectives Use past reports to model /refine reports Set data requirements based on reports Obtain, validate, and normalize data Edit scripts for data needs Run reports and document results Page 37
  • 20.
    Data Request Checklist ActualFiles to Obtain  File Structure / Record Layout  Indexes to Understand Data  Indexes to Understand Reason Codes Other non-System Information Needed  Loan or Credit Agreement Terms Data Request Checklist Computed Fields • How to use them? • Where to place them?
  • 21.
    Data Request Checklist RepetitiveAudit / Project vs. Special Assignments Data Request Checklist Outcome Initial Analysis Next Steps
  • 22.
    Today’s Attendees Data Requestis Sent Prior….. Page 42 Clear Data Request Accounts Payable Data Request.doc Page 43
  • 23.
    Polling Question #3 Whatis NOT one of the top 10 data import mistakes?  Asking for data before understanding report needs  Not validating batch totals to data  Including knowledgeable people in the extract process  Not knowing what is possible in the software Page 44 Integrating Analytics into The Audit Plan
  • 24.
    Cost Recovery OpportunityAnalysis Expenses for Analysis  Primarily SG&A  Cost of goods sold (i.e., freight) Data Files  General Ledger (trial balance)  A/P Invoice Detail Distribution  Purchase Orders  Pricing List Profit Opportunities Outweigh Analytic Costs Accounts Payable Audit Fee Benchmarking Advertising Agency Document Fleet Freight Health Benefits Lease Media Order to Cash Proactive Fraud Detection Project Fraud Real Estate Depreciation Sales & Use Tax / VAT / R&D tax Strategic Sourcing Telecom Travel and Entertainment Utilities
  • 25.
    Cost Recovery OpportunityTests A/P and G/L Review Factors        Accounts that are sole sourced Accounts that have too many vendors Categories that map to the “recovery list” Assess to industry cost category benchmarks Top 100 vendors Trend analysis over time Trend analysis by vendor (scatter graph) Purchase Order / Price List  Match to invoice payments to assess price differences  Strategic sourcing vendor review Stratify Your Data =IF(B4>1000,“3. Over $1000",IF(B4>100,“2. Over $100 to $1,000",IF(B4<=100,“1. Up to $100"))) This will create three strata: 1. Up to $100 2. Over $100 to $1,000 3. Over $1,000 Start from highest to lowest – Excel picks the first matching item Page 49
  • 26.
    The Sampling “Problem” BottomLine Numbers Modern tests (round numbers, duplicates, missing fields) identify thousands of ‘suspicious’ transactions, usually about 1 in 5 of all transactions get a ‘red flag’ Historically at least 0.02 – 0.03 % of all transactions have real problems, such as a recoverable over-payment So roughly 0.00025 / 0.2 = 0.00125 or 1 in 800 ‘red flags’ lead to a real problem. Imagine throwing a random dart at 800 balloons hoping to hit the right one!!! Page 50 Transactional Score A single score is given to each transaction based on its severity (number of attributes it meets) Scores are summarized by enterer, vendor, and department (buyer) Scattergraphs are completed of the results by:  Enterer  Business Partner  Department …focusing on severity/volume and differences in these variables Sampling is completed in each quadrant 51
  • 27.
    Transactional Scoring The resultis a sampling methodology that is now based on Risk as you define Page 52 Summaries on Various Perspectives Summarize by  dimensions (and sub  dimension) to pinpoint  within the cube the  crossover between the top  scored location, time, and  place of fraud based on  the combined judgmental  and statistical score  53
  • 28.
    Using Vlookup toCombine Scores Create a record number Relate sheets based on VLookup Page 54 Severity To Value 55
  • 29.
    GeoMapping – BatchGeo Page56 Polling Question #4 What function is mainly used to align all scores in a spreadsheet?  MOD()  FIND()  MID()  VLOOKUP() Page 57
  • 30.
    Questions? Any Questions? Don’t beShy! Page 58 AuditSoftwareVideos.com Videos accessible for 12-month subscriptions Repeat video and text instruction as much as you need Bite-size video format (3 to 10 minutes) Professionally produced videos  Sample files, scripts, and macros included for ACL™ and Excel™  Instructors with over 20 years experience in ACL™, Excel™ , and more Page 59
  • 31.
    AuditNet® Survey -2012 Data Analysis Software Survey Please help us by taking the survey Scan the QR Code with your Mobile Device Or Visit https://www.surveymonkey.com/s/2012DataA nalysisSoftware Page 60 Thank You! Jim Kaplan AuditNet LLC® 1-800-385-1625 Email: webinars@auditnet.org http://www.auditnet.org Richard B. Lanza, CPA, CFE Cash Recovery Partners, LLC Phone: 973-729-3944 Cell: 201-650-4150 Fax: 973-270-2428 Email: rich@richlanza.com Page 61