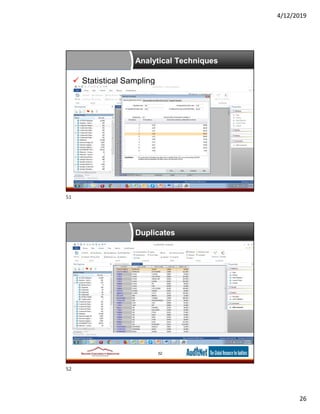
4/12/2019
1
Data Analytics - 5
Data Analytics Software
based on Data Analytics for
Internal Auditors
by Richard Cascarino
About Jim Kaplan, CIA, CFE
 President and Founder of AuditNet®,
the global resource for auditors (now
available on iOS, Android and
Windows devices)
 Auditor, Web Site Guru,
 Internet for Auditors Pioneer
 Recipient of the IIA’s 2007 Bradford
Cadmus Memorial Award.
 Author of “The Auditor’s Guide to
Internet Resources” 2nd Edition
Page 2
1
2
4/12/2019
2
About AuditNet® LLC
• AuditNet®, the global resource for auditors, is available on the
Web, iPad, iPhone, Windows and Android devices and features:
• Over 3,000 Reusable Templates, Audit Programs,
Questionnaires, and Control Matrices
• Training without Travel Webinars focusing on fraud, data
analytics, IT audit, and internal audit
• Audit guides, manuals, and books on audit basics and using
audit technology
• LinkedIn Networking Groups
• Monthly Newsletters with Expert Guest Columnists
• Surveys on timely topics for internal auditors
• NASBA Approved CPE Sponsor
Introductions
Page 3
The views expressed by the presenters do not necessarily represent
the views, positions, or opinions of AuditNet® LLC. These materials,
and the oral presentation accompanying them, are for educational
purposes only and do not constitute accounting or legal advice or
create an accountant-client relationship.
While AuditNet® makes every effort to ensure information is
accurate and complete, AuditNet® makes no representations,
guarantees, or warranties as to the accuracy or completeness of the
information provided via this presentation. AuditNet® specifically
disclaims all liability for any claims or damages that may result from
the information contained in this presentation, including any
websites maintained by third parties and linked to the AuditNet®
website.
Any mention of commercial products is for information only; it does
not imply recommendation or endorsement by AuditNet® LLC
3
4
4/12/2019
3
About Richard Cascarino, MBA,
CIA, CISM, CFE, CRMA
• Principal of Richard Cascarino &
Associates based in Colorado USA
• Over 28 years experience in IT audit
training and consultancy
• Past President of the Institute of
Internal Auditors in South Africa
• Member of ISACA
• Member of Association of Certified
Fraud Examiners
• Author of Data Analytics for Internal
Auditors
5
Today’s Agenda
 Excel and Data Analysis
 ACL and Data Analysis
 IDEA and Data Analysis
 SAS and Data Analysis
Page 6
5
6
4/12/2019
4
Excel and Data Analysis
Management Use of Excel
Use of Excel in financial analysis
Data Acquisition
Excel Database Functions
Excel Financial Functions
Ratio Analysis
Du Pont Analysis
Z-Score Analysis
ACL Add-in
7
Management Use of Excel
 Risk management models
 Budgeting and forecasting
 Cash-flow models
 Costing models
 Inventory management
8
7
8
4/12/2019
5
Excel in Financial Analysis
 Requires:
Clear identification of the intention of the
analysis. This will commonly involve interviews
with the interested parties
Identification of the information the auditor are
already has available or has access to
Sanitizing the data to remove known erroneous
information which could distort the analysis
9
Data Acquisition from a
Website
 the Get External Data from Web command
on the Data tab
10
9
10
4/12/2019
6
Data Acquisition from
Elsewhere
 Querying an external database
Get External Data on the Data tab
Microsoft query under Other Sources
Select ODBC driver
Microsoft Query Wizard.
 Importing a complete database table
Get External Data on the Data tab
Access, SQL Server, XML, or OLEDB
11
Excel Database Functions
 Assist in the analysis of a large number of
organized data records
Formula tab
Insert a Function from the Database category
DSUM which calculates the sum of values in a field of a
list or database, which satisfy specified conditions
DSUM (database,field,criteria)
DAVERAGE which calculates the average of values in
a field of a list or database, which satisfy specified
conditions
12
11
12
4/12/2019
7
Excel Financial Functions
13
Payment functions
Price functions
Investment value functions
Interest rate functions
Internal rate of return functions
Yield functions
Asset depreciation functions
Duration functions
Dollar functions
Ratios
 Liquidity ratios
 Coverage ratios
 Efficiency ratios
 Profitability ratios
 Leverage relations
14
13
14
4/12/2019
8
Du Pont Analysis
 A method of evaluating the return on equity
(ROE)
15
ROE = = x
ROA = = x
= =
𝑅𝑂𝐸 = / 1 −
Du Pont Analysis
 ROE can be improved by:
Increasing the total asset turnover
Increasing the net profit margin
Increasing the amount of debt relative to
equity
16
15
16
4/12/2019
9
Z-Score Analysis
 Helps identify those organizations potentially at risk
to financial distress or bankruptcy
Z = 1.2X1 + 1.4X2 + 3.3X3 + 0.6X4 + X5
 Where:
X1 = net working capital/total assets
X2 = retained earnings/total assets
X3 = EBIT/total assets
X4 = market value of all equity/book value of total liabilities
X5 = sales/total assets
 Altman concluded that an organization with a Z-score below 2.675
should have an expectation of severe financial distress within the
following year
17
ACL Add-in
 Create read-only versions of information, formulas,
and cells to avoid errors
 Select samples for testing or investigation
 Summarize and filter, stratify, and age information
in Excel
 Multiple computed columns may be added to
 Notes may be added to multiple rows to indicate
that analyst’s intention as well as variables selected
18
http://www.acl.com/products/acl-excel-add-in/
17
18
4/12/2019
10
ACL and Data Analysis
 Analyzing Live Data – dangers
Auditors may inadvertently corrupt live data
Audit tests may cause the live system to crash causing
processing disruption and corporate damage
Audit queries may significantly impact the speed of
processing in critical systems resulted in their client
dissatisfaction
 While the analysis is being conducted, the
data contents will move on
19
Verifying the Data
 Generate statistics on the key fields
including:
Record counts
Calculation of totals and, when appropriate, key
subtotals
Average, minimum and maximum values where
appropriate
 Classify and Summarize commands within
the Analyze menu
20
19
20
4/12/2019
11
Basic Statistical Analysis
21
Basic Statistical Analysis
22
21
22
4/12/2019
12
Importing Data into ACL
 Client-Server Capability
 Data with Electronic Definitions
ODBC
Delimited files with embedded field names
External electronic file definitions
 Data Definition Wizard
Selecting the data source
File analysis
Field analysis
Defining field properties
23
Seeking Anomalous Data
 Violations of the organization’s policies and
procedures or legal violations of statue
Customers with account balances exceeding their credit
limits
Excessive use of sole vendors
Vendors with unusual or overseas bank accounts
Dormant vendors
Duplicate vendors
Duplicate employees
24
23
24
4/12/2019
13
Seeking Anomalous Data
Invalid Social Security numbers on employee records
Excessive use of overtime
Loans which are past due
Transactions over corporate limits
Multiple transactions to a single vendor in the same time
period at, or just below, transaction valued limits
 Auditor must predefine the extent of anomaly which
would be of audit significance
25
Seeking Anomalous Data
26
25
26
4/12/2019
14
Joining and Merging Tables
 From two tables with differing structures, but
containing the common key field
 Common mistake this kind of join is choosing
the wrong file as the primary table
 Eg Joining Transactions with Suppliers
All transactions plus vendor name OR
All Vendors with one transaction each
27
Joining and Merging Tables
 New table to contain:
Matched
Unmatched
Matched, all primary, all secondary
Matched, all primary
Matched, all secondary
Many-to-many
28
27
28
4/12/2019
15
Analysis Options
 Classify command
Quick data scan and summarize based on the
unique value of a character field while some
totaling specified numeric fields
 Histogram command
Produce 3-D vertical bar charts showing the
distribution of records based on the values of a
particular field of expression
29
Analysis of Sales
30
29
30
4/12/2019
16
Analysis Options
 Age command
produces age summaries of the data facilitating
the valuation of trends in values and volumes as
well as verifying aging of outstanding balances
and the like
 Summarize command
Generate reports on any number of unique key
character and date values allowing numerical
fields to be totaled and counted for each key
value.
31
Aging
32
31
32
4/12/2019
17
Analysis Options
 Cross-tabulate
facilitates the analysis of data fields in a tabular
form of rows and columns
 Perform Benford Analysis command
will generate a digital analysis using Benford’s
formula
also includes the Z-statistic which is used where
the sample size is large and the data is assumed
to come from a normal population of which the
variance is known
33
Benford Analysis
34
33
34
4/12/2019
18
Analysis Options
 Look for Gaps / look for Duplicates
Commonly used by auditors to identify errors in
sequenced databases
 Sampling techniques
Monetary Unit Sampling
Record Sampling
Calculate the minimum sample size required to meet
the auditor-specified criteria as well as to evaluate the
impact of any errors detected within the sample
35
Seeking Duplicates
36
35
36
4/12/2019
19
Sizing a Sample
37
Use of Pivot Tables
 Cross tabulate selection within the Cross tabulate creation
within the Analyze menu
Here the Rows will be selected for PRODCLS, the Columns by LOC
and the Subtotal fields will be MKTVAL and Value.
38
37
38
4/12/2019
20
ACL Scripts
 A series of commands intended to perform a
specific task, and multiple tasks
Save and repeat commands
Share best audit practices with others
Ensure consistency of audit approach and
inquiries
Create interactive audit inquiries that can be run
by non- auditors
 Scripts may be interactive
39
ACL Scripts
 Scripts may be:
Created or edited in the ACL Script Editor
Created using the Script Recorder
Created from a table history
Created from log entries
Copied from another ACL project
Exported from the project to be later used in
another ACL project
40
39
40
4/12/2019
21
IDEA and Data Analysis
 http://ideasupport.caseware.com/public/down
loadidea/
 Used for:
Anomalous items
The erroneous calculations
Gaps and duplicates within data
Trends within data over a period of time
Erroneous cross matching of data among systems
Statistical sampling
41
IDEA and Data Analysis
 Used for :
detective examination of files seeking unusual
patterns of data
verification of processing controls through re-
calculations of values
direct file interrogations and standard audit
analyses
42
41
42
4/12/2019
22
As with ACL
 Standard audit analyses such as:
trend analysis
time series analysis
data correlation
gap detection
aging of transactions
Benford’s Law analysis
43
Data Import
 Import data from a variety of sources including:
AS 400 databases
dBase files
Microsoft Access
Microsoft Excel
ODBC compliant databases
Print report and Adobe PDF files
SAP/AIS
Text files
XML data
44
43
44
4/12/2019
23
IDEA Work Area
45
Where
 1. The Menu Bar
 2. Operations Toolbar
 3. File Explorer Toolbar
 4. File Explorer Window
 5. Database Window
 6. Flyout Windows
 7. Status Bar
 8. Properties Window
46
45
46
4/12/2019
24
Data View
47
Properties Window
 View or edit the properties of the active file
including the:
Data
History
Field Statistics
Control Total
Criteria
Results
Indices
Comments
48
47
48
4/12/2019
25
Field Statistics
49
Analytical Techniques
50
49
50
4/12/2019
26
Analytical Techniques
 Statistical Sampling
51
Duplicates
52
51
52
4/12/2019
27
Other Analyses
 Correlation
 Regression
 Trend Analysis
 Time Series Analysis
53
IDEA Scripts
54
53
54
4/12/2019
28
SAS and Data Analysis
 One of the most commonly used Large Scale
Statistical Analysis Systems
 Designed to access databases, as well as flat, un-
formatted files
 Programming oriented
SAS programming language
 Can examine large volumes of data to uncover
hidden patterns, correlations and other insights
55
System Modules
 Base SAS
provides the ability to access data from multiple sources
in a variety of formats with the ability to handle data
manipulation, SQL and descriptive statistics
 SAS/STAT
provides routines for both univariate and multivariate
statistical modeling
 SAS/OR
allows the building of mathematical optimization models
for Operational Research purposes utilizing both linear
and nonlinear programming techniques. This makes it
ideal for network analysis in the audit frame
56
55
56
4/12/2019
29
System Modules
 SAS/ETS is the econometric and time series
module facilitating model building and time series
analysis
 SAS/Access contains a series of interfaces for
different vendor databases
 Other modules include SAS/AF, SAS/ Graph, SAS
QC, SAS/Share and SAS/Connect
57
System Modules
 Free university Edition:
 http://www.sas.com/en_us/software/university-
edition.html
 It operates in a virtual environment such as
Oracle’s VM VirtualBox Manager also so freely
downloadable
58
57
58
4/12/2019
30
University Edition
59
SAS Usage
 Fraud Detection
Anomaly detection – where alerts and triggered based on statistical
deviations from the norm
Business rules – where alerts are based on management’s general
experience and the application of the appropriate business rules
Predictive models – use alert triggers which established based on
scores derived from event characteristics that have seen to be
indicators of prior fraud events
Analysis of social networks – a more integrated method in which
through alerts are triggered based on known individuals suspected of
fraudulent behavior and associated with a current event or transaction
60
59
60
4/12/2019
31
SAS Enterprise Case
Management
 Can integrate data from multiple systems,
standardize data forms and apply and quality data
rules consistently across the organization
 Designed for forensic investigation and operation
mismanagement
 Can track cases across functions and business
units
 Facilitates recommending streamlining of business
processes to improve bottom line profitability
61
Questions?
Any Questions?
Don’t be Shy!
61
62
4/12/2019
32
AuditNet® and cRisk Academy
If you would like
forever access to this
webinar recording
If you are watching
the recording, and
would like to obtain
CPE credit for this
webinar
Previous AuditNet®
webinars are also
available on-demand
for CPE credit
http://criskacademy.com
http://ondemand.criskacade
my.com
Use coupon code: 50OFF
for a discount on this
webinar for one week
Thank You!
Jim Kaplan
AuditNet® LLC
1-800-385-1625
Email:info@auditnet.org
www.auditnet.org
Follow Me on Twitter for Special Offers - @auditnet
Join my LinkedIn Group –
https://www.linkedin.com/groups/44252/
Like my Facebook business page
https://www.facebook.com/pg/AuditNetLLC
Richard Cascarino & Associates
Cell: +1 970 819 7963
Tel +1 303 747 6087 (Skype Worldwide)
Tel: +1 970 367 5429
eMail: rcasc@rcascarino.com
Web: http://www.rcascarino.com
Skype: Richard.Cascarino
Page 64
63
64

Data Analytics for Auditors Data Analytics Software

  • 1.
    4/12/2019 1 Data Analytics -5 Data Analytics Software based on Data Analytics for Internal Auditors by Richard Cascarino About Jim Kaplan, CIA, CFE  President and Founder of AuditNet®, the global resource for auditors (now available on iOS, Android and Windows devices)  Auditor, Web Site Guru,  Internet for Auditors Pioneer  Recipient of the IIA’s 2007 Bradford Cadmus Memorial Award.  Author of “The Auditor’s Guide to Internet Resources” 2nd Edition Page 2 1 2
  • 2.
    4/12/2019 2 About AuditNet® LLC •AuditNet®, the global resource for auditors, is available on the Web, iPad, iPhone, Windows and Android devices and features: • Over 3,000 Reusable Templates, Audit Programs, Questionnaires, and Control Matrices • Training without Travel Webinars focusing on fraud, data analytics, IT audit, and internal audit • Audit guides, manuals, and books on audit basics and using audit technology • LinkedIn Networking Groups • Monthly Newsletters with Expert Guest Columnists • Surveys on timely topics for internal auditors • NASBA Approved CPE Sponsor Introductions Page 3 The views expressed by the presenters do not necessarily represent the views, positions, or opinions of AuditNet® LLC. These materials, and the oral presentation accompanying them, are for educational purposes only and do not constitute accounting or legal advice or create an accountant-client relationship. While AuditNet® makes every effort to ensure information is accurate and complete, AuditNet® makes no representations, guarantees, or warranties as to the accuracy or completeness of the information provided via this presentation. AuditNet® specifically disclaims all liability for any claims or damages that may result from the information contained in this presentation, including any websites maintained by third parties and linked to the AuditNet® website. Any mention of commercial products is for information only; it does not imply recommendation or endorsement by AuditNet® LLC 3 4
  • 3.
    4/12/2019 3 About Richard Cascarino,MBA, CIA, CISM, CFE, CRMA • Principal of Richard Cascarino & Associates based in Colorado USA • Over 28 years experience in IT audit training and consultancy • Past President of the Institute of Internal Auditors in South Africa • Member of ISACA • Member of Association of Certified Fraud Examiners • Author of Data Analytics for Internal Auditors 5 Today’s Agenda  Excel and Data Analysis  ACL and Data Analysis  IDEA and Data Analysis  SAS and Data Analysis Page 6 5 6
  • 4.
    4/12/2019 4 Excel and DataAnalysis Management Use of Excel Use of Excel in financial analysis Data Acquisition Excel Database Functions Excel Financial Functions Ratio Analysis Du Pont Analysis Z-Score Analysis ACL Add-in 7 Management Use of Excel  Risk management models  Budgeting and forecasting  Cash-flow models  Costing models  Inventory management 8 7 8
  • 5.
    4/12/2019 5 Excel in FinancialAnalysis  Requires: Clear identification of the intention of the analysis. This will commonly involve interviews with the interested parties Identification of the information the auditor are already has available or has access to Sanitizing the data to remove known erroneous information which could distort the analysis 9 Data Acquisition from a Website  the Get External Data from Web command on the Data tab 10 9 10
  • 6.
    4/12/2019 6 Data Acquisition from Elsewhere Querying an external database Get External Data on the Data tab Microsoft query under Other Sources Select ODBC driver Microsoft Query Wizard.  Importing a complete database table Get External Data on the Data tab Access, SQL Server, XML, or OLEDB 11 Excel Database Functions  Assist in the analysis of a large number of organized data records Formula tab Insert a Function from the Database category DSUM which calculates the sum of values in a field of a list or database, which satisfy specified conditions DSUM (database,field,criteria) DAVERAGE which calculates the average of values in a field of a list or database, which satisfy specified conditions 12 11 12
  • 7.
    4/12/2019 7 Excel Financial Functions 13 Paymentfunctions Price functions Investment value functions Interest rate functions Internal rate of return functions Yield functions Asset depreciation functions Duration functions Dollar functions Ratios  Liquidity ratios  Coverage ratios  Efficiency ratios  Profitability ratios  Leverage relations 14 13 14
  • 8.
    4/12/2019 8 Du Pont Analysis A method of evaluating the return on equity (ROE) 15 ROE = = x ROA = = x = = 𝑅𝑂𝐸 = / 1 − Du Pont Analysis  ROE can be improved by: Increasing the total asset turnover Increasing the net profit margin Increasing the amount of debt relative to equity 16 15 16
  • 9.
    4/12/2019 9 Z-Score Analysis  Helpsidentify those organizations potentially at risk to financial distress or bankruptcy Z = 1.2X1 + 1.4X2 + 3.3X3 + 0.6X4 + X5  Where: X1 = net working capital/total assets X2 = retained earnings/total assets X3 = EBIT/total assets X4 = market value of all equity/book value of total liabilities X5 = sales/total assets  Altman concluded that an organization with a Z-score below 2.675 should have an expectation of severe financial distress within the following year 17 ACL Add-in  Create read-only versions of information, formulas, and cells to avoid errors  Select samples for testing or investigation  Summarize and filter, stratify, and age information in Excel  Multiple computed columns may be added to  Notes may be added to multiple rows to indicate that analyst’s intention as well as variables selected 18 http://www.acl.com/products/acl-excel-add-in/ 17 18
  • 10.
    4/12/2019 10 ACL and DataAnalysis  Analyzing Live Data – dangers Auditors may inadvertently corrupt live data Audit tests may cause the live system to crash causing processing disruption and corporate damage Audit queries may significantly impact the speed of processing in critical systems resulted in their client dissatisfaction  While the analysis is being conducted, the data contents will move on 19 Verifying the Data  Generate statistics on the key fields including: Record counts Calculation of totals and, when appropriate, key subtotals Average, minimum and maximum values where appropriate  Classify and Summarize commands within the Analyze menu 20 19 20
  • 11.
  • 12.
    4/12/2019 12 Importing Data intoACL  Client-Server Capability  Data with Electronic Definitions ODBC Delimited files with embedded field names External electronic file definitions  Data Definition Wizard Selecting the data source File analysis Field analysis Defining field properties 23 Seeking Anomalous Data  Violations of the organization’s policies and procedures or legal violations of statue Customers with account balances exceeding their credit limits Excessive use of sole vendors Vendors with unusual or overseas bank accounts Dormant vendors Duplicate vendors Duplicate employees 24 23 24
  • 13.
    4/12/2019 13 Seeking Anomalous Data InvalidSocial Security numbers on employee records Excessive use of overtime Loans which are past due Transactions over corporate limits Multiple transactions to a single vendor in the same time period at, or just below, transaction valued limits  Auditor must predefine the extent of anomaly which would be of audit significance 25 Seeking Anomalous Data 26 25 26
  • 14.
    4/12/2019 14 Joining and MergingTables  From two tables with differing structures, but containing the common key field  Common mistake this kind of join is choosing the wrong file as the primary table  Eg Joining Transactions with Suppliers All transactions plus vendor name OR All Vendors with one transaction each 27 Joining and Merging Tables  New table to contain: Matched Unmatched Matched, all primary, all secondary Matched, all primary Matched, all secondary Many-to-many 28 27 28
  • 15.
    4/12/2019 15 Analysis Options  Classifycommand Quick data scan and summarize based on the unique value of a character field while some totaling specified numeric fields  Histogram command Produce 3-D vertical bar charts showing the distribution of records based on the values of a particular field of expression 29 Analysis of Sales 30 29 30
  • 16.
    4/12/2019 16 Analysis Options  Agecommand produces age summaries of the data facilitating the valuation of trends in values and volumes as well as verifying aging of outstanding balances and the like  Summarize command Generate reports on any number of unique key character and date values allowing numerical fields to be totaled and counted for each key value. 31 Aging 32 31 32
  • 17.
    4/12/2019 17 Analysis Options  Cross-tabulate facilitatesthe analysis of data fields in a tabular form of rows and columns  Perform Benford Analysis command will generate a digital analysis using Benford’s formula also includes the Z-statistic which is used where the sample size is large and the data is assumed to come from a normal population of which the variance is known 33 Benford Analysis 34 33 34
  • 18.
    4/12/2019 18 Analysis Options  Lookfor Gaps / look for Duplicates Commonly used by auditors to identify errors in sequenced databases  Sampling techniques Monetary Unit Sampling Record Sampling Calculate the minimum sample size required to meet the auditor-specified criteria as well as to evaluate the impact of any errors detected within the sample 35 Seeking Duplicates 36 35 36
  • 19.
    4/12/2019 19 Sizing a Sample 37 Useof Pivot Tables  Cross tabulate selection within the Cross tabulate creation within the Analyze menu Here the Rows will be selected for PRODCLS, the Columns by LOC and the Subtotal fields will be MKTVAL and Value. 38 37 38
  • 20.
    4/12/2019 20 ACL Scripts  Aseries of commands intended to perform a specific task, and multiple tasks Save and repeat commands Share best audit practices with others Ensure consistency of audit approach and inquiries Create interactive audit inquiries that can be run by non- auditors  Scripts may be interactive 39 ACL Scripts  Scripts may be: Created or edited in the ACL Script Editor Created using the Script Recorder Created from a table history Created from log entries Copied from another ACL project Exported from the project to be later used in another ACL project 40 39 40
  • 21.
    4/12/2019 21 IDEA and DataAnalysis  http://ideasupport.caseware.com/public/down loadidea/  Used for: Anomalous items The erroneous calculations Gaps and duplicates within data Trends within data over a period of time Erroneous cross matching of data among systems Statistical sampling 41 IDEA and Data Analysis  Used for : detective examination of files seeking unusual patterns of data verification of processing controls through re- calculations of values direct file interrogations and standard audit analyses 42 41 42
  • 22.
    4/12/2019 22 As with ACL Standard audit analyses such as: trend analysis time series analysis data correlation gap detection aging of transactions Benford’s Law analysis 43 Data Import  Import data from a variety of sources including: AS 400 databases dBase files Microsoft Access Microsoft Excel ODBC compliant databases Print report and Adobe PDF files SAP/AIS Text files XML data 44 43 44
  • 23.
    4/12/2019 23 IDEA Work Area 45 Where 1. The Menu Bar  2. Operations Toolbar  3. File Explorer Toolbar  4. File Explorer Window  5. Database Window  6. Flyout Windows  7. Status Bar  8. Properties Window 46 45 46
  • 24.
    4/12/2019 24 Data View 47 Properties Window View or edit the properties of the active file including the: Data History Field Statistics Control Total Criteria Results Indices Comments 48 47 48
  • 25.
  • 26.
  • 27.
    4/12/2019 27 Other Analyses  Correlation Regression  Trend Analysis  Time Series Analysis 53 IDEA Scripts 54 53 54
  • 28.
    4/12/2019 28 SAS and DataAnalysis  One of the most commonly used Large Scale Statistical Analysis Systems  Designed to access databases, as well as flat, un- formatted files  Programming oriented SAS programming language  Can examine large volumes of data to uncover hidden patterns, correlations and other insights 55 System Modules  Base SAS provides the ability to access data from multiple sources in a variety of formats with the ability to handle data manipulation, SQL and descriptive statistics  SAS/STAT provides routines for both univariate and multivariate statistical modeling  SAS/OR allows the building of mathematical optimization models for Operational Research purposes utilizing both linear and nonlinear programming techniques. This makes it ideal for network analysis in the audit frame 56 55 56
  • 29.
    4/12/2019 29 System Modules  SAS/ETSis the econometric and time series module facilitating model building and time series analysis  SAS/Access contains a series of interfaces for different vendor databases  Other modules include SAS/AF, SAS/ Graph, SAS QC, SAS/Share and SAS/Connect 57 System Modules  Free university Edition:  http://www.sas.com/en_us/software/university- edition.html  It operates in a virtual environment such as Oracle’s VM VirtualBox Manager also so freely downloadable 58 57 58
  • 30.
    4/12/2019 30 University Edition 59 SAS Usage Fraud Detection Anomaly detection – where alerts and triggered based on statistical deviations from the norm Business rules – where alerts are based on management’s general experience and the application of the appropriate business rules Predictive models – use alert triggers which established based on scores derived from event characteristics that have seen to be indicators of prior fraud events Analysis of social networks – a more integrated method in which through alerts are triggered based on known individuals suspected of fraudulent behavior and associated with a current event or transaction 60 59 60
  • 31.
    4/12/2019 31 SAS Enterprise Case Management Can integrate data from multiple systems, standardize data forms and apply and quality data rules consistently across the organization  Designed for forensic investigation and operation mismanagement  Can track cases across functions and business units  Facilitates recommending streamlining of business processes to improve bottom line profitability 61 Questions? Any Questions? Don’t be Shy! 61 62
  • 32.
    4/12/2019 32 AuditNet® and cRiskAcademy If you would like forever access to this webinar recording If you are watching the recording, and would like to obtain CPE credit for this webinar Previous AuditNet® webinars are also available on-demand for CPE credit http://criskacademy.com http://ondemand.criskacade my.com Use coupon code: 50OFF for a discount on this webinar for one week Thank You! Jim Kaplan AuditNet® LLC 1-800-385-1625 Email:info@auditnet.org www.auditnet.org Follow Me on Twitter for Special Offers - @auditnet Join my LinkedIn Group – https://www.linkedin.com/groups/44252/ Like my Facebook business page https://www.facebook.com/pg/AuditNetLLC Richard Cascarino & Associates Cell: +1 970 819 7963 Tel +1 303 747 6087 (Skype Worldwide) Tel: +1 970 367 5429 eMail: rcasc@rcascarino.com Web: http://www.rcascarino.com Skype: Richard.Cascarino Page 64 63 64