Downloaded 84 times

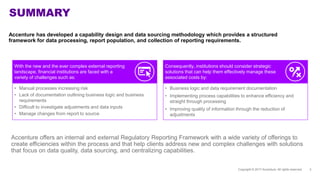
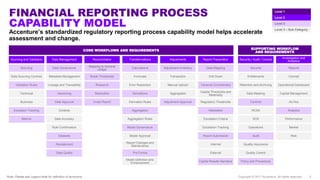
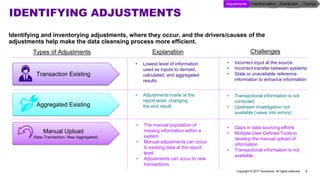
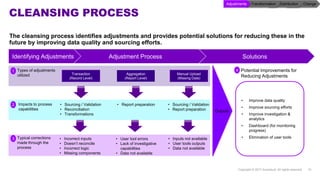
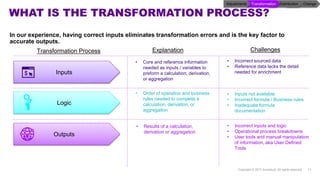
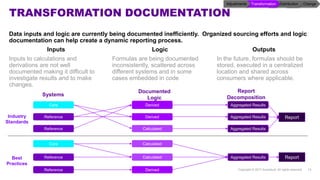
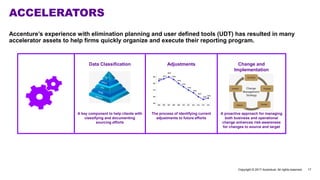


Accenture has developed a capability design and data sourcing methodology that provides a structured framework for processing data, populating reports, and collecting reporting requirements. The methodology addresses challenges such as manual processes, lack of documentation, difficulty investigating adjustments, and managing changes. It offers solutions focused on data quality, sourcing, and centralizing capabilities to create efficiencies and help clients address new complex reporting challenges.


![APT_Finance_Architect_Brochure_A4_WEB[2]](https://cdn.slidesharecdn.com/ss_thumbnails/98eb63e5-21b9-43b7-8a41-a7a53f2b3494-150723130227-lva1-app6892-thumbnail.jpg?width=640&height=640&fit=bounds)