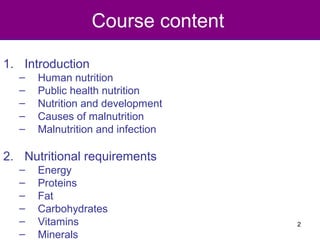
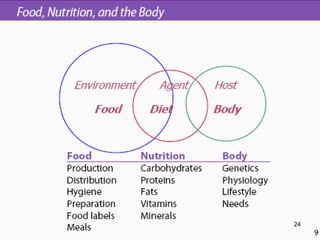
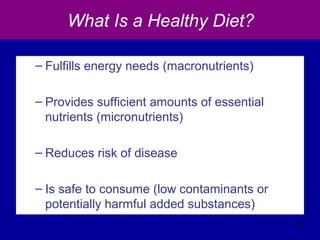
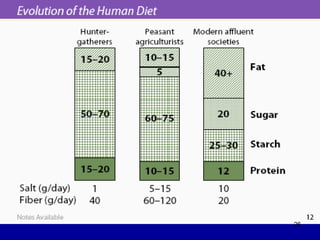
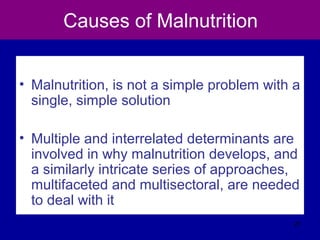
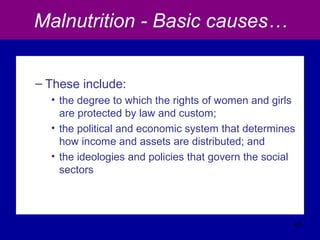
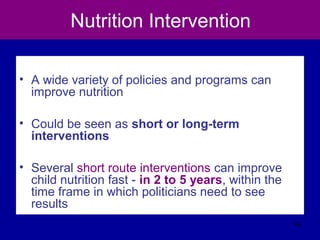
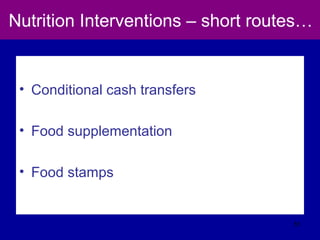
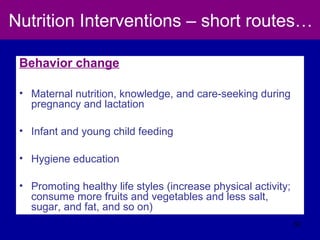
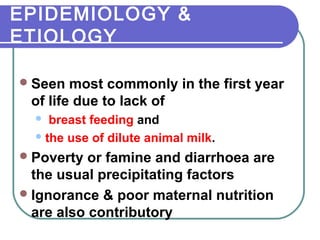
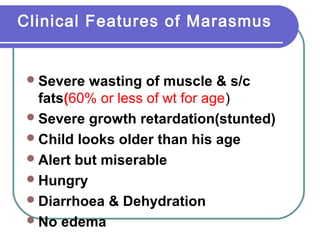
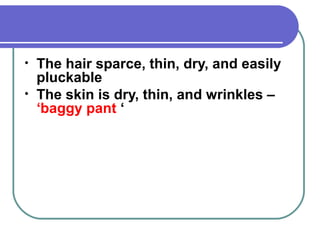
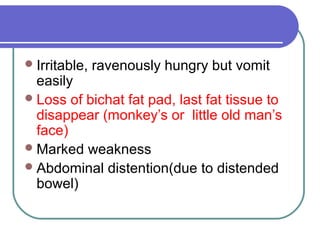
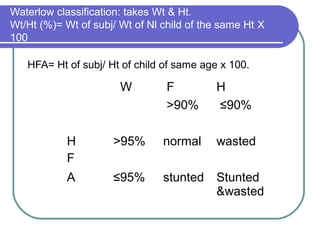
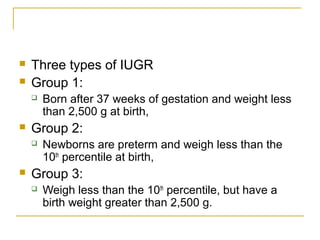
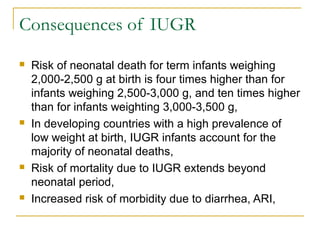
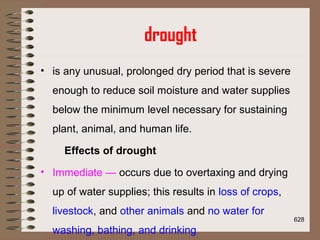
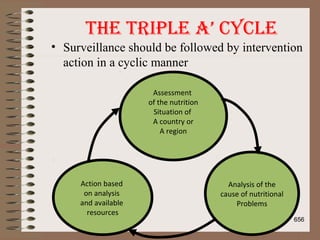
The document outlines the course content and objectives for a public health nutrition course taught at Gollis University, focusing on human nutrition, malnutrition, and nutrition interventions. It discusses various nutritional problems of public health importance, malnutrition causes, and the significance of a balanced diet for health and development. The course emphasizes both theoretical understanding and practical skills in addressing nutrition issues across different life stages and in various contexts.
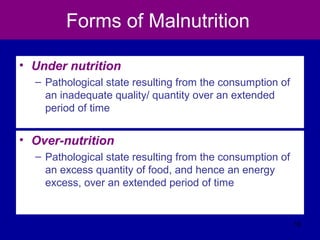

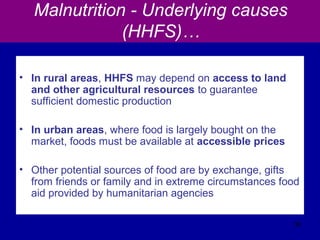
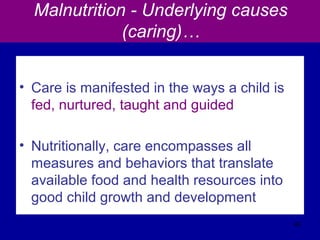
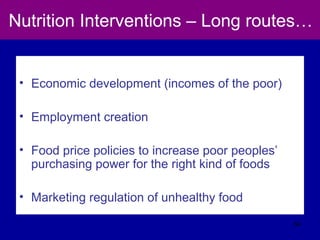
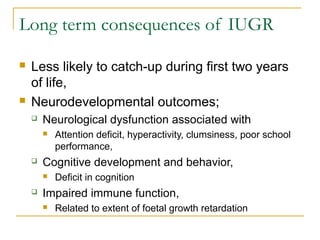
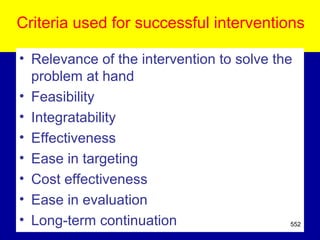
![Nutrition Interventions – short routes
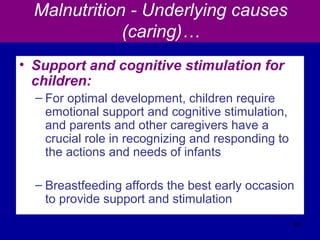
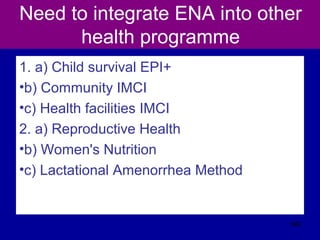
• Community-based nutrition and health services
(community growth promotion programs, community
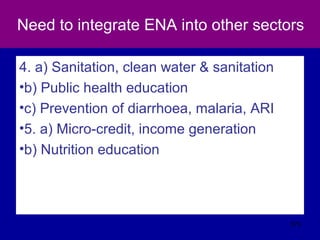
Integrated Management of Childhood Illnesses [C-IMCI])
• Facility-based nutrition and health services (health and
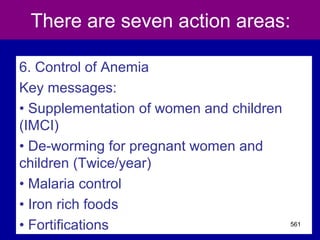
nutrition services, and antenatal care)
• Micronutrient supplements, Micronutrient fortification
• Targeted food aid
50](https://image.slidesharecdn.com/nutrition-151121063433-lva1-app6892/85/Nutrition-ppt-50-320.jpg)


![11/21/15 689
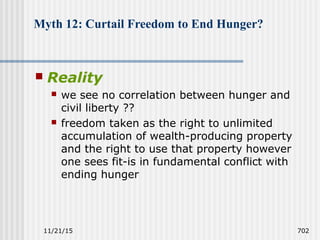
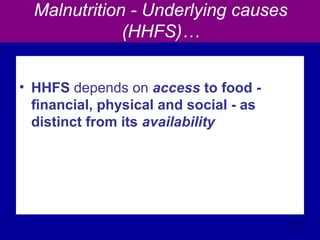
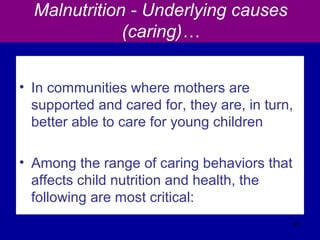
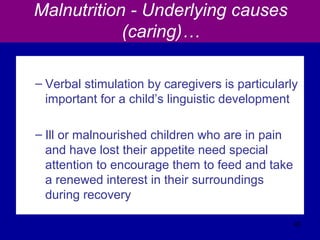
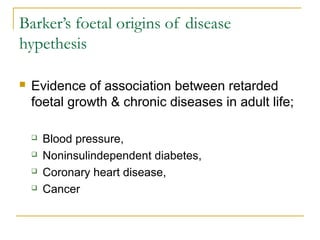
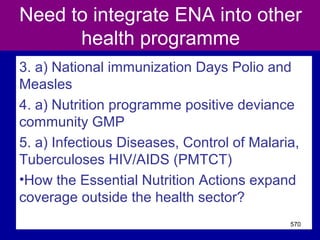
Rosset (2003) argues that "Food sovereignty goes beyond the
concept of food security… [Food security] means that…
[everyone] must have the certainty of having enough to eat each
day[,] … but says nothing about where that food comes from or
how it is produced."
Food sovereignty includes support for smallholders and for
collectively owned farms, fisheries, etc., rather than
industrializing these sectors in a minimally regulated global
economy](https://image.slidesharecdn.com/nutrition-151121063433-lva1-app6892/85/Nutrition-ppt-681-320.jpg)