This document analyzes cost escalation in France's nuclear power program from the 1970s to 1990s. It finds that the real per-kilowatt costs to construct the 58 nuclear reactors increased by approximately 60% over the duration of the program. However, the 4 largest reactors (N4 class) cost about twice as much to build per kilowatt as the other 54 reactors. A statistical analysis finds that real per-kilowatt costs increased by 3.6% annually on average. Later construction dates and lack of economies of scale help explain the much higher costs of the N4 reactors.
The document discusses operational forest fire simulation tools for supporting decision making. It outlines several models for fire propagation, including empirical Rothermel-based models and computational fluid dynamics physical models. It then describes the InfoSIM system, which integrates these propagation models, high-resolution wind data, and fuel maps into a GIS-based platform to enable real-time 3D wildfire simulation and analysis to support wildfire management. The system has been operationally implemented and validated in several regions in Spain.
The document describes a student project to measure solar flux at 20.2 GHz and 30.5 GHz using a SATCOM earth station antenna. The objectives are to 1) characterize the SATCOM antenna using available satellite and reference station data and 2) measure solar flux at 20.2GHz and 30.5GHz using the characterized antenna. No observatories currently measure solar flux at these frequencies, so the measurements could benefit researchers. The student is assigned homework to study methods for calculating the antenna's G/T ratio and determining sun flux from G/T measurements.
This document summarizes simulations of CO2 plumes from large power plants in Europe using different atmospheric transport models at kilometer and sub-kilometer scales. The simulations are evaluated against in-situ and remote sensing observations of plumes from the Belchatow and Jaenschwalde power plants. The high-resolution COSMO-GHG model shows reasonably good performance compared to observations but tends to overestimate plume widths. Sensitivity runs show some dependence on model settings like turbulence schemes and emission heights. The study aims to better understand plume dispersion at scales relevant for satellite-based CO2 monitoring.
CIRED Paper 1414 - Evaluation of the level of prediction errorsLoïc LE GARS
1) The document describes a methodology for simulating errors in renewable energy generation forecasts and sub-hourly variations using historical data.
2) The methodology involves simulating hourly wind and solar power production at different locations, then simulating the placement of renewable energy plants and generating forecasts errors based on numerical weather predictions.
3) It then discusses how the simulation tools can help evaluate reserve requirements for power systems with high shares of renewable energy.
The TropiSCAT experiment aims to characterize vegetation using multi-frequency polarimetric SAR data. Preliminary experiments using a light setup validated the feasibility. The full experiment is now installed in French Guiana, measuring backscattering, coherence over timescales from minutes to years. Initial results show high coherence on the tower validating measurements, and differences between bands and polarizations over diurnal cycles. Future work includes comparing measurements to models and deforestation/regeneration.
Using Singular Spectrum Analysis to Model Electricity PricesNicolasRR
This document discusses using singular spectrum analysis (SSA) to model electricity prices. SSA decomposes time series data into trend, periodic, and noise components. The author applies SSA to French electricity prices, trading volumes, and consumption data. SSA shows the price trends are better correlated with consumption data than with trading volumes. The author proposes a model where the short-range price components are a function of short-range consumption components and noise, providing a physically-based way to link prices and consumption for scenario testing and analysis.
The document discusses local and regional PV power forecasting based on PV measurements, satellite data, and numerical weather predictions. It summarizes a PV power prediction system that uses different data sources and models for various forecast horizons, from 15 minutes to 5 hours ahead. The system combines persistence forecasts, satellite-derived cloud motion forecasts, PV simulations using numerical weather predictions, and statistical models to improve forecast accuracy compared to individual models. Regional forecasts for Germany show lower errors than single site forecasts.
The document discusses cost management processes including cost estimation, budgeting, and control. It defines key terms related to cost management like budget at completion (BAC), planned value (PV), earned value (EV), schedule performance index (SPI), schedule variance (SV), cost performance index (CPI), and cost variance (CV). These metrics are used to compare planned costs and schedule to actual costs and progress to identify if a project is on budget and on track.
The document discusses various topics related to software project management including scheduling, cost estimation, pricing models, types of revenues, project planning standards, and factors affecting productivity. It provides information on estimating project timelines and costs using algorithms like COCOMO, function point analysis, and object point counting. Risk management, quality control, and other aspects of creating a formal project management plan are also outlined.
The document provides information on project cost management. It defines cost estimating, budgeting, and control, and describes types of costs like direct, indirect, fixed and variable costs. It also discusses estimation techniques like analogous estimating, parametric estimating, and bottom-up estimating. Cost budgeting involves aggregating estimates to establish a cost baseline. Earned value analysis integrates cost, schedule and scope to analyze performance.
Project management approaches construction and ITSandeep Bangera
The document compares project management approaches in construction and information technology. It outlines the typical life cycles for construction and IT projects. Construction projects generally have more mandatory interdependencies between activities, while IT projects have more flexibility in their life cycles. The document also examines differences in the nature of projects, project management maturity levels, procurement processes, challenges and risks, and stakeholder influence between the two domains. Key life cycle phases and models used in construction and software development are defined through figures and examples.
Lecture 05:Advanced Project Management PM Processes and FrameworkFida Karim 🇵🇰
Advanced Project Management PM Processes and Framework,
comprising a set of interrelated processes and tools, ranging from simple to complex, and is based on the accepted principles of management used for planning, estimating and controlling work activities with a view to developing specifically defined outputs that are to be delivered by a certain time, to a defined quality standard and with a given level of resources so that the project goal and outcomes/benefits are realized.
Effective project management is essential for the success of any project – whether in the private or public sectors – and irrespective of its category, size and complexity.
The document discusses key concepts in project management. It defines a project, outlines the five process groups in project management, and describes various knowledge areas. It discusses project selection methods like payback period, net present value, and internal rate of return. It also covers project life cycles and integration, highlighting inputs, tools, techniques and outputs of developing a project charter.
The document provides an overview of a presentation on implementing an Earned Value Management System (EVMS) at a federal agency on a low budget. It discusses EVMS concepts and benefits. It then details a case study where a recession-proof EVMS was developed using existing tools and processes to integrate project scheduling, budgeting, reporting, and analysis with minimal costs. The solution standardized processes, automated data collection and linking of schedules and costs. It improved project performance monitoring, accountability, and success rates.
The document discusses various aspects of project management. It begins by outlining the different stages of a project including planning and scheduling, data collection, status updates, and ensuring successful completion. It then defines what a project is, its key characteristics, and how project management applies knowledge and techniques to meet stakeholder needs and expectations. The document also discusses why companies and individuals use project management and what goes into a project management plan. It provides overviews of the project management process, process groups, knowledge areas, and integration management.
This document summarizes the costs of France's nuclear power program from 1970 to 2000. Some key points:
1) France successfully scaled up nuclear power, reaching 80% of electricity from nuclear. This was a substantial, rapid, and systemic increase in nuclear deployment.
2) The program was made possible by a unique institutional framework that allowed for centralized decision making, standardization, and regulatory stability.
3) Despite being the most successful nuclear scale-up, costs still escalated substantially over time. Specific reactor costs increased by more than a factor of three between the first and last generations. Operating costs remained stable.
4) The French case shows that large-scale, complex energy technologies face significant
This application note provides an overview of the most relevant characteristics and considerations regarding commercial and tertiary sector photovoltaic (PV) power plants (100 kW to 2 MW). It is aimed at potential investors, including industrial and tertiary sector companies, communities and financial institutions, among other parties.
Over the past decade, the competitiveness of PV as opposed to other electricity sources has improved considerably, mainly driven by new technological improvements and cost reductions per unit of installed power. In many situations, PV systems represent a profitable and relatively low risk investment opportunity. Nevertheless, a case-by-case analysis should be performed to properly evaluate each project.
The principal technological choices to be made during a PV plant development project concern the actual PV panels, the mounting structures, the inverter, and the storage system. Relatively few major types of systems are currently available on the market for each of these components. This application note describes their main advantages and disadvantages. It also provides a comprehensive overview of the difficulties and risks that can be encountered during the PV plant development process.
The business model of the project will be determined by the local system of government incentives. This application note depicts key issues related to financing and the economics of a PV investment. It describes the choice between a corporate loan and a leasing formula and the calculation of the Internal Rate of Return (IRR). Finally, it executes a sensitivity analysis on the Levelized Cost of Energy (LCOE) of the PV plant. The cost of the EPC contractor and the local irradiation level turn out to be major parameters influencing the result. The discount rate and the lifetime of the PV plants influence the LCOE to a lesser extent. Note that the LCOE needs to be compared with retail electricity prices for residential PV projects, with commercial electricity rates before VAT for company PV projects, and with the cost of other electricity generation sources (e.g. a gas fired combined cycle plant) for electrical utility PV projects.
The document discusses several topics related to nuclear energy including:
1) Nuclear energy is a prominent energy source in Europe, accounting for 31% of produced electricity, and has very low greenhouse gas emissions compared to fossil fuels.
2) Safety procedures and international cooperation have improved nuclear safety significantly, with the probability of core damage decreased by a factor of 10 to 100.
3) Funds set aside during plant operation can cover decommissioning costs, which amount to only 5% of the total generation costs due to technological and financial factors.
The document summarizes the experience of five European countries - Denmark, Portugal, Spain, Ireland, and Germany - in integrating high levels of wind power generation into their electric power systems. Denmark has among the highest wind power penetration levels in the world at times supplying over 25% of its electricity demand from wind. Success has been achieved through strong grid interconnectors, an active electricity market that incorporates wind power forecasting, and flexible generation. Future challenges include further integrating renewable energy and coordinating grid development across countries as wind penetration levels increase throughout Europe.
This document provides information on offshore wind energy from multiple sources. It discusses the historical contributors to greenhouse gas emissions from the industrial era to today. It also summarizes trends in the costs of offshore wind technology, including declining costs due to larger turbines, higher capacity factors, and moving to deeper waters and greater distances from shore. Forecasts show offshore wind growing significantly and becoming more competitive over the coming decades as technology improves.
This document discusses Italy's nuclear power program and the importance of nuclear power for Italy. Some key points:
- Italy relies heavily on energy imports, with 78% of its electricity production coming from imports. Nuclear power could help improve energy security and reduce carbon emissions.
- Enel has signed agreements with EDF to jointly develop at least 4 new nuclear power plants in Italy using EPR technology, with the goal of having the first plant operational by 2020.
- The document outlines Italy's new nuclear legal framework established through Law 99/2009 and Decree 31/2010, which set up the process for siting and licensing new nuclear plants.
- Developing nuclear power could provide significant economic and
2011 deep research report on eu and china offshore wind power industrysmarter2011
This 257-page report provides an in-depth analysis of the offshore wind power industries in the EU and China in 2011. It includes overviews of industry developments, key technologies, investment costs, and case studies. The report also features a comprehensive databank on offshore wind farms and turbines in major markets like the UK, Germany, Denmark, and China. Overall, the report finds that Europe continues to lead the offshore wind sector due to strong government support, while China represents an exciting growth opportunity for the future of offshore wind power.
Is nuclear energy solution to our power problems ?Harsh Gupta
Nuclear energy originates from splitting uranium atoms through fission. At nuclear power plants, fission is used to generate heat and produce steam to power turbines and generate electricity. Construction costs for plants are very high but operating costs have decreased over time. Nuclear power produces radioactive waste that remains dangerous for hundreds of thousands of years, and accidents like Chernobyl show the risks of contamination. There are also concerns about nuclear materials being used for weapons.
The role of electricity in heating and coolingLeonardo ENERGY
Following the European Commission’s Heating & Cooling Strategy Consultation Forum, held in Brussels on September 9th, very significant opportunities exist within the heating and cooling sector to better connect the EU’s electricity and thermal energy markets.
The use of electricity in heating and cooling helps to increase the penetration of renewables, improve efficiency, lower carbon emissions and save significant investment costs in renewables integration. However, crucial to these uses is the promotion of efficient electrothermal technologies.
This document summarizes the future prospects for solar power in the United Kingdom across three markets: large-scale solar farms, commercial rooftop solar, and residential rooftop solar. It finds that all three solar markets could be economic without government support within the next decade as solar costs continue to fall rapidly. Residential solar with battery storage may achieve payback periods of less than 10 years by 2025, driving widespread adoption. However, integrating high levels of variable solar power will involve some grid costs such as more flexible power scheduling and storage options that need to be weighed against environmental and energy security benefits.
Policy Challenges of Nuclear Reactor Construction: Cost Escalation and Crowd...myatom
This document analyzes the policy challenges of nuclear reactor construction, specifically cost escalation and crowding out of alternatives. It examines these issues through a comparison of the US and French nuclear industries and statistical analysis. The key findings are:
1) Both the US and French nuclear industries experienced severe and persistent cost escalation for new reactor construction, with actual costs greatly exceeding initial projections.
2) Commitment to nuclear power appears to have crowded out investment in energy efficiency and renewable alternatives in both countries. States without plans for new nuclear reactors have achieved more with efficiency and renewables.
3) Nuclear power is substantially more costly than alternatives like efficiency and renewable energy. However, the US has significantly greater potential for developing
This document summarizes a study that evaluated the performance of micro wind turbines installed at an experimental housing development called the EcoSmart Show Village over a 12-month period. Five micro wind turbines of two different models were tested under real-world conditions. Measured outputs were lower than theoretical outputs, likely due to turbulence from the urban environment and inefficiencies in the inverters. Factors like lateral turbulence and inverter consumption need to be considered to accurately assess the potential output of micro turbines in built-up areas.
Continuing on describing what could be the future of nuclear industry, Gilles MATHONNIERE, economical expert at the I-tésé (CEA) explained the place of nuclear energy in 2050 and 2100 and the importance of Fast Reactors in the energy mix for electricity generation.
The stress tests of 145 nuclear reactors in the EU found hundreds of defects, with dozens failing international safety standards. Bringing all reactors up to standard could cost €25 billion. While the EU energy commissioner called the situation "satisfactory", some MEPs criticized the report for not requiring stronger actions and some reactors did not have sufficient safety measures to handle a serious natural disaster. Campaigners demanded to know how standards would be enforced on the nuclear industry given the large costs of the identified upgrades.
Similar to Nuclear Reactor Cost Escalationin France Komanoff (20)
The document summarizes the major systems and components of a boiling water reactor (BWR) plant. It describes the reactor vessel internals that produce steam from heating water, the moisture separators and dryers, main turbine system that converts steam to electricity, and emergency core cooling systems. The BWR uses circulating water to transfer heat from the reactor core to power the main turbine, and has safety systems to inject water into the reactor vessel in the event of a loss of coolant accident.
This document summarizes updated capital cost estimates for various electricity generation technologies that were commissioned by the U.S. Energy Information Administration. Key findings include that overnight capital costs for coal and nuclear plants are 25-37% higher than prior estimates, while natural gas costs remained similar. Solar photovoltaic costs declined 25% due to larger plant sizes and lower component costs. Onshore wind costs increased 21%, while offshore wind costs increased 50% to reflect first-of-a-kind U.S. project costs. Geothermal and biomass costs also increased versus prior estimates. These updated cost estimates will be used in EIA's modeling and analysis of technology choices in the electric power sector.
10 years of experience with Westinghouse fuel at NPP Temelinmyatom
Westinghouse fuel has been used at the Temelin NPP for 10 years. Some key points include:
- The first Westinghouse fuel assembly was loaded in 2000 and the plant achieved first criticality 3 months later. There have been 15 fuel cycles representing 960 fuel assemblies.
- Issues encountered include incomplete rod insertions, fuel assembly bowing and growth, and leaking fuel rods. Modifications to fuel assembly designs have helped address these issues.
- A post-irradiation inspection program provided data on fuel performance to support continued licensing of new fuel designs. While visual examinations showed little corrosion, measurements revealed unexpected fuel assembly twisting and bowing.
TVSA-T fuel assembly for “Temelin” NPP. Main results of design and safety ana...myatom
The document summarizes the design and safety analyses of the TVSA-T fuel assembly developed for the Temelin NPP in the Czech Republic. Key points include:
1) TVSA-T is based on the proven TVSA design with additional modifications like combined spacer grids and a longer fuel column.
2) Extensive testing and analyses were conducted to validate the TVSA-T design including thermohydraulic tests, mechanical tests, and safety analyses.
3) The design was successfully licensed for use at Temelin NPP unit 1 and meets all safety criteria for normal operation and accident conditions.
The document discusses the evolution and advanced designs of VVER reactors. It describes the current challenges facing nuclear power plants and how generation 3+ designs, such as the VVER-1200, aim to address these through extended lifetimes, reduced costs and construction times. Future innovative designs discussed include the VVER-600, VVER-SCP generation 4 supercritical water cooled reactor, and concepts using tight fuel assemblies for a closed nuclear fuel cycle. The VVER-1200 design for project AES-2006 forms the basis for the further developed MIR-1200 design being implemented in the Czech Republic.
This document discusses the power uprate project at the NPP Temelín nuclear power plant in the Czech Republic. The project aims to increase the reactor thermal power from 3000 MWt to 3120 MWt and install new turbine low pressure parts to boost the generator output from 1016 MWe to 1081 MWe. The project will be carried out through analytical evaluations, core design updates, safety analysis revisions, and minor equipment modifications. It is scheduled to be implemented at Unit 1 in 2012 while ensuring the plant's safety criteria and limits remain unchanged.
This document discusses materials used for equipment in reactor plants V-320 and V-491. It provides details on the reactor pressure vessel such as dimensions, mass, and steel grades used for different components. It also discusses how materials were improved for V-491 to decrease radiation embrittlement and increase brittle fracture resistance. Surveillance programs and specifications for specimens are outlined to monitor changes in pressure vessel material properties during operation. Regulatory requirements for equipment design, welding, and inspections are also summarized.
Key Features of MIR.1200 (AES-2006) design and current stage of Leningrad NP...myatom
The document discusses the key features and current construction status of the MIR.1200/AES-2006 nuclear power plant design and Leningrad NPP-2, which uses this design. The MIR.1200 design is an evolution of previous VVER reactor designs with improved safety features like a double containment structure and passive safety systems. Leningrad NPP-2 Units 1 and 2 are currently under construction in Russia using this design. The design provides enhanced safety, economics, and project attractiveness through an evolutionary approach and leveraging designs already implemented in other plants.
Let's Integrate MuleSoft RPA, COMPOSER, APM with AWS IDP along with Slackshyamraj55
Discover the seamless integration of RPA (Robotic Process Automation), COMPOSER, and APM with AWS IDP enhanced with Slack notifications. Explore how these technologies converge to streamline workflows, optimize performance, and ensure secure access, all while leveraging the power of AWS IDP and real-time communication via Slack notifications.
How to Get CNIC Information System with Paksim Ga.pptxdanishmna97
Pakdata Cf is a groundbreaking system designed to streamline and facilitate access to CNIC information. This innovative platform leverages advanced technology to provide users with efficient and secure access to their CNIC details.
Ivanti’s Patch Tuesday breakdown goes beyond patching your applications and brings you the intelligence and guidance needed to prioritize where to focus your attention first. Catch early analysis on our Ivanti blog, then join industry expert Chris Goettl for the Patch Tuesday Webinar Event. There we’ll do a deep dive into each of the bulletins and give guidance on the risks associated with the newly-identified vulnerabilities.
In the rapidly evolving landscape of technologies, XML continues to play a vital role in structuring, storing, and transporting data across diverse systems. The recent advancements in artificial intelligence (AI) present new methodologies for enhancing XML development workflows, introducing efficiency, automation, and intelligent capabilities. This presentation will outline the scope and perspective of utilizing AI in XML development. The potential benefits and the possible pitfalls will be highlighted, providing a balanced view of the subject.
We will explore the capabilities of AI in understanding XML markup languages and autonomously creating structured XML content. Additionally, we will examine the capacity of AI to enrich plain text with appropriate XML markup. Practical examples and methodological guidelines will be provided to elucidate how AI can be effectively prompted to interpret and generate accurate XML markup.
Further emphasis will be placed on the role of AI in developing XSLT, or schemas such as XSD and Schematron. We will address the techniques and strategies adopted to create prompts for generating code, explaining code, or refactoring the code, and the results achieved.
The discussion will extend to how AI can be used to transform XML content. In particular, the focus will be on the use of AI XPath extension functions in XSLT, Schematron, Schematron Quick Fixes, or for XML content refactoring.
The presentation aims to deliver a comprehensive overview of AI usage in XML development, providing attendees with the necessary knowledge to make informed decisions. Whether you’re at the early stages of adopting AI or considering integrating it in advanced XML development, this presentation will cover all levels of expertise.
By highlighting the potential advantages and challenges of integrating AI with XML development tools and languages, the presentation seeks to inspire thoughtful conversation around the future of XML development. We’ll not only delve into the technical aspects of AI-powered XML development but also discuss practical implications and possible future directions.
Your One-Stop Shop for Python Success: Top 10 US Python Development Providersakankshawande
Simplify your search for a reliable Python development partner! This list presents the top 10 trusted US providers offering comprehensive Python development services, ensuring your project's success from conception to completion.
Salesforce Integration for Bonterra Impact Management (fka Social Solutions A...Jeffrey Haguewood
Sidekick Solutions uses Bonterra Impact Management (fka Social Solutions Apricot) and automation solutions to integrate data for business workflows.
We believe integration and automation are essential to user experience and the promise of efficient work through technology. Automation is the critical ingredient to realizing that full vision. We develop integration products and services for Bonterra Case Management software to support the deployment of automations for a variety of use cases.
This video focuses on integration of Salesforce with Bonterra Impact Management.
Interested in deploying an integration with Salesforce for Bonterra Impact Management? Contact us at sales@sidekicksolutionsllc.com to discuss next steps.
OpenID AuthZEN Interop Read Out - AuthorizationDavid Brossard
During Identiverse 2024 and EIC 2024, members of the OpenID AuthZEN WG got together and demoed their authorization endpoints conforming to the AuthZEN API
Unlock the Future of Search with MongoDB Atlas_ Vector Search Unleashed.pdfMalak Abu Hammad
Discover how MongoDB Atlas and vector search technology can revolutionize your application's search capabilities. This comprehensive presentation covers:
* What is Vector Search?
* Importance and benefits of vector search
* Practical use cases across various industries
* Step-by-step implementation guide
* Live demos with code snippets
* Enhancing LLM capabilities with vector search
* Best practices and optimization strategies
Perfect for developers, AI enthusiasts, and tech leaders. Learn how to leverage MongoDB Atlas to deliver highly relevant, context-aware search results, transforming your data retrieval process. Stay ahead in tech innovation and maximize the potential of your applications.
#MongoDB #VectorSearch #AI #SemanticSearch #TechInnovation #DataScience #LLM #MachineLearning #SearchTechnology
HCL Notes and Domino License Cost Reduction in the World of DLAUpanagenda
Webinar Recording: https://www.panagenda.com/webinars/hcl-notes-and-domino-license-cost-reduction-in-the-world-of-dlau/
The introduction of DLAU and the CCB & CCX licensing model caused quite a stir in the HCL community. As a Notes and Domino customer, you may have faced challenges with unexpected user counts and license costs. You probably have questions on how this new licensing approach works and how to benefit from it. Most importantly, you likely have budget constraints and want to save money where possible. Don’t worry, we can help with all of this!
We’ll show you how to fix common misconfigurations that cause higher-than-expected user counts, and how to identify accounts which you can deactivate to save money. There are also frequent patterns that can cause unnecessary cost, like using a person document instead of a mail-in for shared mailboxes. We’ll provide examples and solutions for those as well. And naturally we’ll explain the new licensing model.
Join HCL Ambassador Marc Thomas in this webinar with a special guest appearance from Franz Walder. It will give you the tools and know-how to stay on top of what is going on with Domino licensing. You will be able lower your cost through an optimized configuration and keep it low going forward.
These topics will be covered
- Reducing license cost by finding and fixing misconfigurations and superfluous accounts
- How do CCB and CCX licenses really work?
- Understanding the DLAU tool and how to best utilize it
- Tips for common problem areas, like team mailboxes, functional/test users, etc
- Practical examples and best practices to implement right away
Taking AI to the Next Level in Manufacturing.pdfssuserfac0301
Read Taking AI to the Next Level in Manufacturing to gain insights on AI adoption in the manufacturing industry, such as:
1. How quickly AI is being implemented in manufacturing.
2. Which barriers stand in the way of AI adoption.
3. How data quality and governance form the backbone of AI.
4. Organizational processes and structures that may inhibit effective AI adoption.
6. Ideas and approaches to help build your organization's AI strategy.
How to Interpret Trends in the Kalyan Rajdhani Mix Chart.pdfChart Kalyan
A Mix Chart displays historical data of numbers in a graphical or tabular form. The Kalyan Rajdhani Mix Chart specifically shows the results of a sequence of numbers over different periods.
5th LF Energy Power Grid Model Meet-up SlidesDanBrown980551
5th Power Grid Model Meet-up
It is with great pleasure that we extend to you an invitation to the 5th Power Grid Model Meet-up, scheduled for 6th June 2024. This event will adopt a hybrid format, allowing participants to join us either through an online Mircosoft Teams session or in person at TU/e located at Den Dolech 2, Eindhoven, Netherlands. The meet-up will be hosted by Eindhoven University of Technology (TU/e), a research university specializing in engineering science & technology.
Power Grid Model
The global energy transition is placing new and unprecedented demands on Distribution System Operators (DSOs). Alongside upgrades to grid capacity, processes such as digitization, capacity optimization, and congestion management are becoming vital for delivering reliable services.
Power Grid Model is an open source project from Linux Foundation Energy and provides a calculation engine that is increasingly essential for DSOs. It offers a standards-based foundation enabling real-time power systems analysis, simulations of electrical power grids, and sophisticated what-if analysis. In addition, it enables in-depth studies and analysis of the electrical power grid’s behavior and performance. This comprehensive model incorporates essential factors such as power generation capacity, electrical losses, voltage levels, power flows, and system stability.
Power Grid Model is currently being applied in a wide variety of use cases, including grid planning, expansion, reliability, and congestion studies. It can also help in analyzing the impact of renewable energy integration, assessing the effects of disturbances or faults, and developing strategies for grid control and optimization.
What to expect
For the upcoming meetup we are organizing, we have an exciting lineup of activities planned:
-Insightful presentations covering two practical applications of the Power Grid Model.
-An update on the latest advancements in Power Grid -Model technology during the first and second quarters of 2024.
-An interactive brainstorming session to discuss and propose new feature requests.
-An opportunity to connect with fellow Power Grid Model enthusiasts and users.
Monitoring and Managing Anomaly Detection on OpenShift.pdfTosin Akinosho
Monitoring and Managing Anomaly Detection on OpenShift
Overview
Dive into the world of anomaly detection on edge devices with our comprehensive hands-on tutorial. This SlideShare presentation will guide you through the entire process, from data collection and model training to edge deployment and real-time monitoring. Perfect for those looking to implement robust anomaly detection systems on resource-constrained IoT/edge devices.
Key Topics Covered
1. Introduction to Anomaly Detection
- Understand the fundamentals of anomaly detection and its importance in identifying unusual behavior or failures in systems.
2. Understanding Edge (IoT)
- Learn about edge computing and IoT, and how they enable real-time data processing and decision-making at the source.
3. What is ArgoCD?
- Discover ArgoCD, a declarative, GitOps continuous delivery tool for Kubernetes, and its role in deploying applications on edge devices.
4. Deployment Using ArgoCD for Edge Devices
- Step-by-step guide on deploying anomaly detection models on edge devices using ArgoCD.
5. Introduction to Apache Kafka and S3
- Explore Apache Kafka for real-time data streaming and Amazon S3 for scalable storage solutions.
6. Viewing Kafka Messages in the Data Lake
- Learn how to view and analyze Kafka messages stored in a data lake for better insights.
7. What is Prometheus?
- Get to know Prometheus, an open-source monitoring and alerting toolkit, and its application in monitoring edge devices.
8. Monitoring Application Metrics with Prometheus
- Detailed instructions on setting up Prometheus to monitor the performance and health of your anomaly detection system.
9. What is Camel K?
- Introduction to Camel K, a lightweight integration framework built on Apache Camel, designed for Kubernetes.
10. Configuring Camel K Integrations for Data Pipelines
- Learn how to configure Camel K for seamless data pipeline integrations in your anomaly detection workflow.
11. What is a Jupyter Notebook?
- Overview of Jupyter Notebooks, an open-source web application for creating and sharing documents with live code, equations, visualizations, and narrative text.
12. Jupyter Notebooks with Code Examples
- Hands-on examples and code snippets in Jupyter Notebooks to help you implement and test anomaly detection models.
Ocean lotus Threat actors project by John Sitima 2024 (1).pptxSitimaJohn
Ocean Lotus cyber threat actors represent a sophisticated, persistent, and politically motivated group that poses a significant risk to organizations and individuals in the Southeast Asian region. Their continuous evolution and adaptability underscore the need for robust cybersecurity measures and international cooperation to identify and mitigate the threats posed by such advanced persistent threat groups.
Ocean lotus Threat actors project by John Sitima 2024 (1).pptx
Nuclear Reactor Cost Escalationin France Komanoff
1. Cost Escalation in France’s Nuclear Reactors: A Statistical Examination
Charles Komanoff
January, 2010
Summary
From the early 1970s to the late 1990s, the French utility organization, Électricité de
France, constructed 58 commercial nuclear power reactors. All used the pressurized
water reactor (PWR) design developed by the Westinghouse Corporation, with three
different unit sizes: 900, 1,300 and 1,500 megawatts. From the beginning of that
program nearly to the end, the real per-kilowatt costs to construct these plants
increased by approximately 60%.
There is an important caveat to this finding, however, pertaining to the four units
employing the largest (1,500-MW) reactor design, known as N4. Taken as a whole, the
four N4 reactors cost approximately twice as much to build, per kilowatt, as the
other 54 reactors. Their grossly higher costs are only partially reflected in the 60%
figure above. From a statistical standpoint, the doubling of costs for the N4 reactors may
be attributed to three factors (in declining order of importance): (i) their later sequencing,
which subjected them to more chronological-related cost escalation, (ii) apparent N4-
specific design or construction issues, and (iii) the loss of construction economies due to
being built concurrently with very few other units.
Nevertheless, these findings, even with the caveat, are at odds with a recently published
assertion that between the first reactors and the last, the real per-kilowatt costs of the 58
French reactors increased by more than a factor of three. That conclusion appears to have
been based on a cursory comparison of costs of a few reactors at either cost extreme. A
selective approach such as this is not a suitable method for distilling results from a large
database; in that case, moreover, the comparison appears to rest on numerical
imprecision. To derive my results, I have employed the standard statistical tool for
analyzing large datasets: regression analysis.
Prologue
Late last year, in a chance encounter in New York City, the renowned physicist and
energy expert Amory Lovins shared with me some “startling news”: a researcher at the
International Institute of Applied Systems Analysis in Vienna had obtained cost data for
the 58 reactors built in France during that country’s big nuclear power push, primarily in
the 1970s and 1980s, and had found that from the start of this construction program to the
finish, the per-kilowatt cost to build the French reactors had increased by more than a
factor of three. “Adjusted for inflation?,” I asked. “Yes, in real terms,” Amory replied.
1
2. Cost Escalation in French Nuclear Reactors Komanoff • January 2010
The implication was immense. France had begun and completed a hugely ambitious
nuclear power construction program, second in size only to the U.S. program, in a
relatively short quarter-century. Unlike the American electric utility companies, which
for the most part contracted plant design and construction to architect-engineering firms
that in turn tailored each project to local site and grid conditions, while struggling to keep
up with continually evolving regulatory criteria, the French utility, ÉDF, and reactor
supplier, Framatome, had largely standardized their reactor designs. The two
organizations had also maintained a cozy alliance with government regulators, fending
off citizen intervention in reactor design, siting and licensing and generally making it
difficult for the public to learn about emerging design defects and operational mishaps.
Yet evidently neither the ability in France to duplicate engineering and manufacturing
across dozens of reactors, nor the country’s compliant regulatory process and supportive
political culture, had kept the nuclear power cost-escalation virus at bay. That was
startling.
Amory suggested that I get in touch with the researcher, obtain his data, and subject it to
the same statistical treatment that I had done on U.S. nuclear costs thirty years ago. At
that time, I put public-domain cost data for completed U.S. reactors on a consistent basis,
and then showed, through rigorous statistical analysis, that their real per-kW costs had
risen almost 2.5-fold in just seven years (1971 to 1978). As I summed it up in my 1981
book, Power Plant Cost Escalation, 1 the increase in American nuclear costs was several
times greater than for contemporaneous coal-fired plants; yet those were at least getting
demonstrably cleaner, whereas throwing money at nuclear plants hadn’t stopped the
newest U.S. reactor, Three Mile Island Unit 2, from melting down disastrously in 1979.
The French Cost Data
The IIASA researcher was Arnulf Grubler, a PhD engineer and part-time professor at
Yale with a long list of books, articles and papers on energy policy and technological
change. Arnulf had dug up a 2000 report commissioned by French Prime Minister Lionel
Jospin that disclosed, for the first time, France’s year-by-year expenditures to begin and
complete 58 pressurized water reactors (PWRs) between 1971 and 1999.
The Jospin report didn’t provide individual reactor cost data. Nevertheless, Arnulf was
able to estimate them by artfully applying “characteristic time profiles of expenditures”
on the reactors, which he gleaned from reports published in the late 1970s by the French
utility, Électricité de France. The ÉDF documents showed a triangular cash-flow pattern
between start and completion, with the expenditure rate peaking in the middle. Applying
the best-fitting cash-flow shape and, presumably, adjusting it as necessary to ensure that
the sum of the expenditures assigned to each reactor matched the yearly totals in the
1
Power Plant Cost Escalation: Nuclear and Coal Capital Costs, Regulation, and Economics, Van Nostrand
Reinhold, 1981. Available for downloading from this link: <http://www.komanoff.net/nuclear_power/>.
2
3. Cost Escalation in French Nuclear Reactors Komanoff • January 2010
Jospin report, Arnulf derived what could be termed calculated costs for each of the 58
PWRs.
With each plant’s annual expenditures thus approximated, Arnulf converted the cash
flows to constant 1998 francs, using the French GDP deflator. This step adjusted the data
for inflation in the overall French economy, allowing plants built at different times to be
compared on a consistent cost basis — as if each plant had been built at the price levels
for commodities and labor that prevailed in France in 1998. Neither the original ÉDF
sector-wide cost data nor Arnulf’s calculated plant-cost data included interest during
construction, further facilitating comparison of costs of plants built in different periods.
In effect, Arnulf’s adjustment removed general price inflation in order to reveal the extent
of reactor cost escalation embodied in increases in construction inputs (more labor-hours,
materials, components, engineering effort) and/or price rises for these inputs that
transcended general inflation. (This type of adjustment has long been standard practice in
European electricity policy analysis, but had to be introduced to the U.S. in the late 1970s
by analysts from outside the electricity industry, myself included.) Arnulf then divided
each reactor’s constant-money construction cost by the reactor’s generating capacity, in
kilowatts, producing 58 data points in “constant francs per kilowatt.”
Arnulf hadn’t published these records, but after I contacted him, he generously shared
them with me. 2 Since the data are proprietary, I reproduce them here only selectively to
make key points and elucidate my statistical analysis. Given Arnulf’s experience and
probity, and seeing the care he took to assign the gross data to the individual reactors, I
am confident that the 58-reactor database is adequately accurate.
French Reactor Costs — A Quick First Pass
The 58 pressurized water reactors built by Électricité de France from the early 1970s into
the 1990s fall into three groups:
1. 34 “CP” reactors, 900 megawatts (approximate) capacity, construction of which
started between late 1971 and early 1981, a 9½-year period.
2. 20 “P4” reactors of 1,300 MW capacity, whose construction started over a 7-year
period from late 1977 to late 1984.
3. 4 “N4” reactors, 1,500 MW each, construction of which started over a 7-year
period from early 1984 to early 1991.
2
The data are discussed in A. Grubler, “An assessment of the costs of the French nuclear PWR program
1970–2000,” Interim Report IR-09-036, International Institute for Applied Systems Analysis, Oct. 6, 2009.
Available at <www.iiasa.ac.at/Admin/PUB/Documents/IR-09-036.pdf>.
3
4. Cost Escalation in French Nuclear Reactors Komanoff • January 2010
As Table 1 makes clear, the average costs of the first two groups of reactors differed only
modestly, by around 20%. That is many times less than the cost difference between either
group and the last, the 1,500-MW class reactors. This small group, comprising just four
units, averaged 112% higher costs per kW than the 900-MW group and 76% more than
the 1,300-MW group.
Table 1: French PWR Costs (in 1998 French Francs / kW)
Reactor Category N First Start Last Start Min Cost Max Cost Mean Cost
CP (900 MW) 30 1971.8 1981.2 5,843 7,301 6,355
P4 (1,300 MW) 24 1977.7 1984.8 6,627 10,163 7,665
N4 (1,500 MW) 4 1984.0 1991.3 10,947 17,499 13,460
Dates denote start of construction and are in decimal equivalents, e.g., 1971.8 denotes September 1971. Note that in
mid-1998 the currency conversion rate was approximately 6.1 French Francs to one U.S. dollar. 3
It is only a slight simplification to say that France’s per-kW nuclear plant costs roughly
doubled from the first 54 reactors to the last four. This apparent doubling of costs is
significant, and its reasons cry out for investigation. But limiting quantitative
observations to this observation would obscure important nuances within the underlying
averages. It would also leave unanswered more crucial questions: the annual rate of cost
escalation in the French nuclear program, and the extent of escalation for the program as
a whole.
French Reactor Costs — A Second Pass
The standard statistical technique for distilling trends from a data set is “regression
analysis,” specifically multiple or multivariate regression analysis. Regression analysis is
best described as a means of correlating an observed, dependent, “outcome” variable with
one or more independent (and possibly causal) variables simultaneously. This process,
which used to require specialized statistical software but can now be performed with
standard spreadsheet programs, yields a formula quantifying the contribution of each
independent variable to the predicted outcome. It “reports” not just the magnitude of each
correlation but its statistical significance — an assessment of whether the correlation
might have been a random occurrence as opposed to the more interesting alternative that
it reflects a systematic relationship.
Here, the dependent variable is reactor cost (in constant money) per kW. 4 The
independent variables I tested were those which I had reason to believe might be strongly
3
The Federal Reserve Bank of New York’s “Foreign Exchange Rates Historical Search” facility at
<http://www.ny.frb.org/markets/fxrates/historical/> yields, for July 1, 1998, a “noon buying rate” of 6.094
French francs for one U.S. dollar.
4
More precisely, the dependent variable here is the (natural) logarithm of cost per kW. Specifying the cost
as a logarithm enables the effect on costs of later construction starts (the first independent variable
4
5. Cost Escalation in French Nuclear Reactors Komanoff • January 2010
correlated with reactor costs, and/or those whose exclusion might bias the correlations
measured for other variables. (Note that while regression analysis renders a verdict on the
validity of each possible independent variable, it cannot instruct the researcher as to
which variables to test; that is up to the researcher’s judgment and expertise, guided by
substantive understanding of factors that might plausibly have an effect on the outcome.)
Following are the three variables that met these conditions for the French reactor costs:
1. Date of construction start — the hypothesis being that plants begun later might
have been subject to progressively more elaborate and/or stringent design criteria
that raised their costs.
2. Number of reactor construction starts in that year 5 — the hypothesis being that
building many plants at once might have allowed per-plant savings, perhaps by
freezing plant designs that otherwise were changing over time, perhaps through
other savings in engineering, logistics or labor.
3. Was the reactor an N4 (1,500-MW-class) plant — Table 1 made clear that costs
for these four plants were grossly in excess of most of the others (this is strikingly
apparent in Figure 1, further below.) The regression method would reveal,
statistically, the extent to which their higher costs were intrinsic to the N4 class,
vis-à-vis that the plants came later (factor #1) and that they weren’t built in groups
(factor #2).
The regression analysis is easily implemented in Microsoft Excel. Following is the table
of results and a discussion of their import.
Table 2: Regression Results for French PWR Costs (per-kW, inflation-adjusted)
Variable Impact on Costs 95% Range
1. Construction Start Date Costs increased 3.6% for each later year 3.1% – 4.1%
2. No. of reactors begun that year Costs fell 5.7% per doubling of reactor starts 3.9% – 7.4%
3. 1,500-MW (N4) Class? 25.6% higher cost if N4 (1,500-MW class) 15% – 37%
95% (confidence) range denotes range encompassing “true” cost impact with 95% probability. Relatively narrow
ranges shown indicate a high degree of confidence that each variable is actually correlated with reactor costs. R
Square value for the regression equation is 93%, indicating that the three variables together explain (account for) an
impressive 93% of variation among costs of the 58 reactors.
1. Date of construction start — This important result is the simplest to report: for
each increase in the year in which reactor construction began (i.e., for each later
year), reactor costs per kW increased by an average of 3.6% (in real terms).
discussed directly below) to be expressed as a constant percentage increase rather than as, say, a constant
additive amount, which would correspond to a declining percentage over time.
5
This independent variable was specified as the (natural) log of the number of reactors, in order to allow its
relationship to costs to be expressed as a constant percentage decrease per constant percentage increase in
the number. (See previous footnote for context.)
5
6. Cost Escalation in French Nuclear Reactors Komanoff • January 2010
2. Number of reactor construction starts in that year — This result is relative rather
than absolute. It says that doubling the number of plants started in a calendar year
— say, building 6 rather than 3, or 4 rather than 2 — reduced the costs of all
plants begun in that year by 5.7%, on average.
3. Was the reactor an N4 (1,500-MW-class) plant — If so, it cost 26% more than
otherwise.
Together, the three factors explain the approximate doubling of costs for the N4 reactors:
Because the N4 plants started construction nine years later, on average, than the CP and
P4 plants, they suffered nine more years of chronologically-based cost escalation, raising
their costs an average of 39%. 6 Because on average only 1.5 plants were started during
the years the N4 plants started construction, versus an average of 5.7 for the CP and P4
plants, the N4’s missed out on cost-cutting opportunities from mass reactor construction
to the tune of 11-12% higher costs. 7 Combine these two factors with the third, the 26%
intrinsic higher costs for the N4 design shown in Table 2, and the result is a 95% higher
average cost, 8 more or less matching (and explaining) the roughly two-fold cost
difference between the N4 plants and the earlier plants shown in Table 1.
Characterizing Cost Escalation in the French Nuclear Program
The most significant result from the regression model, in my view, is the 3.6% annual
increase in reactor costs. Indeed, in a real sense the greatest value of factors two and three
is to control for “confounding” factors (cost savings for multiple reactor starts, and higher
costs for the N4’s) so that the regression equation can reveal the “true” value of factor
one, annual cost escalation.
By comparison, in my 1980-1981 analysis of U.S. nuclear power plants that were
completed between late 1971 and late 1978, I measured the rate of real cost increase at
13.5% annually. That is three to four times the 3.6% per annum figure observed for the
French program. 9 On the other hand, the French figure was estimated through a
(regression) process that effectively neutralized the significantly higher costs for the N4
6
Calculated as the annual escalation factor, 1.0359, raised to the 9.35 power (the number of years between
the mean construction-start date of the N4 plants and that of the other 54 plants).
7
Calculated as the reciprocal of: 0.943 (the complement of the 5.7% cost saving per doubling of reactor
starts), raised to the following power: 5.7/1.5 divided by two.
8
Calculated as the product of the first factor, 1.39; the second factor, 1.116; and the third factor, 1.256.
9
The 13.5%/annum U.S. finding, from Power Plant Cost Escalation, op. cit., especially Chapter 10, is not
perfectly fungible with the 3.6%/annum result for the French reactors. The French result is apart from (i.e.,
controlled for) two non-chronological factors, whereas the U.S. result incorporated a half-dozen such
factors. Moreover, the U.S. result, unlike the French, adjusted for inflation in construction-sector inputs
such as labor, thus reducing it slightly, while incorporating (real) interest during construction, which raised
it slightly. Nevertheless, even taking these differences into account, the conclusion appears robust that
annual cost escalation for the U.S. reactors was three to four times as great as for the French.
6
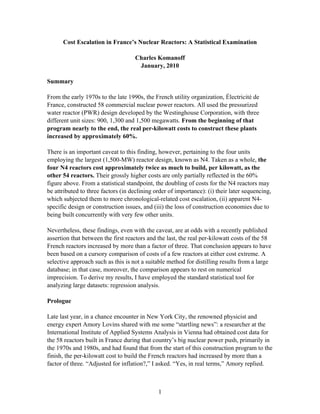
7. Cost Escalation in French Nuclear Reactors Komanoff • January 2010
plants by creating a special independent variable for those plants alone. Moreover, the
3.6%/year result for the French plants, while noteworthy, doesn’t fully characterize
overall cost escalation over the course of the French nuclear construction program. For
that, we need to return to Arnulf’s database, beginning with construction start dates for
the French reactors. These are summarized in Table 1, above, and shown in Figure 1,
below.
Fig. 1: Costs by Year of Construction for France's Reactors
20,000
Cost, French Francs (1998) per kW
16,000
N4 Reactors
(red triangles)
12,000
8,000
4,000
-
1970 1972 1974 1976 1978 1980 1982 1984 1986 1988 1990 1992
Construction Start
Both the table and figure make clear that 55 of the 58 reactors — all 34 CP’s, all 20 P4’s,
and one N4 — began construction during a 13-year period, from late 1971 to late 1984,
whereas the remaining three reactors, all N4’s, were begun later: on the last day of 1985,
in October 1988, and in April 1991. The rate of reactor construction starts per year in the
later period (covering the last three plants) was seven times less than in the later period
(covering the first 55).
The 3.6% per year cost-escalation rate was calculated on, and thus applies to, the date
that construction began. Two factors militate in favor of applying it over the 1971-1984
period and no further: first, very few reactors — just three — were begun after 1984;
second, with one exception (the first N4 unit), all of the 55 reactors that did begin
construction in 1971-1984 used one of two standard designs and were built under an
industrial regime characterized by concurrent construction of a large number of such
standardized reactors.
7
8. Cost Escalation in French Nuclear Reactors Komanoff • January 2010
The product of compounding a 3.6% annual increase over 13 years is an increase of
approximately 60%. (Arithmetically, raising 1.036 to the 13th power yields approximately
1.60.) We thus summarize our regression findings as follows:
1. From the early 1970s to the late 1990s, 58 commercial pressurized water reactors,
embodying three different unit sizes (900, 1,300 and 1,500 megawatts) were built
in France. From the beginning of this program nearly to the end, the real per-
kilowatt costs to construct these plants grew by approximately 60%.
2. An important caveat to this finding pertains to the four units employing the largest
(1,500-MW) reactor design known as N4. Taken as a whole, the four N4
reactors cost approximately twice as much per kilowatt to build as the other
54 reactors. Their grossly higher costs are only partially reflected in the 60%
figure above. Using a statistical simultaneous-correlation technique known as
regression analysis, this doubling of costs may be attributed to three factors (in
declining order of importance): (i) their later sequencing, which made them
subject to more chronological-related cost escalation, (ii) design or construction
issues inherent in the N4 design, and (iii) the loss of reactor economies due to
their being constructed in relative isolation from other units.
Clarifying the Record
The title of this section may appear presumptuous, particularly in that the record I aim to
clarify is the work of Dr. Arnulf Grubler, upon whose data I relied to construct my
statistical analysis of French nuclear costs.
Yet my findings differ importantly from those in the IIASA “interim paper” that Arnulf
published in October 2008, 10 a few weeks prior to my impromptu meeting with Amory
Lovins in New York, as this excerpt from the abstract of Arnulf’s paper shows:
Drawing on largely unknown public records, [this] paper reveals for the first time
both absolute as well as specific reactor costs and their evolution over time. Its
most significant finding is that even this most successful nuclear scale-up was
characterized by a substantial escalation of real-term reactor construction costs.
Specific costs per kW installed capacity increased by more than a factor of
three between the first and last reactor generations built. (emphasis added)
If by “generations” Arnulf is referring to all reactors in any of the three classes presented
here in Table 1, then his conclusion which I have bold-faced above does not appear to be
supported by the data. The straightforward computation of averages in Table 1
demonstrates that the four N4 (1,500-MW) reactors as a class were only a little more than
10
See citation in footnote 2, above.
8
9. Cost Escalation in French Nuclear Reactors Komanoff • January 2010
twice as expensive to build, per kilowatt, as the thirty units comprising the first group (the
900-MW CP reactors).
But even that fact, regarding the doubling of costs, appears to give undue weight to the
high costs of the N4 reactors that drew the curtain on the French PWR program in the
1990s. The truest “takeaway” from the program’s costs, in my view, is that over the 13-
year period in which ÉDF began construction of 55 of the 58 reactors that made up the
program, real per-kW costs increased approximately 1.6-fold, i.e., by 60%. To be sure,
this relative containment of costs was undercut by the significant additional cost
escalation suffered by the trio of N4 reactors whose construction began after the 13-year
period. Nevertheless, France’s experience in building the 58 reactors as a whole stands in
impressive contrast to the American reactor program, the real per-kW costs of which
increased by approximately 140% (2.4-fold) over just the seven years, 1971-78,
corresponding to the first phase of the French program, and probably by 400% (5-fold)
from 1971 to the late 1980s. 11
How, then, did Arnulf come to report that real reactor costs (per kW) more than tripled
over the course of the French program? I’m not entirely sure, but this passage, from pp.
25-26 of his paper, may point to possible problems:
The reference model suggest[s] a cost escalation from 4,200-4,400 to 14,500
FF98 [per kW] between the CP0/CP1 reactors constructed [completed] during
1974–1977 and the last N4 reactors constructed [completed] in the mid-1990s,
i.e., by a factor of 3.4.
A glance at Fig. 1, above, which displays, in chronological order of start of construction,
the per-kW costs that Arnulf provided to me for each of the 58 reactors, shows that no
reactors were built for even close to the minimum level of 4,200 to 4,400 French francs
per kW that Arnulf claimed in his paper. Rather, the least-cost plants cost around 5,840
French francs per kW. (All figures are in 1998 terms.)
The ratio of Arnulf’s high-end figure, 14,500 French francs per kW, to the corrected low-
end figure of 5,840 FF/kW, is approximately 2.5, which is considerably less than 3.4. But
there is an additional correction to be made: only a single, solitary plant came in at
Arnulf’s high-end figure of 14,500 or more per kW, as Fig. 1 shows. Indeed, aside from
that reactor, only one other unit cost more than 12,000 per kW. The ratio of 12,000 to
5,840, which is 2.05, would indicate only a doubling of costs. It appears, then, that
11
The correspondence is inexact because the same dates apply to construction starts for France and
construction completions for the U.S. The 140% figure is referenced here in an earlier footnote, in the
section “Characterizing Cost Escalation.” The 400% figure is a rough estimate based on the premise that
real U.S. per-kW reactor costs somewhat more than doubled from late-1970s completed plants to late-
1980s plants. Combining a 140% increase and a 100+% increase yields a roughly 400% increase.
9
10. Cost Escalation in French Nuclear Reactors Komanoff • January 2010
Arnulf’s factor of 3.4 is an artifact of understating the low end of the cost scale and using
just two data points to represent the high end.
Yet even using a more rounded (and accurate) group of endpoints invariably builds in an
element of guesswork, or, worse, arbitrariness, since there is no a priori reason to select
one group over another. Moreover, even if there were a canonical procedure for selecting
the endpoints, drawing conclusions from them alone would effectively discard the
intervening data, corresponding to some 50 plants — the vast majority of the sample.
The antidote is to apply regression analysis to the entire sample. In this way, every
plant’s cost contributes to measuring the cost trends. While there will always be an
element of judgment in the analyst’s choice of independent variables to be tested (and in
specifying their functional forms, e.g., exponential via linear via logarithmic), at least that
is transparent, and other analysts are free to test other variables. Most importantly, with
regression analysis, all of the data contribute to estimating the influence of the
independent variables on the dependent variable.
Suggestions for Further Research
This paper is a modest effort to explore the terrain opened by Arnulf Grubler’s 2009
investigations into historical French nuclear power costs and clarify his results. My
current interests lie elsewhere — primarily in improving urban transportation through
traffic pricing, and in establishing and communicating the environmental and equity
benefits of taxing carbon emissions. Following are suggestions for research by others:
1. Validate Arnulf’s procedure for assigning annual French “gross” costs of nuclear
plant construction to the individual reactors undertaken in those years. If this
results in an altered cost database, rerun the regression model to derive corrected
coefficients corresponding to the model’s three explanatory factors.
2. Determine the factors that brought about the observed annual 3.6% real escalation
in reactor per-kW costs reported here. Investigation of the “causes” should be at
several levels, including the engineering level (i.e., were there design and
construction changes that increased the required inputs of labor and materials?),
and, in turn, identifying the factors that led to those engineering changes.
3. Determine the causes of the sharply higher costs observed for the N4 reactors.
One avenue of inquiry might be the influence of the 1986 Chernobyl accident, in
what was then the Soviet Union, on French regulatory criteria and, hence, reactor
costs. Since no N4 reactors had been completed (in fact, two hadn’t begun
construction while the other two had barely started), this group could easily have
been more affected than the CP (900-MW) or P4 (1,300-MW) plants. Other
factors that may also have been at work should be investigated as well.
10
11. Cost Escalation in French Nuclear Reactors Komanoff • January 2010
4. Improve upon my modeling of the savings from concurrent reactor construction
(“factor 2” in Table 2). As noted, this variable, denoting the number of reactors
begun in a given year, was included in the regression model to help isolate the
true annual cost-escalation rate. However, the phenomenon of “construction start
proximity” is worth investigating in its own right. It doubtless can be specified
more incisively than I have done here — perhaps with a construction-start-date
“radius” (e.g., “radius” of months around the start of construction in which X
other reactors were also started), or with a different functional form, or by a
different approach altogether. In any case, the pattern of reduced costs through
building many units at once merits attention, not just through finer statistical
analysis but with informed interpretation.
5. The model does not attempt to distinguish between CP and P4 reactors, or within
either class, or between building reactors in pairs, quartets or sextets. Nor have I
investigated possible regional variations in costs, e.g., plants built in proximity to
large populations vs. small populations, or site-related differences such as
inclusion of cooling towers vs. less-expensive once-through cooling systems. To
the extent that any of these subgroups might be expected to have had cost
advantages or disadvantages, they should be tested with appropriate variables.
Similarly, researchers with greater knowledge of the French program should test
their own hypotheses to explain the remaining variations in the reactors’ costs.
Acknowledgments and Authorship
The author thanks Nancy Anderson, Ernst R. Habicht, PhD, Russell Lowes, Deena M. Patel, PhD,
Vince Taylor, PhD, and Alan Zaslavsky, PhD, for their many comments and suggestions that
significantly improved the substance and writing of this paper. The views expressed in this paper
are solely the responsibility of the author.
Charles Komanoff is an activist, energy-economist and policy-analyst. In the 1970s and 80s
Charles gained prominence for deconstructing the spiraling costs of nuclear power in the United
States as author-researcher and expert-witness. He subsequently “re-founded” and led NYC’s
bicycle-advocacy group Transportation Alternatives in the 1980s, helped found the Tri-State
Transportation Campaign in the 1990s, and co-founded the Carbon Tax Center in 2007. Charles’s
writings include books, journal articles, op-ed essays and landmark reports such as Subsidies for
Traffic, Killed By Automobile, and the Kheel Report on financing free transit through congestion
pricing in New York City. He blogs about urban transport on Streetsblog and energy policy on
Grist. A math-and-economics graduate of Harvard, Charles lives with his wife and two sons in
lower Manhattan.
For links and more information, go to www.komanoff.net. This paper is available on-line at
www.komanoff.net/nuclear_power/Cost_Escalation_in_France’s_Nuclear_Reactors.pdf.
11